
A new all time high indicates the S&P is still in a bull market. Dow Theory has confirmation.
Summary: A pullback is still expected here or very soon indeed. It should begin this week. The target is still about 2,120 and the lilac trend line.
Last monthly chart for the main wave count is here.
Last weekly chart is here.
New updates to this analysis are in bold.
MAIN WAVE COUNT
DAILY CHART
Click chart to enlarge.
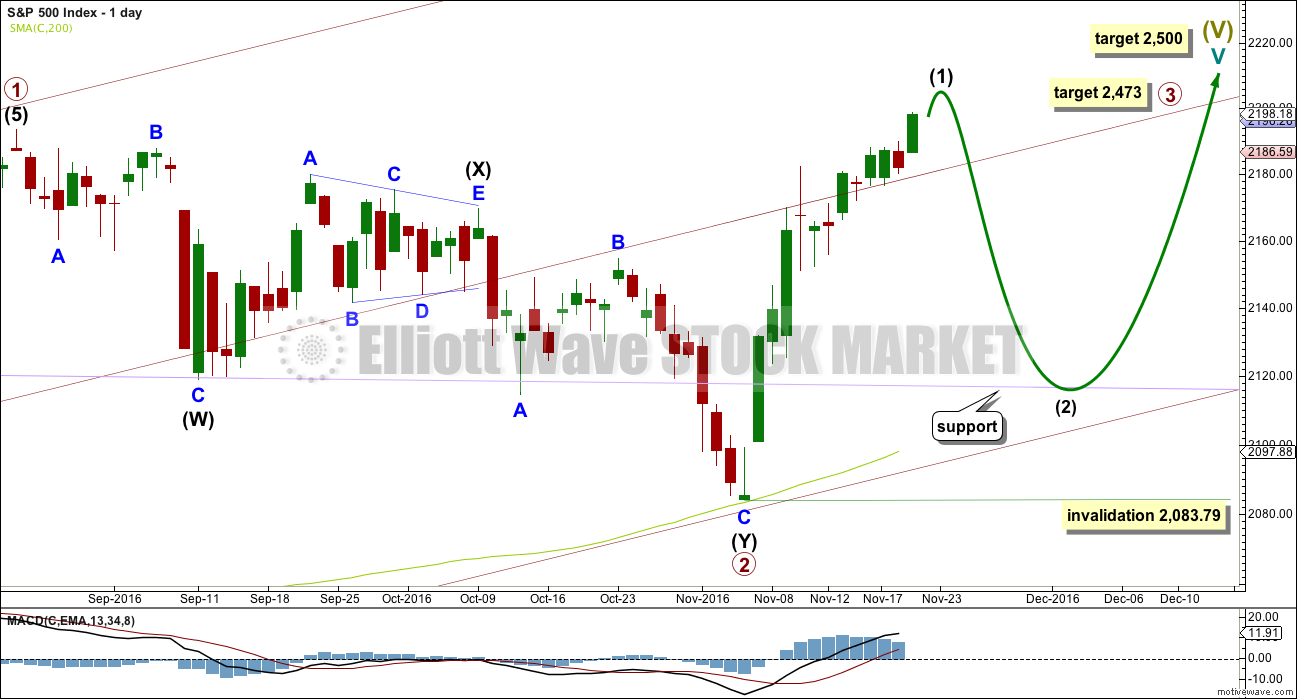
Primary wave 2 now looks to be complete as a double zigzag. Within primary wave 2: intermediate wave (W) was a very shallow zigzag lasting a Fibonacci 13 sessions; intermediate wave (X) fits perfectly as a triangle lasting 20 sessions, just one short of a Fibonacci 21; and intermediate wave (Y) also lasting 20 sessions deepens the correction achieving the purpose of a second zigzag in a double.
Primary wave 2 looks like it has ended at support about the lower edge of the maroon channel about primary wave 1, and at the 200 day moving average.
With upwards movement slicing cleanly through the lilac trend line, this behaviour looks to be more typical of an upwards trend. At this stage, corrections within primary wave 3 may be expected to turn down to test support at this trend line.
At 2,500 cycle wave V would reach equality in length with cycle wave I.
At 2,467 primary wave 3 would reach equality in length with primary wave 1. This is the ratio used in this instance because it fits with the higher target at 2,500.
Intermediate wave (2) may not move beyond the start of intermediate wave (1) below 2,083.79.
Primary wave 3 may show some strength compared to primary wave 1, but it does not have to. This wave count sees price in a final fifth wave at cycle degree, within a larger fifth wave at Super Cycle degree. The upcoming trend change may be at Grand Super Cycle degree, a once in generations trend change. This final fifth wave should be expected to exhibit great internal weakness; this market may appear broken. That would be typical behaviour for a final fifth wave of this magnitude.
HOURLY CHART
Click chart to enlarge.
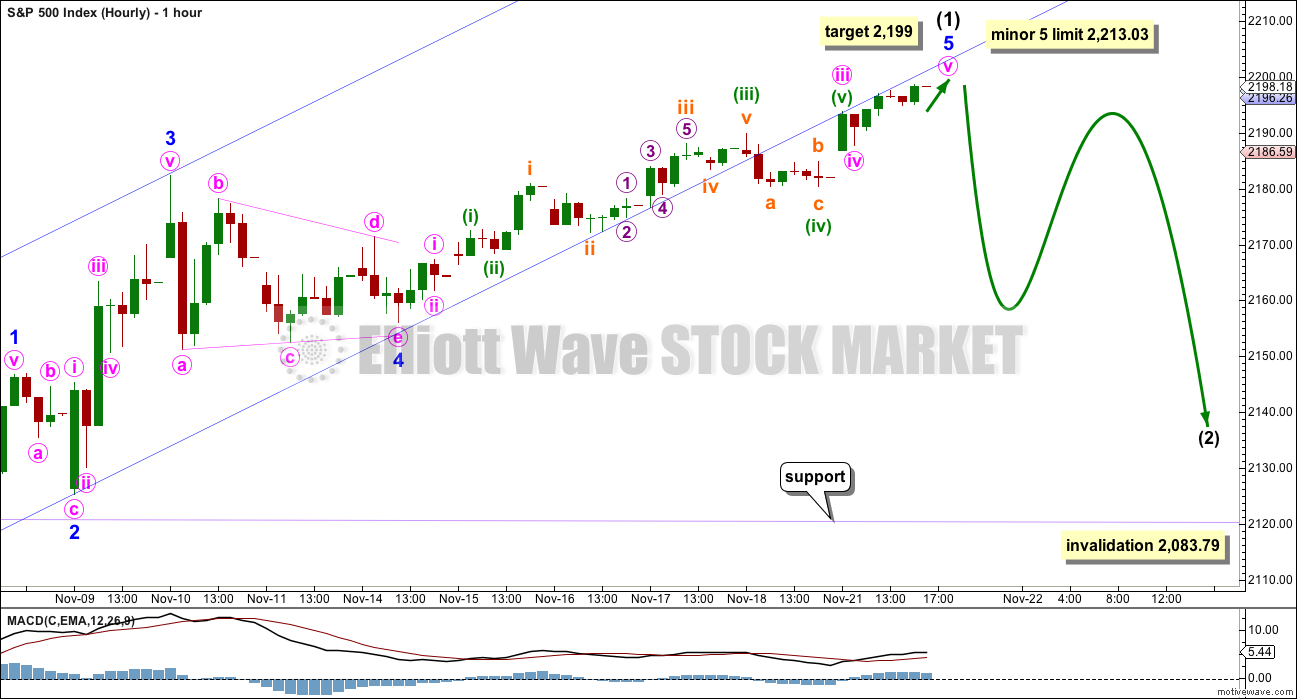
There is no Fibonacci ratio between minor waves 1 and 3. Minor wave 3 is slightly shorter than minor wave 1. Because a core Elliott wave rule states a third wave may not be the shortest, this limits minor wave 5 to no longer than equality in length with minor wave 3 at 2,213.03.
At 2,199 minute wave v would reach equality in length with minute wave i.
Minor wave 2 is a shallow 0.34 zigzag and minor wave 4 is a shallow 0.46 regular contracting triangle. This gives perfect alternation in structure and some alternation in depth.
Minor wave 5 is showing weakness. MACD has failed to make a new high while price has moved upwards. This wave lacks momentum.
Downwards movement for Friday broke below the lower edge of the best fit channel. The S&P can breach channels yet continue in the old direction, and that is what has happened for Monday. The channel breach may only be read as a warning of weakness.
Intermediate wave (2) may be expected to last about a Fibonacci 5, 8 or 13 days. It is most likely to be a single or double zigzag structure. It is most likely to correct to close to the 0.618 Fibonacci ratio of intermediate wave (1), which should be close to support about 2,120 and the lilac trend line.
TECHNICAL ANALYSIS
WEEKLY CHART

Click chart to enlarge. Chart courtesy of StockCharts.com.
A smaller range upwards week on lighter volume looks like bulls are tiring. Some downwards or sideways movement this week is a reasonable expectation.
There is no close by resistance line on On Balance Volume to stop a rise in price. There is no divergence between OBV and price to indicate weakness here.
RSI is not extreme. There is room for price to continue to rise.
DAILY CHART
Click chart to enlarge. Chart courtesy of StockCharts.com.
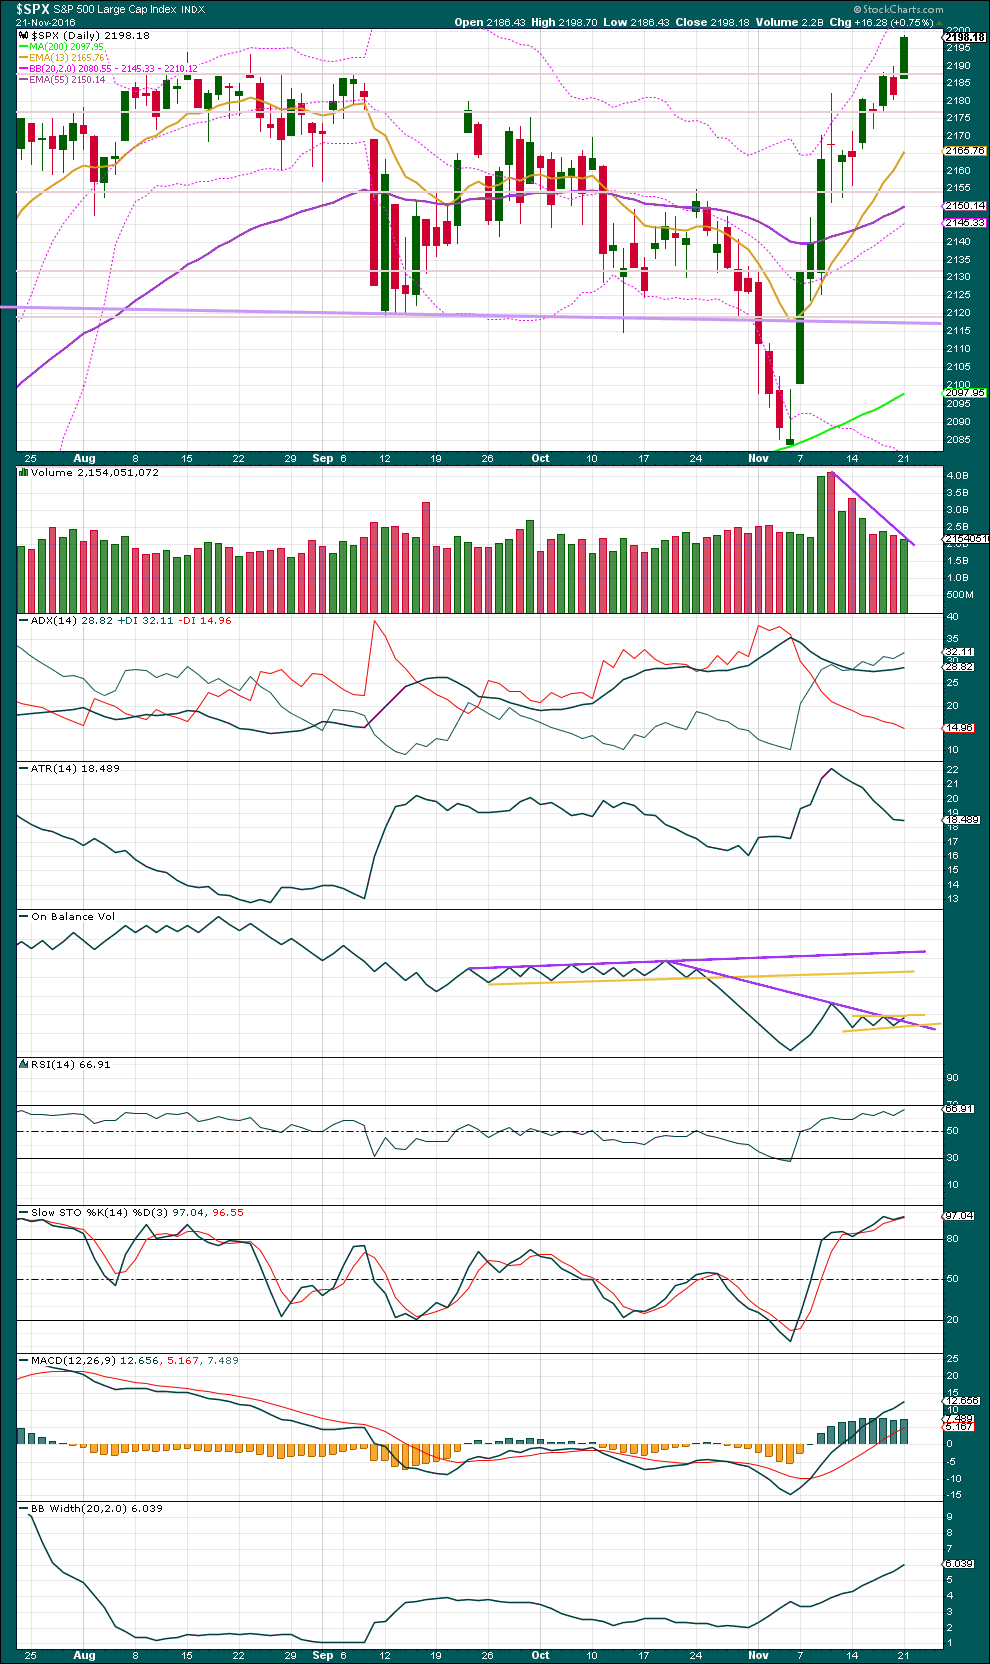
A reasonably strong upwards day importantly makes a new all time high for the S&P. It comes with a further decline in volume though, so this rise in price is suspicious. A correction should come sooner rather than later.
ADX is increasing, indicating an upwards trend. Bollinger Bands agree as they continue to widen.
ATR is still declining though. There is something wrong with this trend; it does not look normal and healthy.
MACD is still bullish.
There is some very slight divergence with Stochastics and price, and Stochastics is overbought. Today price made a new high above the prior high of the 17th of November, but Stochastics made a slightly lower high. This indicates bulls are exhausted and overextended here. It does not however indicate that price must turn here, only that we should look out for a change to either sideways or downwards here or very soon.
There is no divergence between price and RSI and RSI is not yet extreme. There is further room for price to rise.
On Balance Volume has broken slightly above the sloping purple line. This break is a small bullish signal, but the line is too steeply sloped to have strong technical significance. A smaller yellow line is drawn for close by resistance. A break above that too would be another small bullish signal.
It is clear that price is trending upwards, and it is also clear that bulls are tired. What is not clear is exactly when and where a pull back will begin, only that it should be sooner rather than later. The round number pivot of 2,200 should be expected to offer resistance.
VOLATILITY – INVERTED VIX CHART
Click chart to enlarge. Chart courtesy of StockCharts.com.
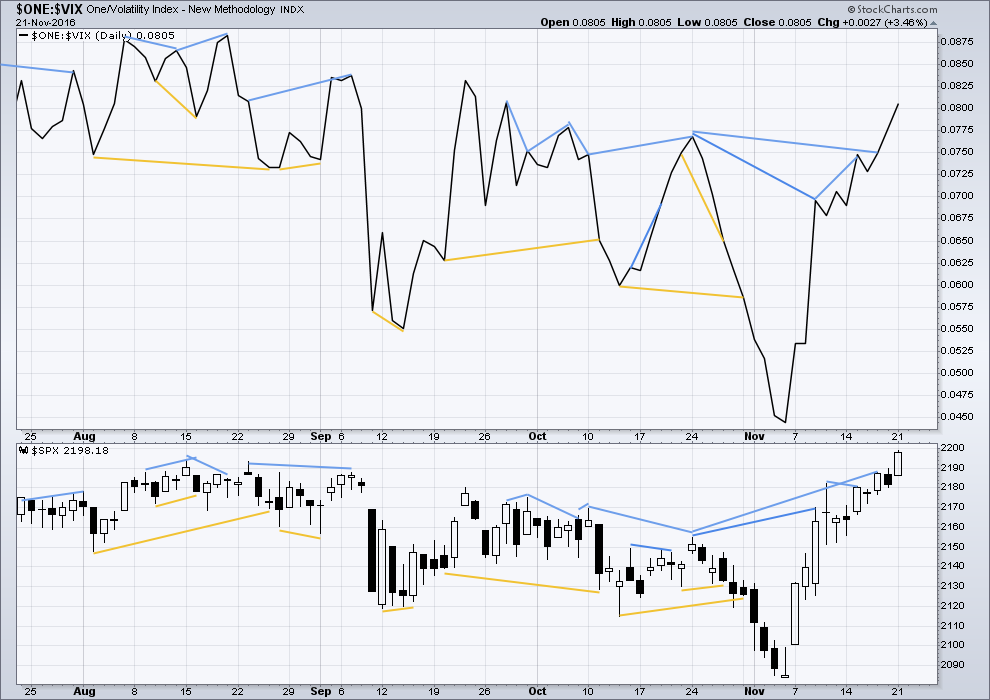
There are a few instances of multi day divergence between price and inverted VIX noted here. Bearish divergence is blue. Bullish divergence is yellow. It appears so far that divergence between inverted VIX and price is again working to indicate short term movements spanning one or two days. While this seems to be working more often than not, it is not always working. As with everything in technical analysis, there is nothing that is certain. This is an exercise in probability.
BREADTH – AD LINE
Click chart to enlarge. Chart courtesy of StockCharts.com.
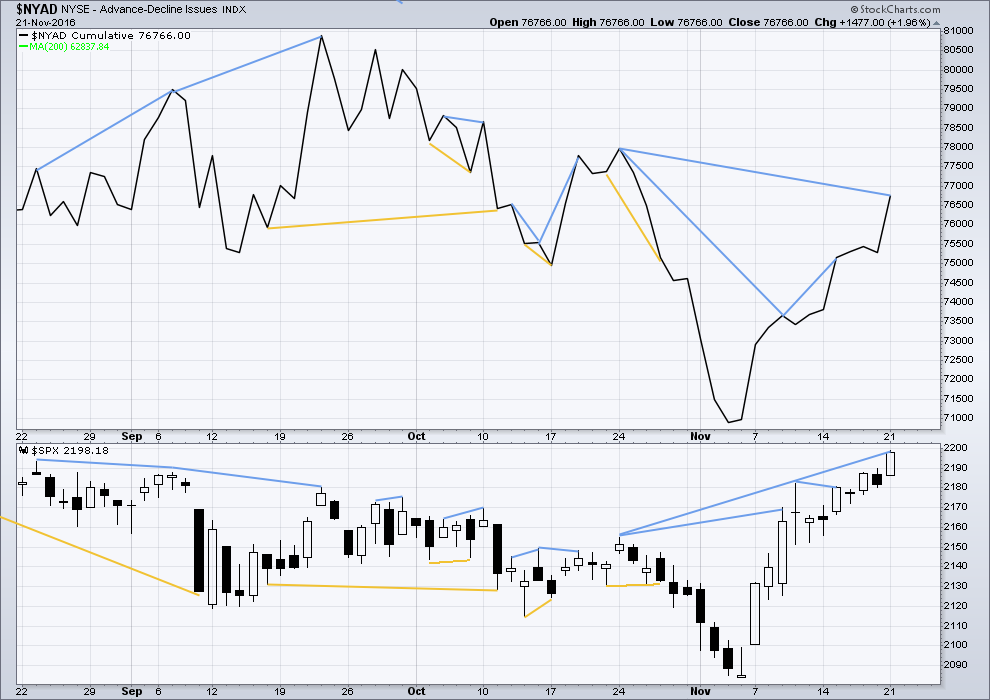
Short term bullish and bearish divergence is again working between price and the AD line to show the direction for the following one or two days.
On Friday price moved overall higher with a higher high and a higher low than Thursday. The AD line however moved lower. This single day divergence is also bearish. It was not followed by a downwards day though, so it is considered to have failed.
There is still mid term bearish divergence between the highs of the 24th of October and today: price has made higher highs, but the AD line has still made lower highs. This is regular bearish divergence and indicates a lack of market breadth to this upwards movement.
BREADTH – MCCLELLAN OSCILLATOR
Click chart to enlarge. Chart courtesy of StockCharts.com.
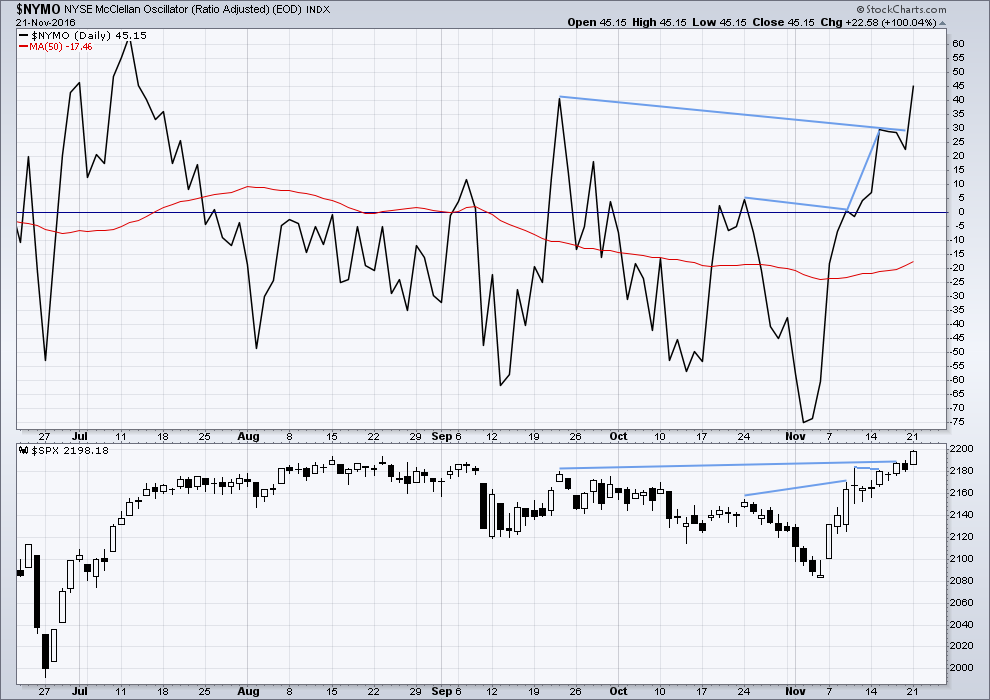
On the 21st August, 2015, the McClellan Oscillator reached -71.56. Price found a low the next session, 104 points below the closing price of the 21st August. This very extreme reading for the 24th August would have been a strong indicator of a low in place.
On the 11th December, 2015, the McClellan Oscillator reached -80.82. It moved lower the next session to -92.65 and price moved 19 points lower. The extreme reading of 11th December might possibly have led to an expectation of a bigger bounce than the one that occurred, and might have misled analysis into missing the strong fall from 29th December to 20th of January.
The next most recent occasion where this oscillator was extreme was the 8th January, 2016. It reached -66.25 on that date. The low was not found for seven sessions though, on the 20th January 2016, almost 110 points below the closing price of the 8th January. At the low of the 11th February, there was strong bullish divergence with price making new lows and the oscillator making substantially higher lows. This may have been a strong warning of a major low in place.
The most recent occasion of an extreme reading was -75.05 on the 2nd of November. The last low came two days later.
As an indicator of a low this is not it. It is a warning of extreme levels. The next thing to look for would be some divergence with price and this oscillator at lows. Divergence is not always seen at lows, but when it is seen it should be taken seriously. Any reading over 100 should also be taken very seriously.
This indicator will be approached with caution. It is one more piece of evidence to take into account.
There is now two days running of divergence between price and the McClellan Oscillator. The oscillator moved lower while price moved higher for Thursday and Friday. Market breadth declined although price moved higher. This divergence is bearish. This divergence today is considered to have failed as it was followed by a reasonably strong upwards day and not downwards.
The McClellan Oscillator is not extreme. There is still plenty of room for price to rise.
DOW THEORY
Major lows within the old bull market:
DJIA: 15,855.12 (15th October, 2014) – closed below on 25th August, 2015.
DJT: 7,700.49 (12th October, 2014) – closed below on 24th August, 2015.
S&P500: 1,821.61 (15th October, 2014) – has not closed below this point yet.
Nasdaq: 4,117.84 (15th October, 2014) – has not closed below this point yet.
Major highs within the bear market from November 2014:
DJIA: 17,977.85 (4th November, 2015) – closed above on 18th April, 2016.
DJT: 8,358.20 (20th November, 2015) – closed above this point on the 9th of November, 2016.
S&P500: 2,116.48 (3rd November, 2015) – closed above this point on 8th June, 2016.
Nasdaq: 5,176.77 (2nd December, 2015) – closed above this point on 1st August, 2016.
Dow Theory Conclusion: The transportations indicate an end to the prior bear market. The transportation index confirms a bull market.
This analysis is published @ 10:34 p.m. EST.
If I have the minor 4 triangle right, then minor 5 has to end soon. It could go up for another one or two days by a little more, but 2,213.03 is getting close now.
The 0.618 Fibonacci ratio is now at 2,129.54. This is above support at 2,120 and above the lilac trend line.
You may have to take a look at what it means if 2213, the maximum limit for Minor 5, is broken. It is only 15 SPX points away at the moment. I will not be surprised if it is surpassed.
We finally have 5 waves up on VIX and UVXY on the 5 minute charts. Lets see how this holds up.
But VIX has gone back up and tagged the lower channel line it broke yesterday. This is the point that Vern indicated earlier as decisive.
True. I will have to do that.
UVXY so far looks like it may be putting in a small green inside daily candlestick…
I must say I am observing with a great deal of bemusement all the talking heads asserting that a FED rate hike in December is a 100% certainty. The quiet implosion in the bond market is probably the most under-reported news story of the day. I suspect this expectation is already priced into equities. What if they don’t?
It seems to me that not many people truly understand the implications for insolvent governments continuing to serve their debts that is tied to higher interest rates. I have always contended that the FED will never raise rates of their own volition. I expect them to find another lame excuse to do nothing. This time however, the outcome is gong to be quite different I suspect. The long end of the yield curve will initially fall in response to the announcement that they will continue to sit on their clammy hands. I think the short end will continue to march higher. At some point the lights are going to go on and the long bond will break its decades old trend-line that it is currently testing, after an initial bounce off it in response to FED inaction. When that line breaks, it’s checkmate for the global bond bubble. Kimble has a few interesting charts on the subject.
Vern,
For right or wrong reasons, the 36 year bull market in bonds is over. Rates are going higher and the biggest surprise next year will be globally rates going higher .
Yep! The “bond king” Bill Gross is of that same opinion We are due for a short bounce in the long bond but I do agree; yields globally are on an unstoppable path higher. The carnage is going to be considerable as central banksters are dragged kicking and screaming into the new universe of higher rates for the foreseeable future.
Scaled a few more longs. I think the uptrend continues this week with some profit booking tomorrow maybe. We have Italian Referendum Dec3/4 where we could have some fireworks. Markets may correct some in first week of December. Will be adding some more hedges this week. 2215-2230 is in the cards for this week. If he has some market friendly cabinet appointments announced this week, then markets may have some more short covering. Oil is also helping so far this week for bulls. Happy Thanksgiving to all.
RUT / IWB has moved up over 6% in 12 trading days. SPX have risen approximately 120 points (almost 6%) in the same time frame. This will be known as the Trump Election Rally. Certainly this is a powerful move as measured by price alone.
The internals are degenerating as indicated by volume and more. Most of the TA we are doing indicates that the market should correct any day now and correct strongly.
But remember back in July of this year as the SPX broke above 2120 and then made a new ATH above 2134. All our analysis indicated the market must turn around and at least correct. Most of us were so certain; convinced by our analysis. But it did not correct for roughly 30 trading days and reached 2194. We were all befuddled and confused. Lara used the term “Shell Shock”.
Are we experiencing Deja Vu?
For the immediate future, I am standing aside and watching. If an excellent opportunity to take a short position comes along, I may grab it. But if not, that is okay too. I am waiting for the next swing low at the conclusion of Primary (2) down to re-position long and ride this wave up.
For those of you in the US, have a great Thanksgiving Day celebration. For the rest of you, have a great weekend. Paresh, our thoughts and prayers are still with you. Take care. Thanks Lara for all your analysis and commentary.
Blessings to all.
Blessings to you as well Rodney. Have a great one.
Me too Rodney, I’m waiting. I’ve been stopped out of my DJIA short.
I’m wary of entering this upwards trend because it looks tired.
I’ll wait for the pullback to enter long.
UVXY has now 7 red daily candlesticks in a row.
This thing has gotta end soon…. how many more can it do?
I have never ever seen this extreme a move persist for so long. There may be more going on here than meets the eye. A time for great caution imo….
TLT also trading in excess of 8% below its 50 dma, an unprecedented event. The extremes in the market are now historic, and it seems that few are really paying attention…
UVXY from the high on 11/3 has surpassed equal legs with the 123% coming in at 9.53 and the extreme 1.618 coming in at 6.8, which should be the absolute low, IMHO.
Interesting. I have a hard stop at 10.00 for both my VIX and UVXY long positions.
I am noticing an extreme departure from the mean in quite a few charts, not just equities. Unless the age-old principle of reversion to the mean has been abrogated as of November 2016, quite a few markets are very much over-due for quite a snap-back. Actually, spotting extreme market distortions is one technique used by a few traders I know. The problem for the rest of us not having that particular set of skills in knowing when the distortion will end; they can persist for quite some time. The current situation with multiple charts continuing to challenge the upper BB is something I have never seen in all the years I have been watching that particular metric. Somthing big is afoot methinks… 🙂
I agree, I’m hoping when we hit 2213 area, it’s Katie bar the door.
VIX broke its uptrend line so this manic run could well continue for a while. If it comes back up to test the underside and reverses I may have to consider an earlier than planned exit of my long vols….nuts! 🙂