
Yesterday’s analysis again expected downwards movement. This is not what happened.
The invalidation point on the hourly chart was breached by upwards movement.
Summary: A downwards pullback is still expected to find support about 2,120 and the lilac trend line. This view is today supported by divergence with price and inverted VIX, the AD line and the McClellan Oscillator.
Last monthly chart for the main wave count is here.
Last weekly chart is here.
New updates to this analysis are in bold.
MAIN WAVE COUNT
DAILY CHART
Click chart to enlarge.
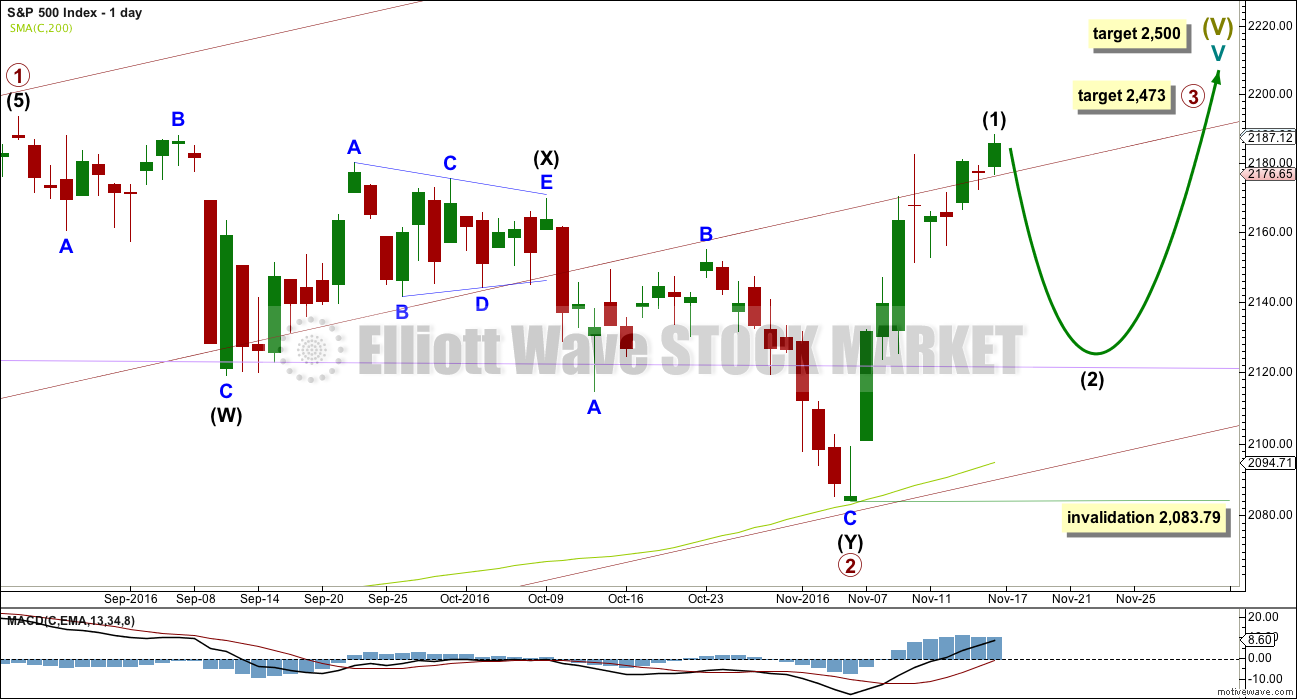
Primary wave 2 now looks to be complete as a double zigzag. Within primary wave 2: intermediate wave (W) was a very shallow zigzag lasting a Fibonacci 13 sessions; intermediate wave (X) fits perfectly as a triangle lasting 20 sessions, just one short of a Fibonacci 21; and intermediate wave (Y) also lasting 20 sessions deepens the correction achieving the purpose of a second zigzag in a double.
Primary wave 2 looks like it has ended at support about the lower edge of the maroon channel about primary wave 1, and at the 200 day moving average.
With upwards movement slicing cleanly through the lilac trend line, this behaviour looks to be more typical of an upwards trend. At this stage, corrections within primary wave 3 may be expected to turn down to test support at this trend line. While after hours movement did not find support there, the New York session did.
At 2,500 cycle wave V would reach equality in length with cycle wave I.
At 2,467 primary wave 3 would reach equality in length with primary wave 1. This is the ratio used in this instance because it fits with the higher target at 2,500.
The structure of intermediate wave (1) is today reanalysed. It may be about to end with one slight new high tomorrow. Intermediate wave (2) may not move beyond the start of intermediate wave (1) below 2,083.79.
Primary wave 3 may show some strength compared to primary wave 1, but it does not have to. This wave count sees price in a final fifth wave at cycle degree, within a larger fifth wave at Super Cycle degree. The upcoming trend change may be at Grand Super Cycle degree, a once in generations trend change. This final fifth wave should be expected to exhibit great internal weakness; this market may appear broken. That would be typical behaviour for a final fifth wave of this magnitude.
HOURLY CHART
Click chart to enlarge.
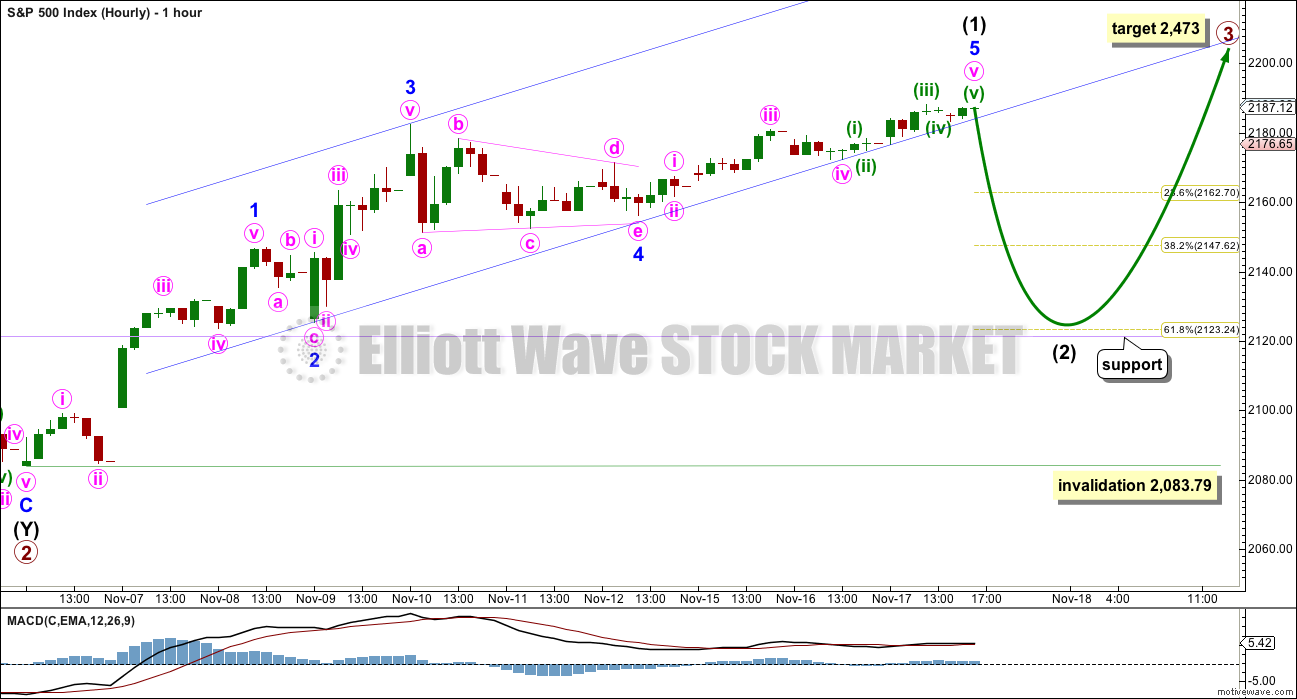
The structure of intermediate wave (1) is today reanalysed with the new high as part of this wave. On the five minute chart, it looks like one more slight high for minuette wave (v) may be all that is needed to complete the whole structure at all degrees for intermediate wave (1) upwards.
There is no Fibonacci ratio between minor waves 1 and 3. Minor wave 3 is slightly shorter than minor wave 1. Because a core Elliott wave rule states a third wave may not be the shortest, this limits minor wave 5 to no longer than equality in length with minor wave 3 at 2,213.03.
Minor wave 2 is a shallow 0.34 zigzag and minor wave 4 is a shallow 0.46 regular contracting triangle. This gives perfect alternation in structure and some alternation in depth.
Minor wave 5 is showing weakness. MACD has failed to make a new high today while price has moved upwards. This wave lacks momentum. Price is sitting along the lower edge of the best fit channel.
When price moves strongly below this channel, then expect that intermediate wave (2) has begun. At that stage, redraw the Fibonacci retracement along the length of intermediate wave (1). The target for intermediate wave (2) will be the 0.618 Fibonacci ratio of intermediate wave (1). This target should be close to the support line at 2,120 and the lilac trend line.
Intermediate wave (1) has so far lasted 9 days. It may not exhibit a Fibonacci duration.
Intermediate wave (2) may be expected to last about a Fibonacci 5, 8 or 13 days. It is most likely to be a single or double zigzag structure.
TECHNICAL ANALYSIS
WEEKLY CHART
Click chart to enlarge. Chart courtesy of StockCharts.com.
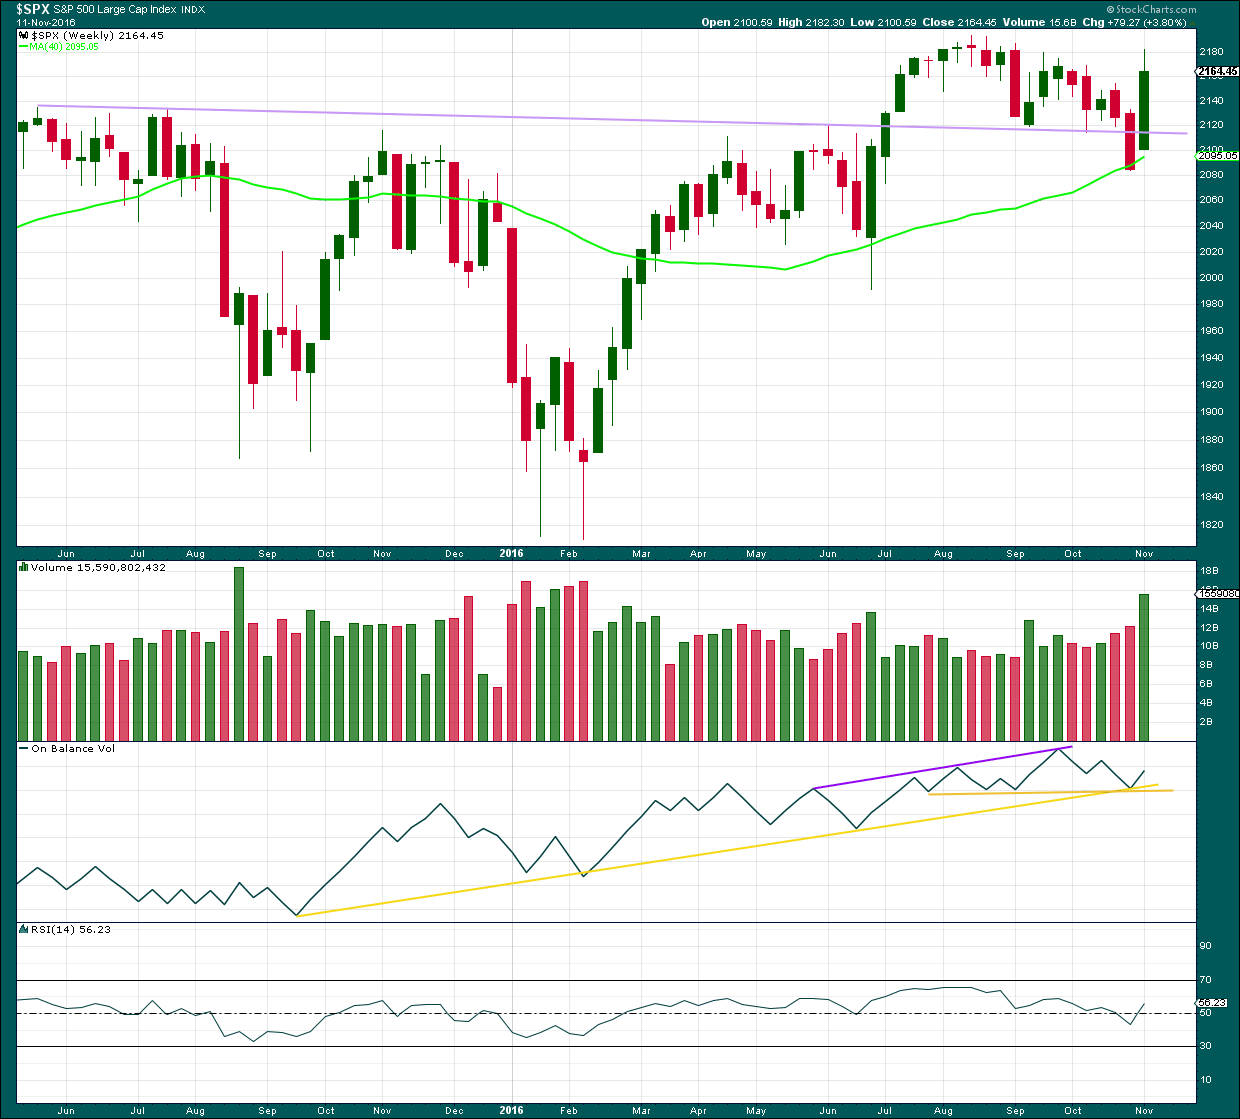
A break back up above the lilac trend line is very bullish. This line is now weakened because of the break, but it should still be expected to provide some support if price turns down a little.
Price has found support at the 40 week / 200 day moving average.
Upwards movement last week has strong support from volume. This supports the Elliott wave count.
On Balance Volume found support at the two yellow trend lines. This also supports the Elliott wave count.
RSI is not extreme, so there is room for price to rise further.
DAILY CHART
Click chart to enlarge. Chart courtesy of StockCharts.com.
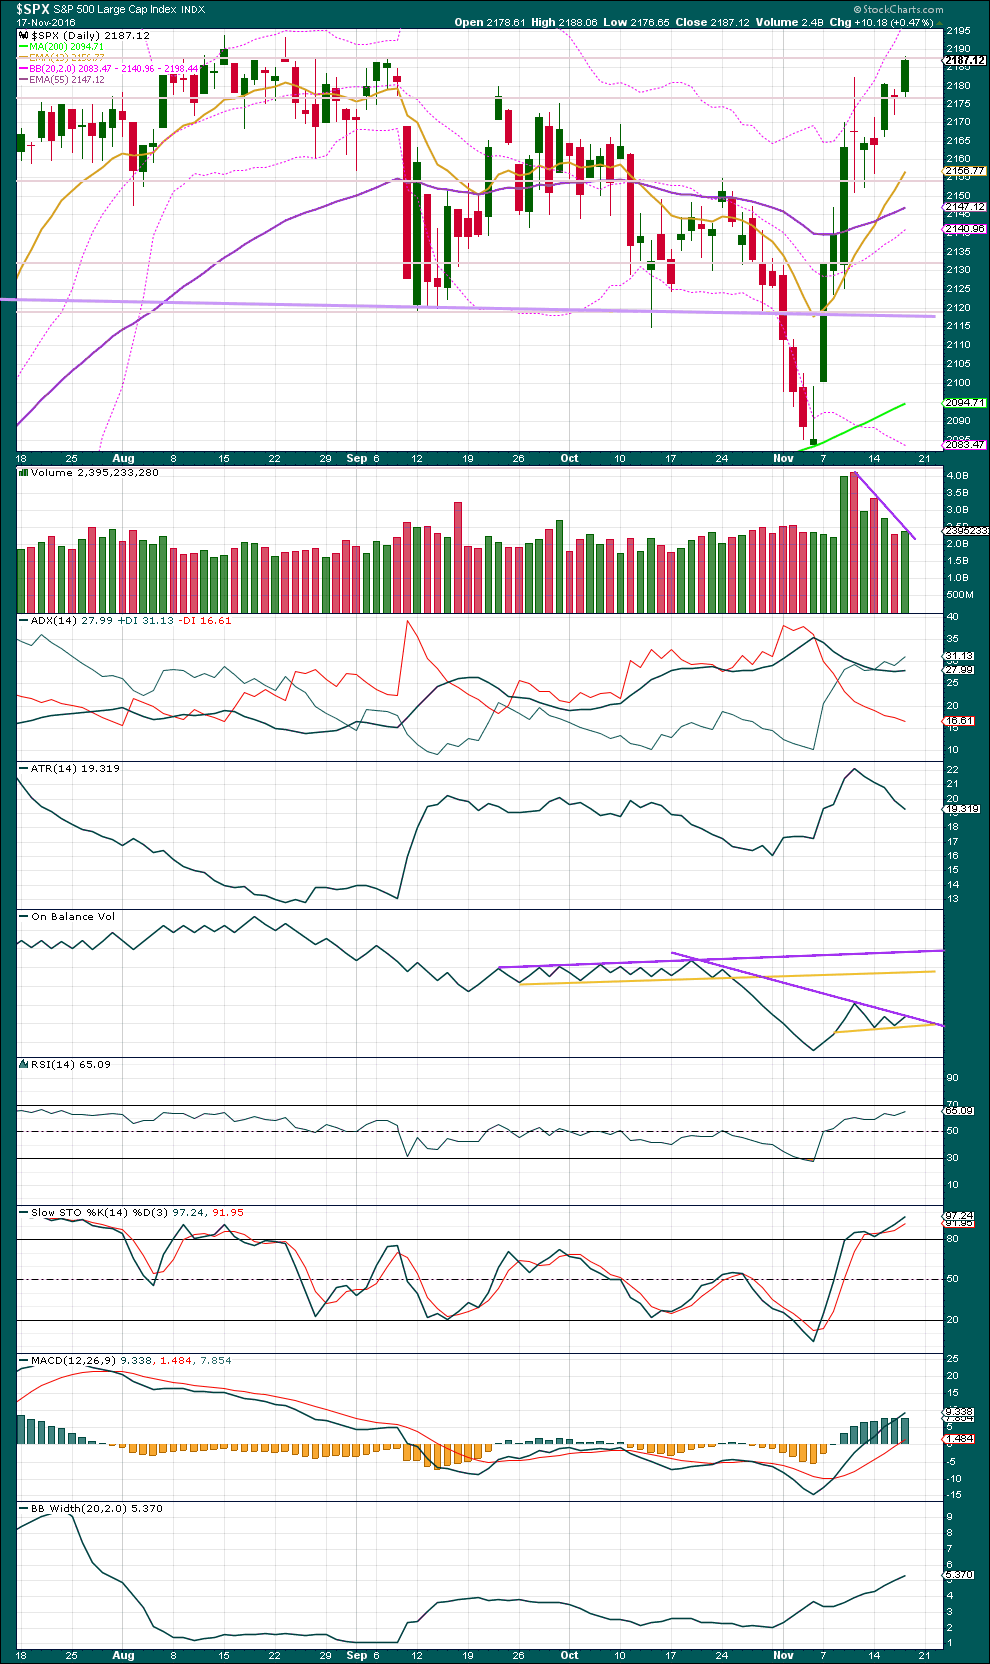
Price is moving higher and overall volume is declining. The rise in price does not have support from volume, so it is suspicious.
Today saw a new high with volume very slightly higher than the day before but still lower than the last upwards day. The bulls are tired.
ADX today has slightly increased, so it indicates there is an upwards trend in place. Below 35 this is not extreme, so this trend may continue. However, ATR strongly disagrees as it is declining.
Bollinger Bands have widened further.
With two of these three indicators in agreement, it should be assumed that the market is still trending and the trend is up. This tells us what the market is doing now, today, not what it will necessarily be doing tomorrow. With the Elliott wave count now seeing today’s upwards movement as the end of an impulse, it now agrees with ADX and Bollinger Bands.
With ATR declining at the end of this movement, it looks like the bulls are tired. They are able to push price up by a smaller and smaller amount each day. Some downwards reaction would be a reasonable expectation about here or very soon.
On Balance Volume has today come up to find resistance at the steeply sloping purple line. This line does not have good technical significance; it is too steep and not often tested. It may provide some resistance. A break above it would be a weak bullish signal. If OBV turns down, then a break below the yellow line would be a weak bearish signal, but first that line may provide support.
RSI has moved higher with price today. There is no divergence. RSI is not extreme. There is room for price to rise further.
Stochastic has also moved higher and is overbought. With no divergence between price and Stochastics, a high here is not indicated. It is still possible that price may move higher.
Divergence is not always seen at turning points with RSI and Stochastics, but when it is seen it does increase the probability of a price extreme.
MACD is still bullish.
VOLATILITY – INVERTED VIX CHART
Click chart to enlarge. Chart courtesy of StockCharts.com.
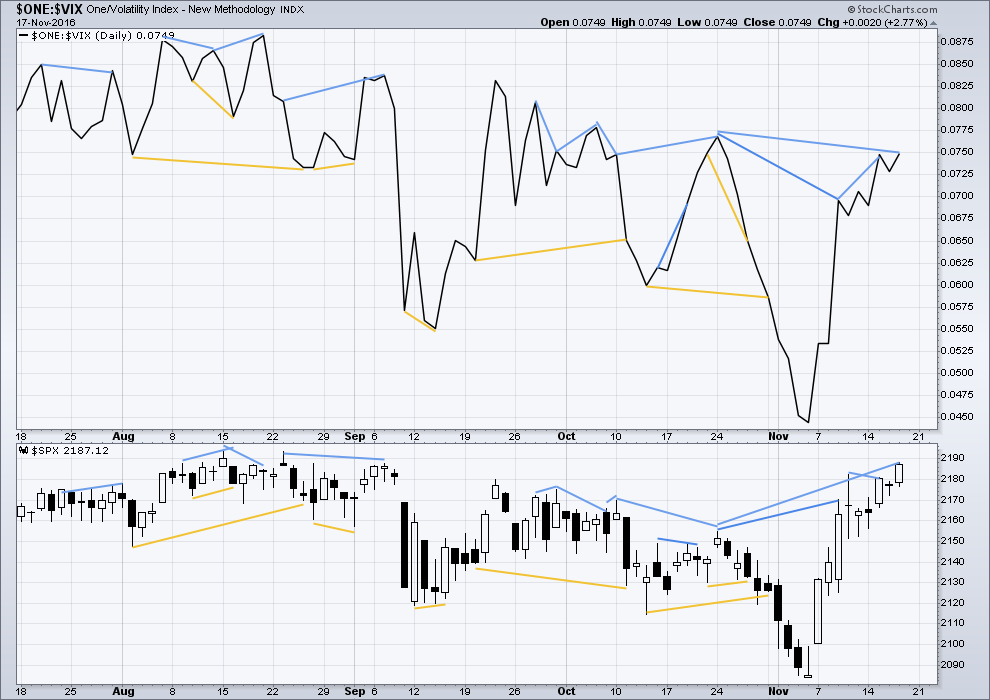
There are a few instances of multi day divergence between price and inverted VIX noted here. Bearish divergence is blue. Bullish divergence is yellow. It appears so far that divergence between inverted VIX and price is again working to indicate short term movements spanning one or two days. While this seems to be working more often than not, it is not always working. As with everything in technical analysis, there is nothing that is certain. This is an exercise in probability.
There is still some hidden bearish divergence between price and inverted VIX: inverted VIX has made a reasonable new high this week, but price has not. This indicates weakness to upwards movement from price. This divergence may be followed by one or two days of downwards movement. It will only be considered to have failed if price makes a new high above the prior high of the 10th of November.
This divergence today is considered to have failed. Price has made a new high with inverted VIX.
Mid term divergence is noted today between price and inverted VIX: price has made a new high above the prior high of the 24th of October, but inverted VIX has still not made a corresponding new high (it has a lower high). This is regular bearish divergence. This strongly supports the Elliott wave count.
BREADTH – AD LINE
Click chart to enlarge. Chart courtesy of StockCharts.com.
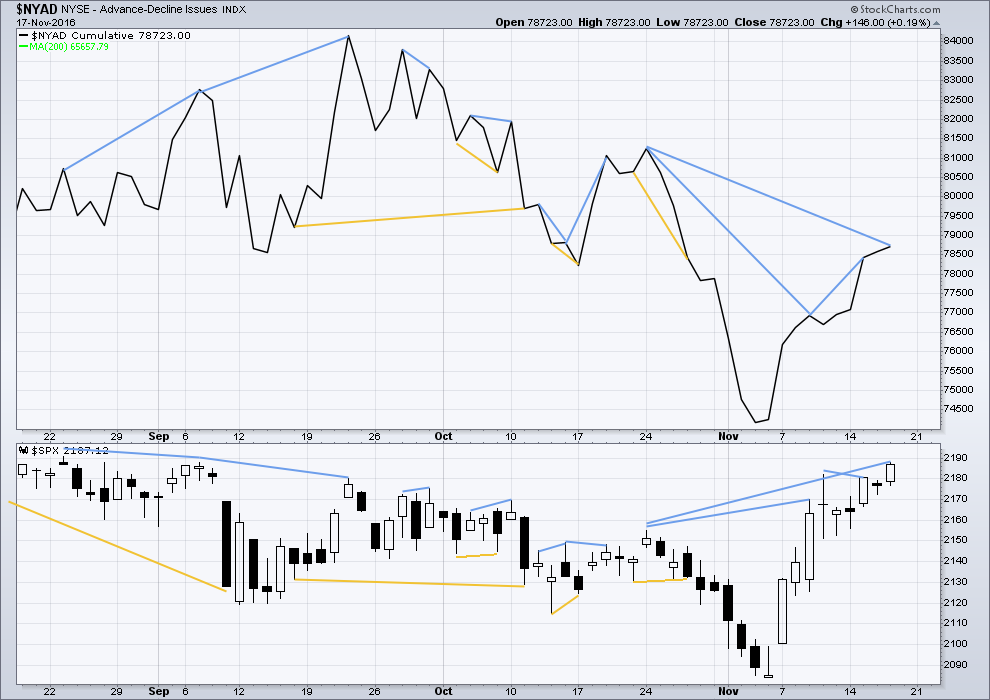
Short term bullish and bearish divergence is again working between price and the AD line to show the direction for the following one or two days.
There is still hidden bearish divergence between price and the AD line: the AD line has this week made a new high, but price has not made a new high above the prior high of the 10th of November. This indicates weakness in upwards movement from price. It may be followed by one or two days of downwards movement. This divergence will only be considered to have failed if price makes a new high tomorrow.
At this stage, this divergence is still in effect because price has not made a new high. A small red doji may be interpreted as one day of downwards movement. A second day of downwards movement may also follow now.
There is strong mid term divergence between price and the AD line: price has made a higher high above the prior high of the 24th of October, but the AD line has not managed to make a corresponding new high. This is regular bearish divergence. It indicates a lack of market breadth to this upwards movement from price these last nine days, and this strongly supports the Elliott wave count.
BREADTH – MCCLELLAN OSCILLATOR
Click chart to enlarge. Chart courtesy of StockCharts.com.
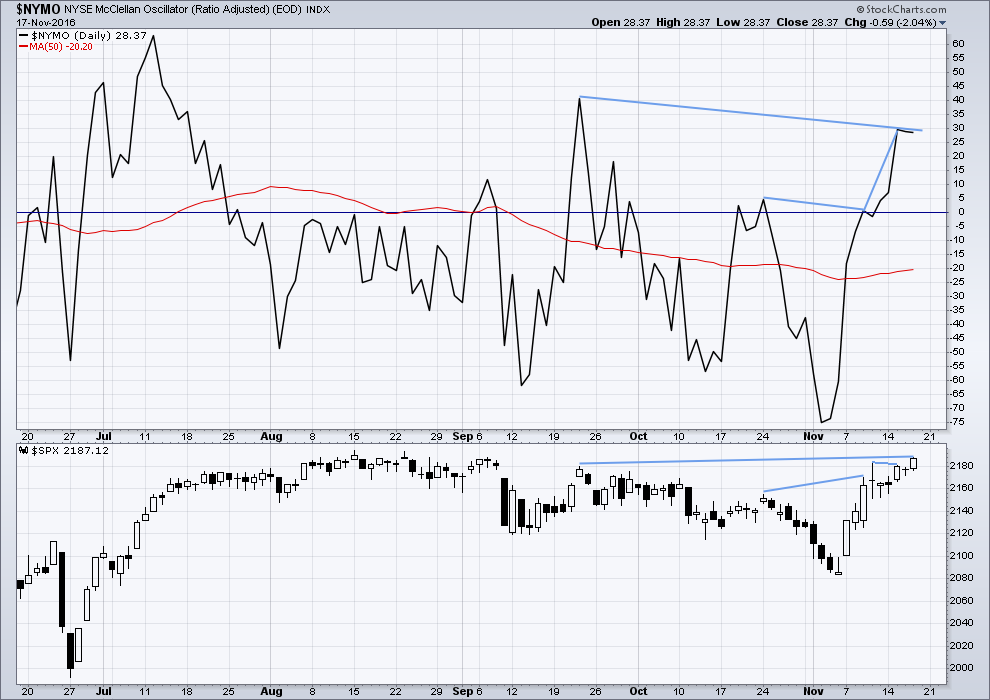
On the 21st August, 2015, the McClellan Oscillator reached -71.56. Price found a low the next session, 104 points below the closing price of the 21st August. This very extreme reading for the 24th August would have been a strong indicator of a low in place.
On the 11th December, 2015, the McClellan Oscillator reached -80.82. It moved lower the next session to -92.65 and price moved 19 points lower. The extreme reading of 11th December might possibly have led to an expectation of a bigger bounce than the one that occurred, and might have misled analysis into missing the strong fall from 29th December to 20th of January.
The next most recent occasion where this oscillator was extreme was the 8th January, 2016. It reached -66.25 on that date. The low was not found for seven sessions though, on the 20th January 2016, almost 110 points below the closing price of the 8th January. At the low of the 11th February, there was strong bullish divergence with price making new lows and the oscillator making substantially higher lows. This may have been a strong warning of a major low in place.
The most recent occasion of an extreme reading was -75.05 on the 2nd of November. The last low came two days later.
As an indicator of a low this is not it. It is a warning of extreme levels. The next thing to look for would be some divergence with price and this oscillator at lows. Divergence is not always seen at lows, but when it is seen it should be taken seriously. Any reading over 100 should also be taken very seriously.
This indicator will be approached with caution. It is one more piece of evidence to take into account.
There is still short term hidden bearish divergence between price and the McClellan Oscillator this week. While the McClellan Oscillator has made a substantial new high price has not. This indicates weakness in upwards movement from price and may be followed by one or two days of downwards movement. It will only be considered to have failed if price makes a new high tomorrow.
With a new high today, this divergence has disappeared and is considered to have failed.
There is single day divergence today with price and the McClellan Oscillator: the oscillator moved lower while price moved higher. This indicates today’s session did not have the support from market breadth. This is regular bearish divergence over a single day.
Some longer mid term divergence is also noted between the highs of the 22nd of September and today: price has made a higher high, but the McClellan Oscillator has made a lower high. This is also regular bearish divergence.
The McClellan Oscillator is not extreme. There is still plenty of room for price to rise.
DOW THEORY
Major lows within the old bull market:
DJIA: 15,855.12 (15th October, 2014) – closed below on 25th August, 2015.
DJT: 7,700.49 (12th October, 2014) – closed below on 24th August, 2015.
S&P500: 1,821.61 (15th October, 2014) – has not closed below this point yet.
Nasdaq: 4,117.84 (15th October, 2014) – has not closed below this point yet.
Major highs within the bear market from November 2014:
DJIA: 17,977.85 (4th November, 2015) – closed above on 18th April, 2016.
DJT: 8,358.20 (20th November, 2015) – closed above this point on the 9th of November, 2016.
S&P500: 2,116.48 (3rd November, 2015) – closed above this point on 8th June, 2016.
Nasdaq: 5,176.77 (2nd December, 2015) – closed above this point on 1st August, 2016.
Dow Theory Conclusion: The transportations indicate an end to the prior bear market. The transportation index confirms a bull market.
This analysis is published @ 09:40 p.m. EST.
FWIW. I took a quick look at my positions before heading out this morning and was quite surprised to see I had an additional 600 large in my trading account. To my great surprise, my short DIA 188.50 call options expiring tomorrow were assigned to my account, making me the proud owner of 2,500.00 shares. Now folk, you have to understand that this is EXTREMELY unusual. In-the-money options expiring over the week-end are almost never assigned prior to the expiration date on Saturday. It was clear to me that the holder of those calls had a sneaking suspicion that they would expire out of the money and wanted to cash in while the cashing was good. My instincts were right. Guess what DIA closed at today? Yep! 188.46. The banksters are bearish! (the current market action is designed to frustrate and dislodge short positions) 🙂
Have a great week-end everyone!
Oops! I meant to say “proud SELLER” of 2500 shares…but you knew that! 🙂
🙂
Verne, UVXY has had six red daily candlesticks in a row as of Friday.
This looks to be slightly unusual… I’m figuring that means Monday is highly likely to be green.
5 minute chart.
I can see a five up now perfectly complete.
Todays second candlestick breached the trend channel about intermediate (1). But, the S&P doesn’t always play nice with it’s trend lines. I can break them, only to continue in the old direction. So this is the smallest of warnings only.
Updated hourly chart for you, but it really doesn’t change much.
UVXY made another 52 week low today. It moved up from 11.40 to 11.74 and reversed. Currently, it is under 11.50 and looks to be headed back down. As I said in my previous post, I have not taken any positions yet (and may not). I may wait for SPX to get back down near 2135 before taking any position and then it would most likely be a bullish position.
I am still long the market, after having trimmed several positions yesterday. Now 50% long, 25% cash and 25% hedges including UVXY, VIX, SPY puts etc. Next two weeks should be interesting.
I am feeling lonely here with everyone short and even Rodney out.
Today’s hourly chart SPX shows that price has wandered outside the lower channel line. Remember that the SPX often violates the lower channel line and then retests it or moves back in the channel. So the violation, wandering out of the channel, while being a signal to a trend change is only one signal and often deceiving (wrong).
I am not sure the upwards movement to complete Minor 5 of Intermediate (1) is over. We need to look for at least five waves down then 3 up to clue us that Intermediate (2) may have started. May have. We don’t have five waves down yet.
I have no guess as to the next move. Therefore, I have no positions and do not want any before the weekend. Beyond that, next week, US Thanksgiving week, is seasonally favorable to the bulls. I will most likely sit out next week too unless some tantalizing trade develops that I cannot resist. But it is most often easier to have a pleasant and joyous holiday with no open trades, especially short term trades.
Hmm…. market holding up….might be gathering up short positions to squeeze out
EW suggests quite a few currencies & PM’s are lining up on the verge of changing direction. That doesn’t have to correlate with the S&P but again EW is suggesting a correction is due.
Nice impulse down from todays high on the 5 min chart. Div on the high, and this upwards meandering looks corrective to me atm.
Agreed. I can see a perfect five down on the five minute chart for todays move.
Poss opportunity in USD:CHF? (Daily Chart)
Leading diagonals & time consuming complex corrections not really my strong point.
Awesome! Thanks so much for sharing the chart Olga
Good morning!
A remarkable situation in the markets. Under ordinary circumstances it would look like a text-book case of consolidation ahead of a run higher, and while that could still happen, the market has remained over-bought and tracking close to its upper BB for almost a week after initially penetrating it. I don’t remember ever seeing this kind of persistent bullishness. Either we shoot higher in a spectacular blow-off top or the upcoming correction is going to be deeper than most expect. VIX continues to trade above its YBR (yellow brick road 🙂 ) and the first sign of a strong move higher will probably be a decisive break of that line. Triple buy signals in the Unicorn with three new 52 week lows in the last three days!
As Rodney correctly opined, I have indeed backed up the truck. It could still go lower but a few months from now no one will remember (or care) how low it went. A few more days to finish a little project I am working on. Great to see Olga back on the board!! 🙂 🙂
Good morning Verne 🙂
I’ll be keeping a close eye on UVXY and VIX.
It does look like the S&P is due for a larger correction. We shall see…
Me too!
I am now holding the largest volatility position I have in quite some time.
I must also say I am prepared for some short term pain.
If we are in some sort of consolidation pattern (EWI is seeing a triangle of some sort), the final move up could be brutal and will most certainly dislodge all but the most stalwart of remaining bears.