
A red daily candlestick fits the Elliott wave count nicely. The target may be met tomorrow.
Summary: A correction down to about 2,120 and the lilac trend line is expected this week. Use this as an opportunity to join the trend for a third wave up. Volume strongly supports the Elliott wave count. More aggressive traders may choose to take a short position tomorrow. As always manage risk because it is the single most important aspect of trading. Do not invest more than 3-5% of equity on any one trade and always use a stop.
Last monthly chart for the main wave count is here.
Last weekly chart is here.
New updates to this analysis are in bold.
MAIN WAVE COUNT
DAILY CHART
Click chart to enlarge.
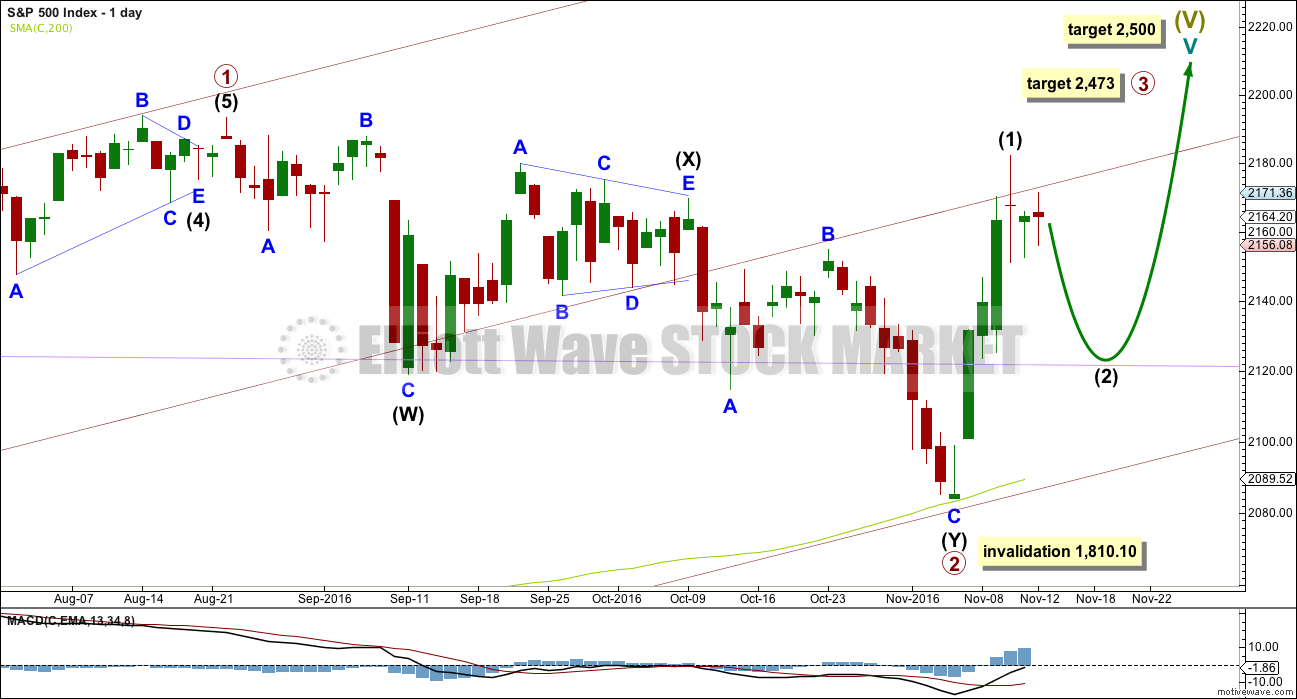
Primary wave 2 now looks to be complete as a double zigzag. Within primary wave 2: intermediate wave (W) was a very shallow zigzag lasting a Fibonacci 13 sessions; intermediate wave (X) fits perfectly as a triangle lasting 20 sessions, just one short of a Fibonacci 21; and intermediate wave (Y) also lasting 20 sessions deepens the correction achieving the purpose of a second zigzag in a double.
Primary wave 2 looks like it has ended at support about the lower edge of the maroon channel about primary wave 1, and at the 200 day moving average.
With upwards movement slicing cleanly through the lilac trend line, this behaviour looks to be more typical of an upwards trend. At this stage, corrections within primary wave 3 may be expected to turn down to test support at this trend line. While after hours movement did not find support there, the New York session did.
At 2,500 cycle wave V would reach equality in length with cycle wave I.
At 2,467 primary wave 3 would reach equality in length with primary wave 1. This is the ratio used in this instance because it fits with the higher target at 2,500.
Within primary wave 3, intermediate wave (1) may have ended at the last high. Intermediate wave (2) may turn price downwards to test support at the lilac trend line. It is typical of the S&P to show the subdivisions of its third waves clearly at higher time frames. Intermediate wave (2) so far shows as two small bodied candlesticks.
Primary wave 3 may show some strength compared to primary wave 1, but it does not have to. This wave count sees price in a final fifth wave at cycle degree, within a larger fifth wave at Super Cycle degree. The upcoming trend change may be at Grand Super Cycle degree, a once in generations trend change. This final fifth wave should be expected to exhibit great internal weakness; this market may appear broken. That would be typical behaviour for a final fifth wave of this magnitude.
HOURLY CHART
Click chart to enlarge.
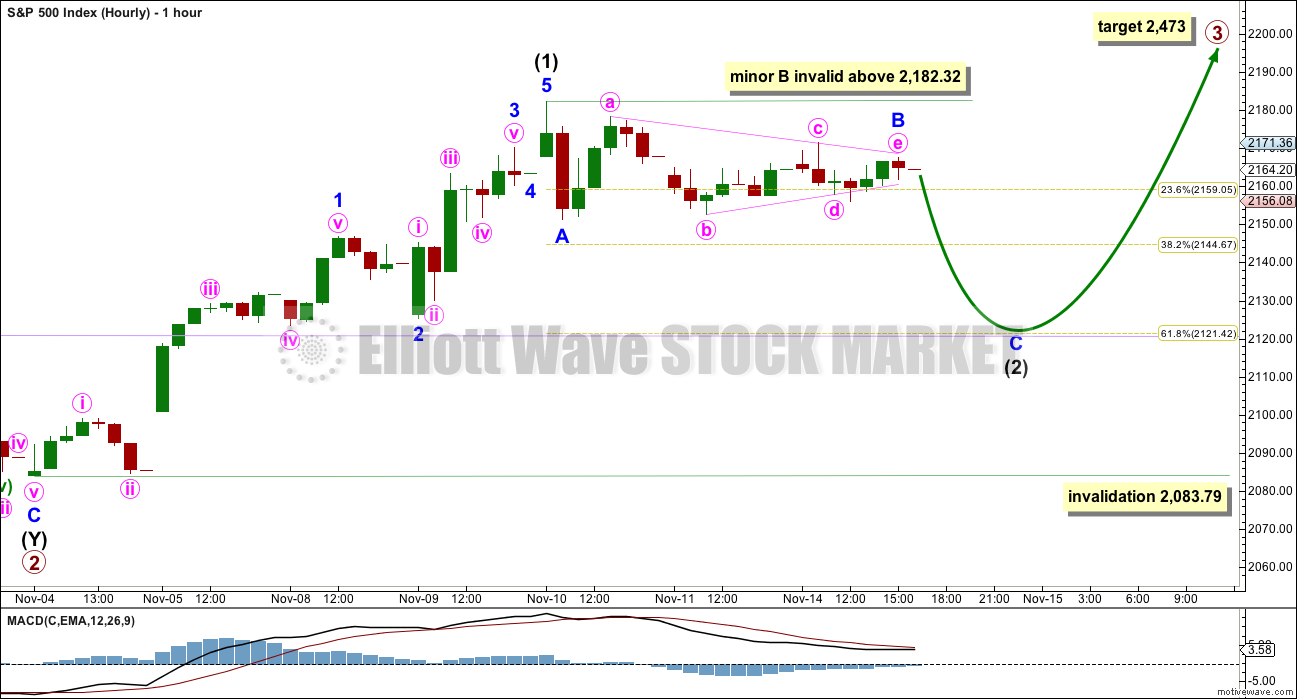
Intermediate wave (1) may have ended at the last high.
Intermediate wave (2) would most likely end about the 0.618 Fibonacci ratio of intermediate wave (1) at 2,121. This is close to the lilac trend line.
Within intermediate wave (2), minor wave B may be incomplete. It may move either higher or sideways. If minor wave A is correctly analysed as a five wave impulse (this is what it looks like on the five minute chart), then minor wave B may not move beyond its start above 2,182.32.
At this stage, it looks like minor wave B may have just unfolded as a regular contracting triangle. It may have just ended at the end of this session. Price tomorrow may gap down, so minor wave C may be swift and sharp. Movements out of triangles very often are.
Intermediate wave (2) may not move beyond the start of intermediate wave (1) below 2,083.79.
Intermediate wave (1) lasted four days. Intermediate wave (2) has so far lasted two days and may continue to total a Fibonacci three, five or eight days. All of these options would still give the wave count a good look in terms of proportion.
Minor wave C would reach 1.618 the length of minor wave A at 2,117, just below the 0.618 Fibonacci ratio. This target may be too low because this would see the lilac trend line overshot.
If price does overshoot the lilac trend line, then look for downwards movement to end close to 2,117.
TECHNICAL ANALYSIS
WEEKLY CHART
Click chart to enlarge. Chart courtesy of StockCharts.com.
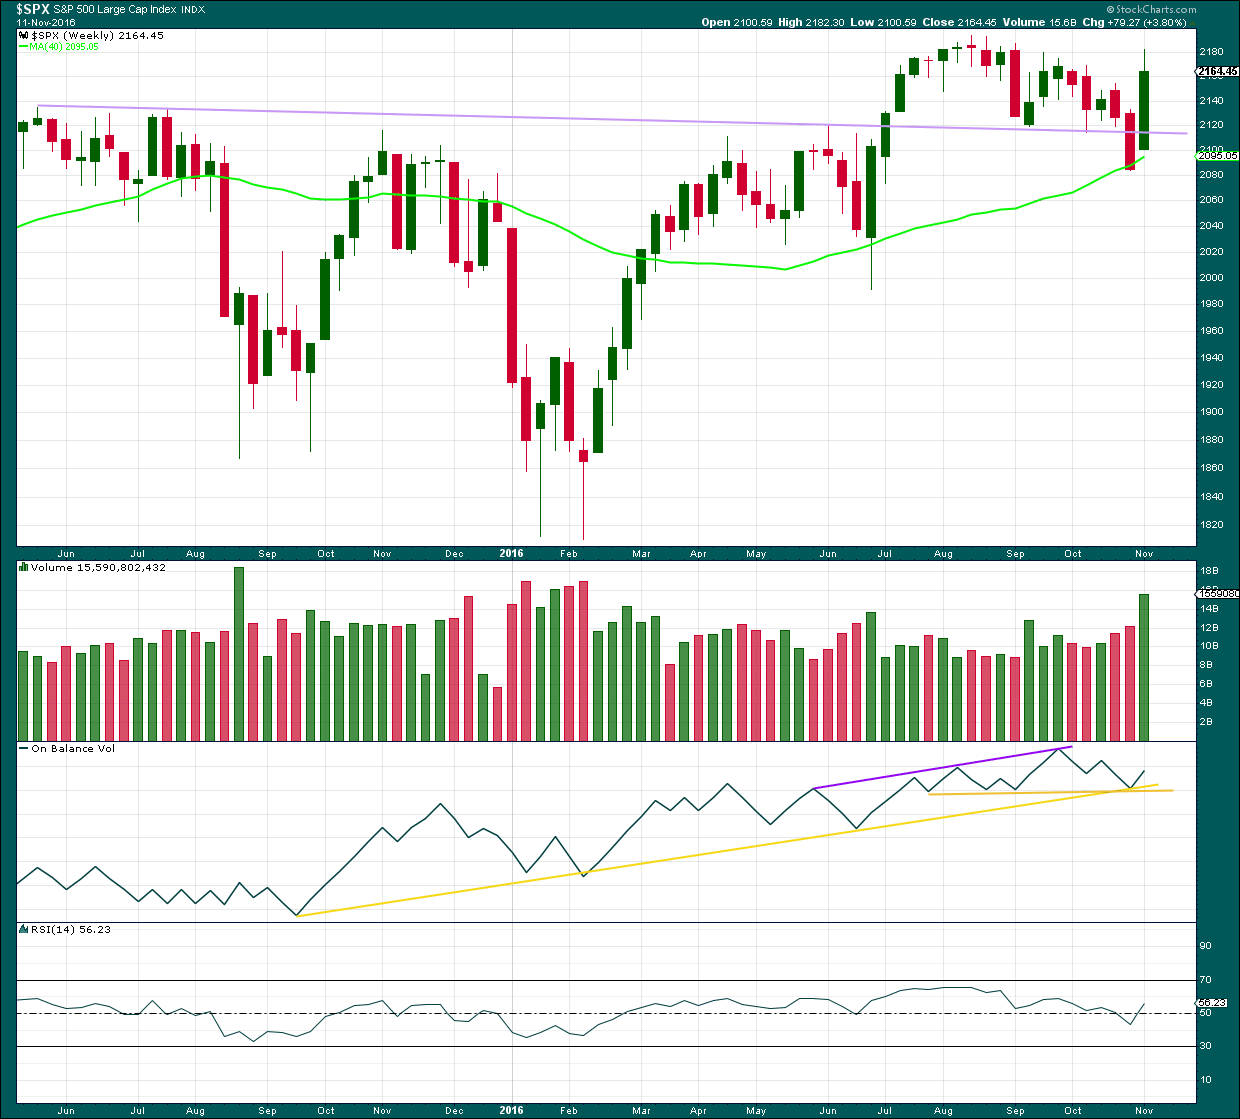
A break back up above the lilac trend line is very bullish. This line is now weakened because of the break, but it should still be expected to provide some support if price turns down a little.
Price has found support at the 40 week / 200 day moving average.
Upwards movement last week has strong support from volume. This supports the Elliott wave count.
On Balance Volume found support at the two yellow trend lines. This also supports the Elliott wave count.
RSI is not extreme, so there is room for price to rise further.
DAILY CHART
Click chart to enlarge. Chart courtesy of StockCharts.com.
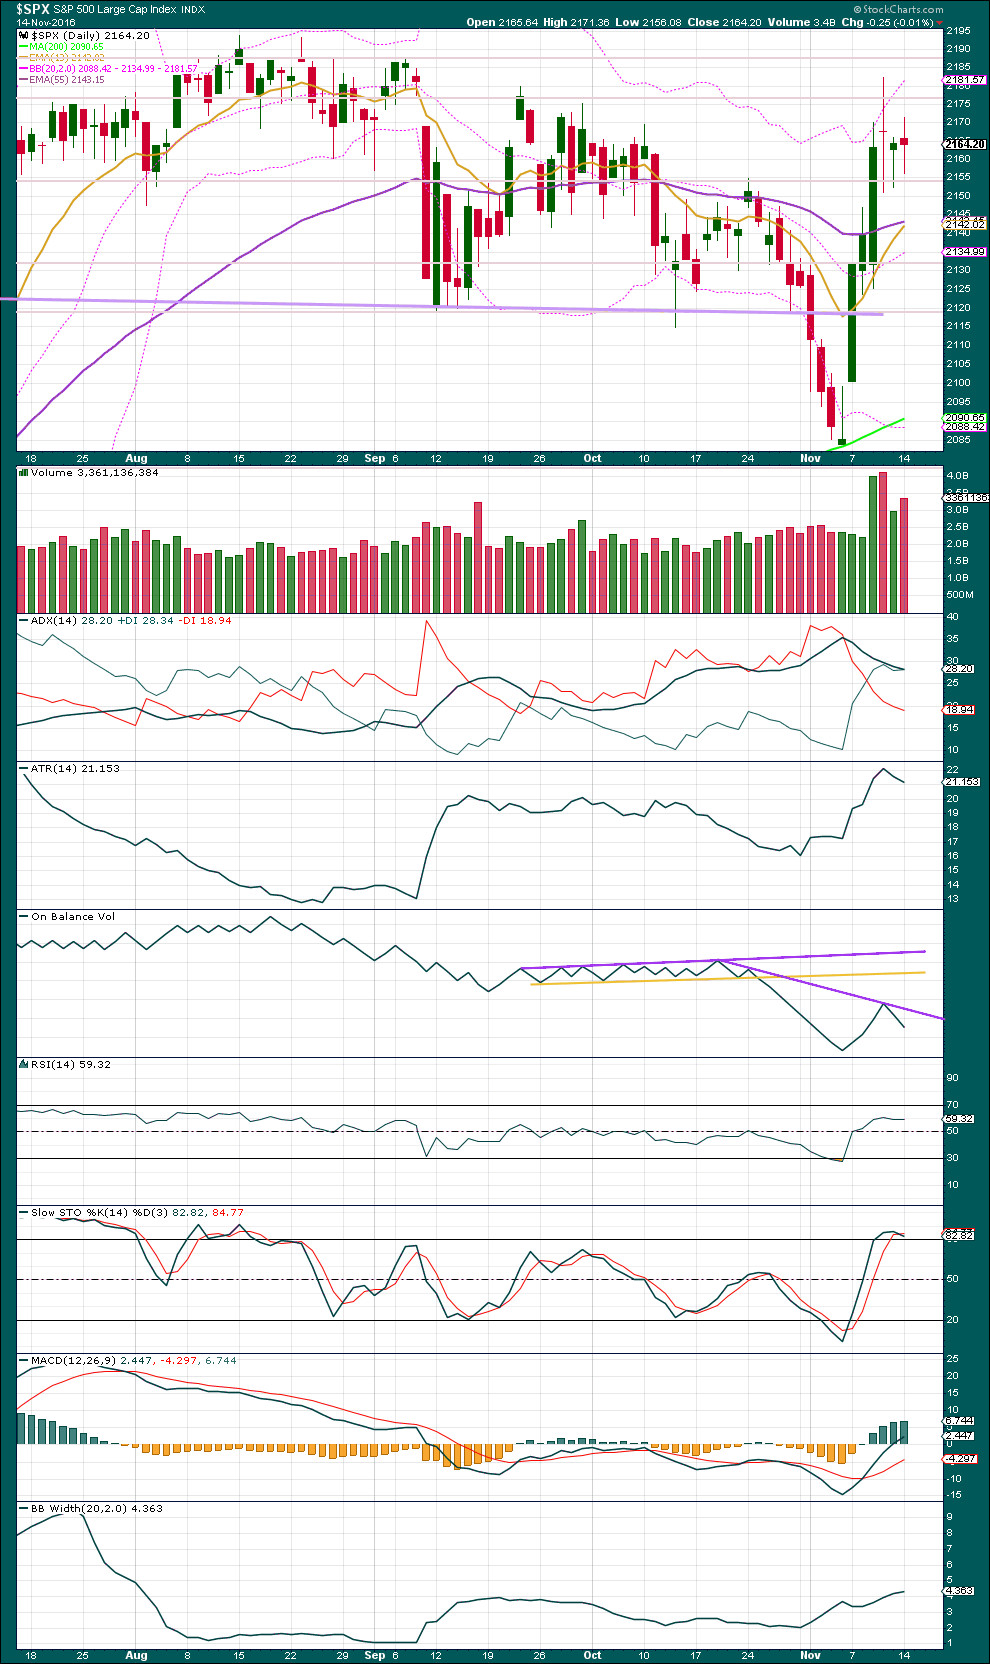
This session made a higher high and a higher low, the definition of upwards movement. But the session closed red and On Balance Volume indicates more support from volume for downwards movement than upwards during the session, making interpreting this situation difficult.
Overall, the session moved price lower and volume supports this. It is my judgement that downwards movement currently has some support, so it may be reasonably expected to continue for at least one more session. Expect price to find support at the lilac trend line and the horizontal support line about 2,120.
ADX is declining, indicating the market is not currently trending. ATR agrees as it too is declining. Bollinger Bands disagree today as they continue to widen. Overall, it is expected the market is not currently trending.
RSI has not reached extreme. There is room for price to rise or fall.
Stochastics has reached overbought. A reaction here looks like it may bring Stochastics back into neutral territory.
After price has reached the upper edge of Bollinger Bands, it looks like it is now reacting downwards. Look for downwards movement to end when price gets close to the mid line of Bollinger Bands, if a larger upwards trend is indeed intact as the Elliott wave count expects.
VOLATILITY – INVERTED VIX CHART
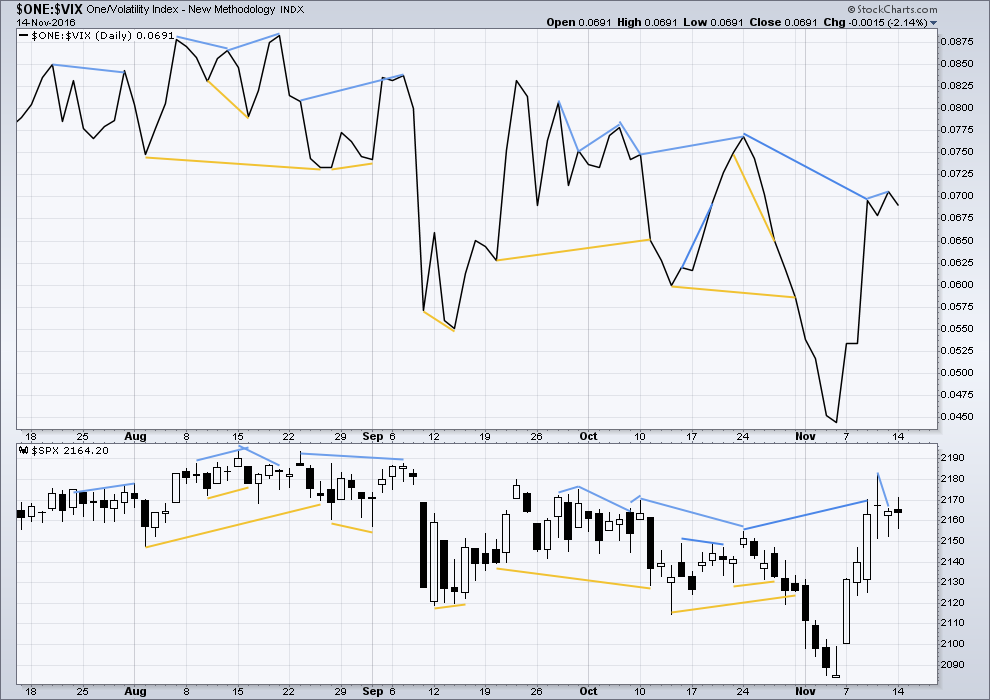
Click chart to enlarge. Chart courtesy of StockCharts.com.
There are a few instances of multi day divergence between price and inverted VIX noted here. Bearish divergence is blue. Bullish divergence is yellow. It appears so far that divergence between inverted VIX and price is again working to indicate short term movements spanning one or two days.
Friday’s session exhibits small divergence with the high one and two days ago: price made a lower high, but inverted VIX has made a higher high. This divergence is bearish and indicates weakness in price. It may be followed by one or two days of downwards movement. So far it is followed by a red daily candlestick, but this made a higher high and a higher low. Tomorrow may resolve this divergence with a red candlestick to a new low.
BREADTH – AD LINE
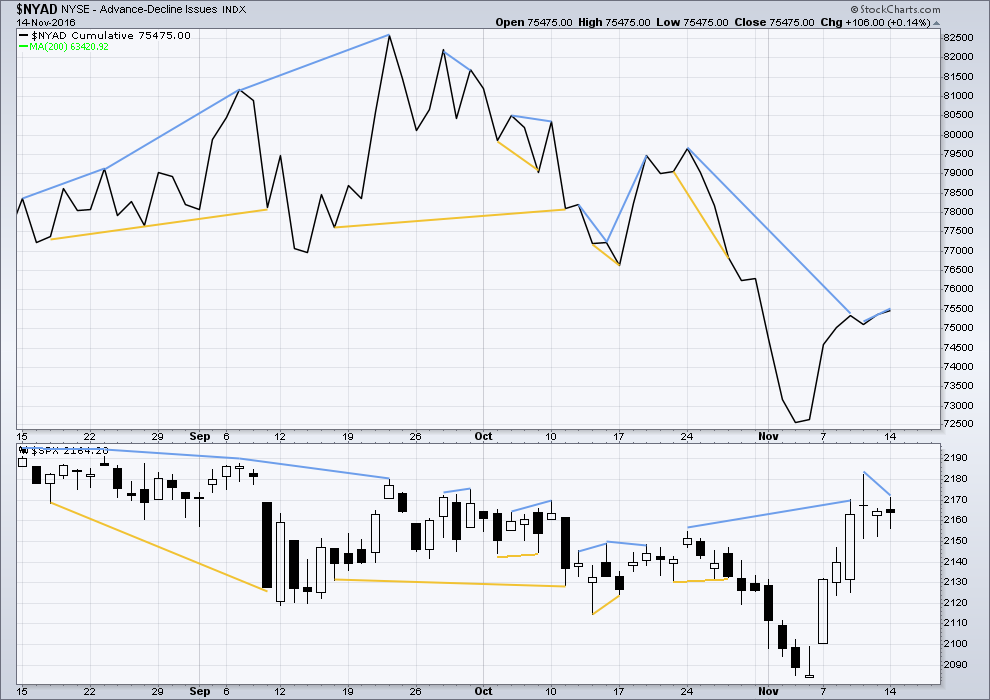
Click chart to enlarge. Chart courtesy of StockCharts.com.
Short term bullish and bearish divergence is again working between price and the AD line to show the direction for the following one or two days.
The AD line today exhibits short term divergence with price: the AD line is now higher than it was on the 10th of November, but price has made a lower high. This short term bearish divergence may be followed by one or two days of downwards movement.
BREADTH – MCCLELLAN OSCILLATOR
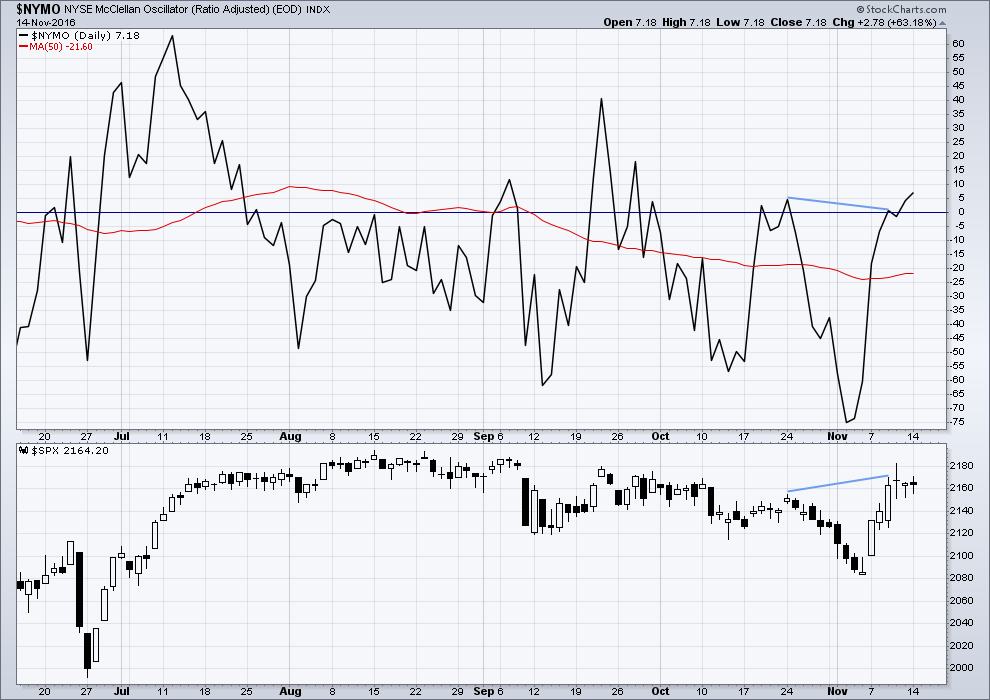
Click chart to enlarge. Chart courtesy of StockCharts.com.
The McClellan Oscillator is now extreme (below 60). On its own this is not an indicator of a low, but it is a warning that this market is oversold. The McClellan Oscillator today is at -73.44.
On the 21st August, 2015, the McClellan Oscillator reached a similar point of -71.56. Price found a low the next session, 104 points below the closing price of the 21st August. This very extreme reading for the 24th August would have been a strong indicator of a low in place.
On the 11th December, 2015, the McClellan Oscillator reached -80.82. It moved lower the next session to -92.65 and price moved 19 points lower. The extreme reading of 11th December might possibly have led to an expectation of a bigger bounce than the one that occurred, and might have misled analysis into missing the strong fall from 29th December to 20th of January.
The next most recent occasion where this oscillator was extreme was the 8th January, 2016. It reached -66.25 on that date. The low was not found for seven sessions though, on the 20th January 2016, almost 110 points below the closing price of the 8th January. At the low of the 11th February, there was strong bullish divergence with price making new lows and the oscillator making substantially higher lows. This may have been a strong warning of a major low in place.
The most recent occasion of an extreme reading was -75.05 on the 2nd of November. The last low came two days later.
As an indicator of a low this is not it. It is a warning of extreme levels. The next thing to look for would be some divergence with price and this oscillator at lows. Divergence is not always seen at lows, but when it is seen it should be taken seriously. Any reading over 100 should also be taken very seriously.
This indicator will be approached with caution. It is one more piece of evidence to take into account.
There is short term bearish divergence between price and the McClellan Oscillator: the oscillator today has made a new high above the 10th of November, but price has not. This may be followed by one or two days of downwards movement.
The McClellan Oscillator is not extreme. There is plenty of room for price to rise.
DOW THEORY
Major lows within the old bull market:
DJIA: 15,855.12 (15th October, 2014) – closed below on 25th August, 2015.
DJT: 7,700.49 (12th October, 2014) – closed below on 24th August, 2015.
S&P500: 1,821.61 (15th October, 2014) – has not closed below this point yet.
Nasdaq: 4,117.84 (15th October, 2014) – has not closed below this point yet.
Major highs within the bear market from November 2014:
DJIA: 17,977.85 (4th November, 2015) – closed above on 18th April, 2016.
DJT: 8,358.20 (20th November, 2015) – closed above this point on the 9th of November, 2016.
S&P500: 2,116.48 (3rd November, 2015) – closed above this point on 8th June, 2016.
Nasdaq: 5,176.77 (2nd December, 2015) – closed above this point on 1st August, 2016.
Dow Theory Conclusion: The transportations indicate an end to the prior bear market. The transportation index confirms a bull market.
This analysis is published @ 07:30 p.m. EST.
Minor B may be a complete zigzag.
The invalidation point at 2,182.32 assumes minor A is a five wave impulse. This cannot be certain. It could be a three wave zigzag.
The target for minor C down is still 2,121.
Triangle invalidated, Possibilities? flat, Expanded flat, combination, or Wave 5 of 1??? Lara Help am I off????
Nobody knows! Nothing is what it seems!
There is artificial intelligence trading the markets (never in history at this high % of volume) that operates with zero emotion. This artificial intelligence is in full control. This can be the only explanation for why absolutely nothing works anymore!
If the bulk of trading volume is trading without emotion… how can waves continue to work and how can technical analysis continue to work?
We already know fundamentals go long periods of time without having any impact on the markets. So that doesn’t work.
So what will work in this new dynamic???
lots of things are “invalidated” only to validate themselves later
This is exactly why I left the invalidation point for minor B at the last high of 2,182.32.
While it looked like a triangle was unfolding, until it’s over you can’t be sure a triangle is what is happening.
Three are more than 23 possible structures that B waves may take. Flexibility is important while they unfold.
It looks like it may have been a zigzag, with minute c an ending contracting diagonal.
If price turns here below 2,182.32 then intermediate (2) should be expected to be continuing.
If we see a new high slightly above 2,182.32 then it is possible that my analysis of minor A as a five is wrong. As I’ve stated before, it’s impossible to tell with certainty if A is a five wave impulse or a three wave zigzag. Only to say that on the five minute chart it looks very much like an impulse so that’s what I’m going with. I could be wrong.
Intermediate (2) could still be an expanded flat, minor B could move slightly above 2,182.32 and then minor C down would still unfold sharply lower.
I’m also basing this all on overbrought conditions, upper Bollinger Band penetration a few days ago, lighter volume these last two days and smaller range candlesticks.
hello Lara.
I want to ask you, what you think of the possibility of this count ( from stockcharts.com), Thank you
Cycle V to end Super Cycle 1 (the wave up from October 2002 to October 2007) must be seen as a five. That movement fits perfectly as a three. This must reduce the probability of this wave count.
But as we know, it is usually impossible to determine with certainty if a wave is a zigzag or an impulse. So this wave count is technically valid.
Super Cycle wave 2 would have been over in just 17 months. That would be a remarkably brief wave. This should have lasted generations. Not a year and a half. This must substantially reduce the probability of this wave count. It is incredibly optimistic at best!
Super Cycle wave 2 would have been a 58% correction. That is deep enough for a second wave for sure. This means the idea is certainly possible.
The start of Super Cycle wave 3 is showing far too much weakness. Now, this could be because price is only in the very early stages. But with price now 600 points above the end of Super Cycle wave 1 this wave count really should be seeing signs of strength. Particularly the beginning of a third wave within a third wave… as this wave count as the recent rise up from February 2016. That rise should have support from volume (it doesn’t), and the last ATH should not be showing such strong weakness with RSI divergence.
I would not publish this wave count, in light of classic TA it is not a good fit.
Interesting. I wonder how many analysts and traders are looking at this kind of bullish expectation right now? Because if we are indeed close to a final high (maybe March next year?) then I would expect the majority to be overly bullish.
that count is a pipedream
Well yes. I was trying to be more… diplomatic 🙂
thank you for your response….. the reason I asked you about this count, is because I have seen it in several places…..
Thanks Maria. I’ll take it as a contrarian indicator 🙂
Some thoughts: One point of leverage that other countries have over Donald Trump is the Bond Market. I think they will want to give him a jab to the nose to let him know what they are capable of doing should they so choose. By selling Treasuries countries like China, Japan and Europe (team effort) can bring the bond market/Stock Market/USA to its knees in short order. While I’m not expecting all out selling I’m thinking a little bout now to front run this and a bigger bout when he becomes president may be in the works. This would let Donald know who is in charge. A smashdown of 10 to 20 percent on the market would set his priorities around a bit. I have no knowledge that this is the case, just a possibility.
On the flip side Obama has touted the reforms, employment situation and stock market buoyancy as part of the benefits of his presidency. Therefore he may want to keep this going a bit, (say 1.5 months 😉 ) He can do this by buying SPX futures with the Working Group via executive order per Reagan (if my memory doesn’t escape me.) I’m sure Obama will not have any problem running up the debt a little more in buying stock market/Treasuries until he escapes and runs for cover. (whats a trillion or so between enemies.) We will then be in a situation much like Obama was in 2008.
NO, no leverage at all… The result will be the savers in the USA can finally earn a decent rate of interest and the (*edit: I’m not allowing that word to be used here, I’m replacing it -Lara) stealing of wealth from the Seniors and the Middle Class in the USA will finally be over!
Go ahead world… Dump it all!!!!! Make Our Day!!!!
As to the market… Trump has said many times that the stock market is a bubble ready to pop. So no leverage in either situation because it is expected!
He may expect it, but if it happens on his watch I think most of the people in the USA would blame him for it. And that’s not going to be good for Trump.
Agree Lara. Plus I doubt he wants to go down in history as the one who created a depression or massive crash. After all, the middle class and other who will be retiring soon will lose lot more than any interest they make on fixed income. Having said that, I have no idea what he will do as he has not completely outlined it yet.
One thing I know is that most traders who were Trump supporters were short the market. Most of them have been covering shorts last week as things did not work out the way they wanted (short term for sure). Markets are still in a bull phase but need a new high soon to get more validation of that.
The Bubble is well past it most expansive point! Trump didn’t cause the bubble… it’s there already! Therefore, he won’t be blamed.
The system must be allowed to cleanse before there can be a lasting renewal (generational) that all will truly benefit from! Otherwise only the few at the top will benefit.
It is the nature of bubbles that when they are fully inflated the majority are invested in them. That’s partly what inflates them. That, and debt.
Mass psychological hysteria. The madness of crowds. They refuse to admit there is a bubble…. most especially right before it bursts.
It’s only obvious to everyone in hindsight. And that’s a very long way off.
Agree again Lara.
We have a property market bubble in New Zealand. I see one also in Australia. I hear there may be one in Canada and possibly also in China.
As far as the property market bubble in NZ goes, very few NZers see it. Those that do make comments about a bubble increasingly have quite virulent reactions. The majority view seems to be it is impossible for prices to crash. They may stabilise, but no crash can happen. Because supply is low and demand is high.
Which of course ignores the fact that supply and demand can change. And in fact should be expected to change.
It really is quite fascinating to be living through this.
I could write a long essay on the negative effects of NZ society of this bubble… but I won’t bore you.
The problem with bubbles is it is ridiculously difficult to pick when they will pop. You can only be sure it is a bubble and it will pop… eventually. You can know after it’s popped that is what has happened, but they can inflate beyond expectations to very extreme levels before the end.
This one in the NZ property market is so mature it stinks 🙂
Triangle play invalidated?
Looks to my like wave c of the triangle is continuing as a complex wave. Invalidation 2178.
Lara posted we were in wave e.
My labelling of minute c was premature. I think kkuykendoll is right. The triangle is continuing. Invalidation for minute c is the high of minute a at 2,178.26.
Lara,
SPX breached 2179 too.
Rajesh
Incredible number of new highs and lows on NYSE, according to yahoo finance, about 250 New high, 250 New low. Hindenburg omen requires 2.2 percent or roughly 70 to be nh, nl so this meets this criteria, about 8 percent for both. There are other criteria necessary, such as neg McLennan oscillator.
HOW IT WORKS (EXAMPLE):
The Hindenburg Omen is triggered when three complex conditions are met:
1) The number of new daily 52-week highs and lows on the NYSE is more than 2.2% of all securities traded that day. However, new 52-week highs cannot be more than twice the number of new 52-week lows. This condition is mandatory.
2) The 10-week moving average of the NYSE Index is rising.
3) The McClellan Oscillator, an overbought/oversold indicator, is negative.
WHY IT MATTERS:
The Hindenburg Omen is tracked by analysts to anticipate a steep decline in the stock market several weeks in advance. However, since 1987 it has accurately anticipated market turmoil only 25% of the time.
Just unusually high number of new highs and lows indicate major indecision.
Where is everyone!!
Good point… wonder if that is a contrarian sign
I was fast asleep. Rodney may be in the forest. Verne may be taking a break. Olga is still on sabbatical….
As long as everyone is okay I’m happy 🙂
When the market meanders sideways it does get more quiet in here.
Good morning Lara. you did not miss much