
A new high above 2,154.79 adds confidence to the main Elliott wave count.
A new alternate is presented today, but it has a very low probability.
Dow Theory today provides important confirmation.
Summary: Classic analysis favours a bullish Elliott wave count. The new bearish alternate has a very low probability and is presented as a “what if” only. Tomorrow may see a small red daily candlestick as a small second wave correction unfolds. If this happens as expected and price remains above 2,139.52 during tomorrow’s New York session, then members may like to use it as an opportunity to join the trend. Always use stops and never invest more than 3-5% of equity on any one trade.
Last monthly chart for the main wave count is here.
Last weekly chart is here.
New updates to this analysis are in bold.
MAIN WAVE COUNT
DAILY CHART
Click chart to enlarge.
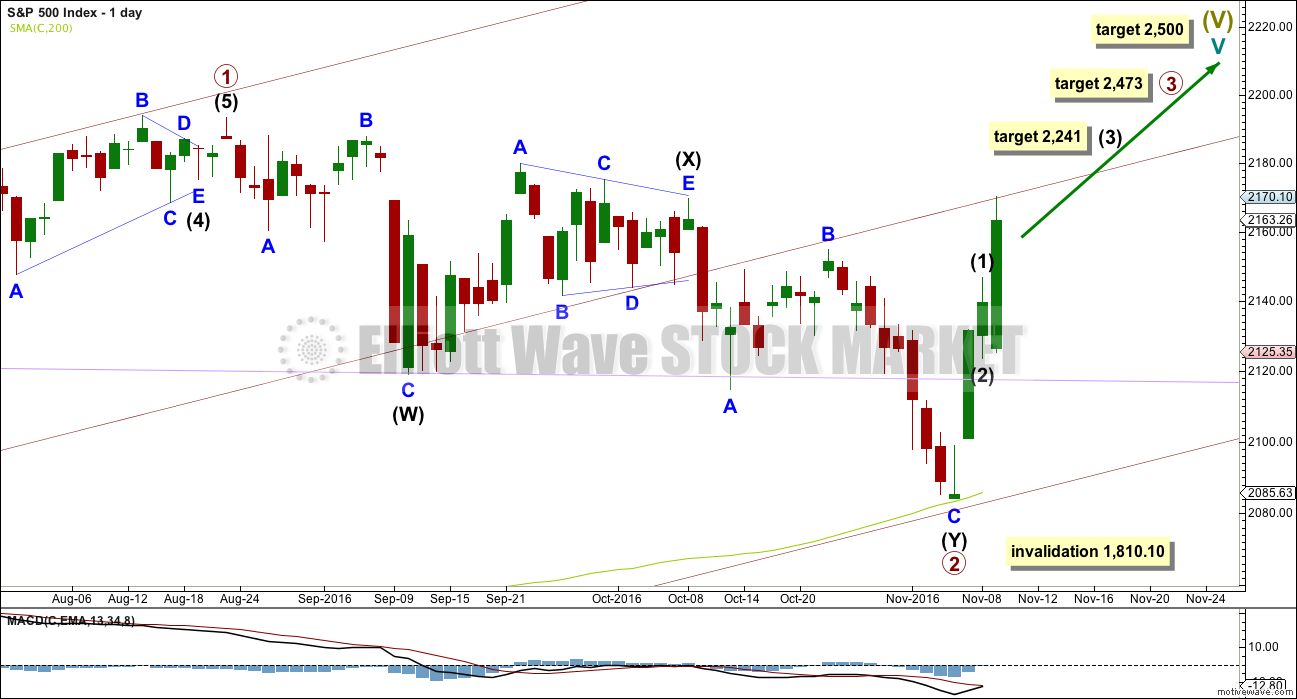
Primary wave 2 now looks to be complete as a double zigzag. Within primary wave 2: intermediate wave (W) was a very shallow zigzag lasting a Fibonacci 13 sessions; intermediate wave (X) fits perfectly as a triangle lasting 20 sessions, just one short of a Fibonacci 21; and intermediate wave (Y) also lasting 20 sessions deepens the correction achieving the purpose of a second zigzag in a double.
Primary wave 2 looks like it has ended at support about the lower edge of the maroon channel about primary wave 1, and at the 200 day moving average.
With upwards movement slicing cleanly through the lilac trend line, this behaviour looks to be more typical of an upwards trend. At this stage, corrections within primary wave 3 may be expected to turn down to test support at this trend line. While after hours movement did not find support there, the New York session did.
At 2,500 cycle wave V would reach equality in length with cycle wave I.
At 2,467 primary wave 3 would reach equality in length with primary wave 1. This is the ratio used in this instance because it fits with the higher target at 2,500.
Within primary wave 3, now intermediate waves (1) and (2) may be complete. At 2,241 intermediate wave (3) would reach 1.618 the length of intermediate wave (1).
Primary wave 3 may show some strength compared to primary wave 1, but it does not have to. This wave count sees price in a final fifth wave at cycle degree, within a larger fifth wave at Super Cycle degree. The upcoming trend change may be at Grand Super Cycle degree, a once in generations trend change. This final fifth should be expected to exhibit great internal weakness; this market may appear broken. That would be typical behaviour for a final fifth wave of this magnitude.
HOURLY CHART
Click chart to enlarge.
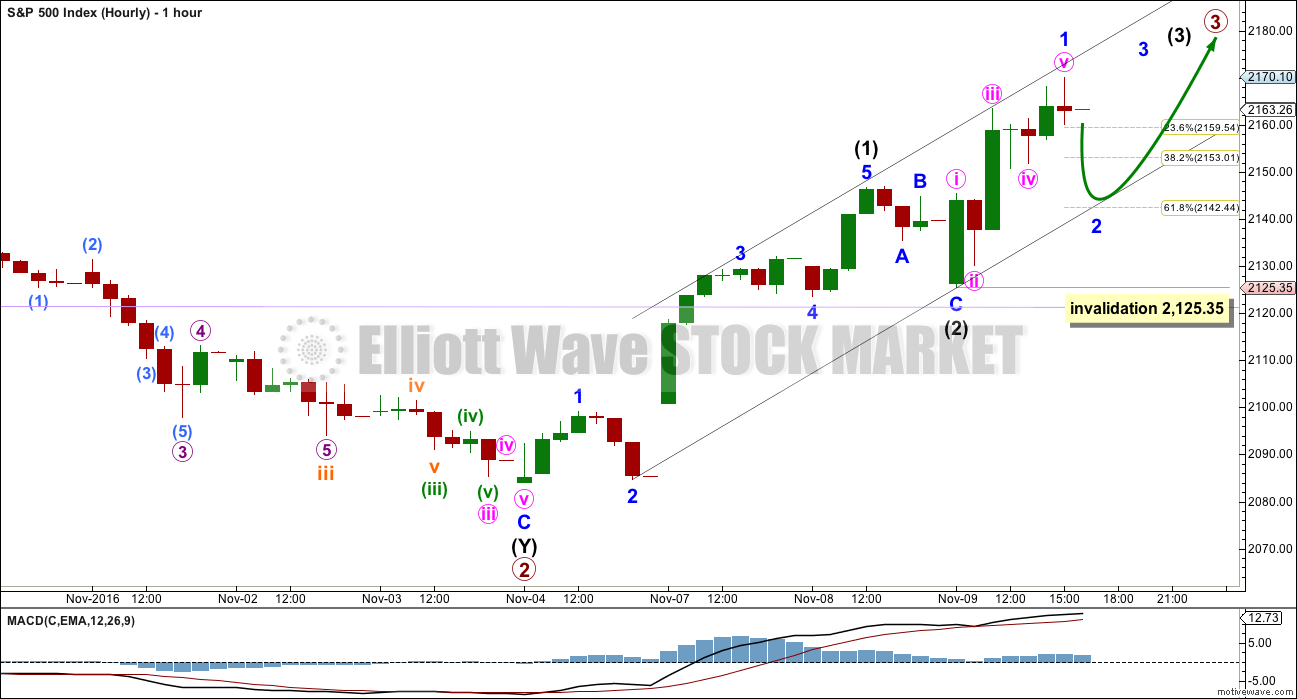
Intermediate waves (1) and (2) look complete. Intermediate wave (3) looks like it has begun and is likely to extend.
Tomorrow may print a small red daily candlestick as minor wave 2 unfolds. It is typical of the S&P to show the subdivisions of its third waves at higher time frames. Minor wave 2 may end close to the 0.618 Fibonacci ratio at 2,142. Minor wave 2 may not move beyond the start of minor wave 1 below 2,125.35.
When minor wave 2 is complete, then a third wave up at three degrees would be expected. That should have support from volume and show an increase in momentum.
ALTERNATE WAVE COUNT
DAILY CHART
Click chart to enlarge.
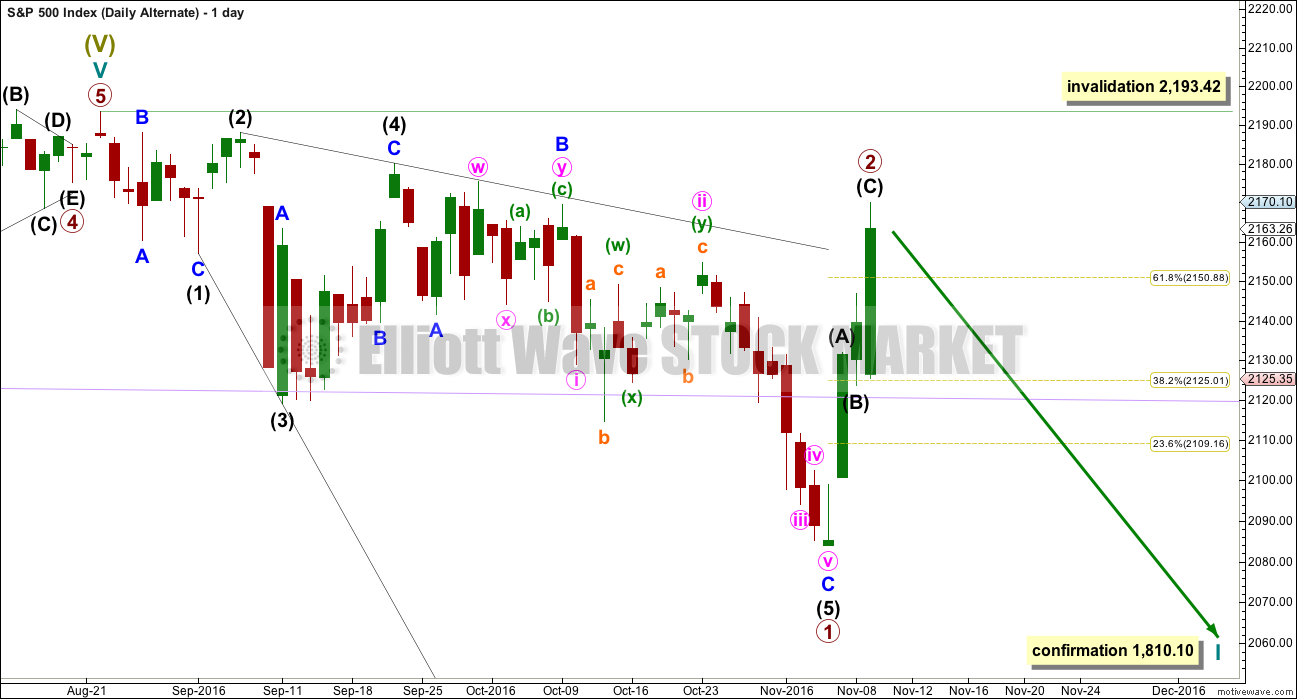
The alternate in last analysis has been invalidated.
This is at this stage the only idea I can see which meets all Elliott wave rules for a bearish scenario.
If there has been a Grand Super Cycle degree trend change at the last all time high, then the first wave down must subdivide as a five wave structure. This may be a leading expanding diagonal for a primary degree first wave.
While diagonals are not rare structures, they are more commonly ending than leading. When first waves do subdivide as diagonals, they are most often contracting and not expanding. This is not a rare structure, but it is not very common either. This reduces the probability of this alternate wave count. It is presented as a “what if?” to consider all options.
A new low below 2,083.79 would add some confidence to this wave count.
Second wave corrections following first wave leading diagonals are most often very deep. Primary wave 2 subdivides as a quick deep zigzag, at 0.79 the length of primary wave 1.
If it continues higher, primary wave 2 may not move beyond the start of primary wave 1 above 2,193.42.
TECHNICAL ANALYSIS
WEEKLY CHART
Click chart to enlarge. Chart courtesy of StockCharts.com.
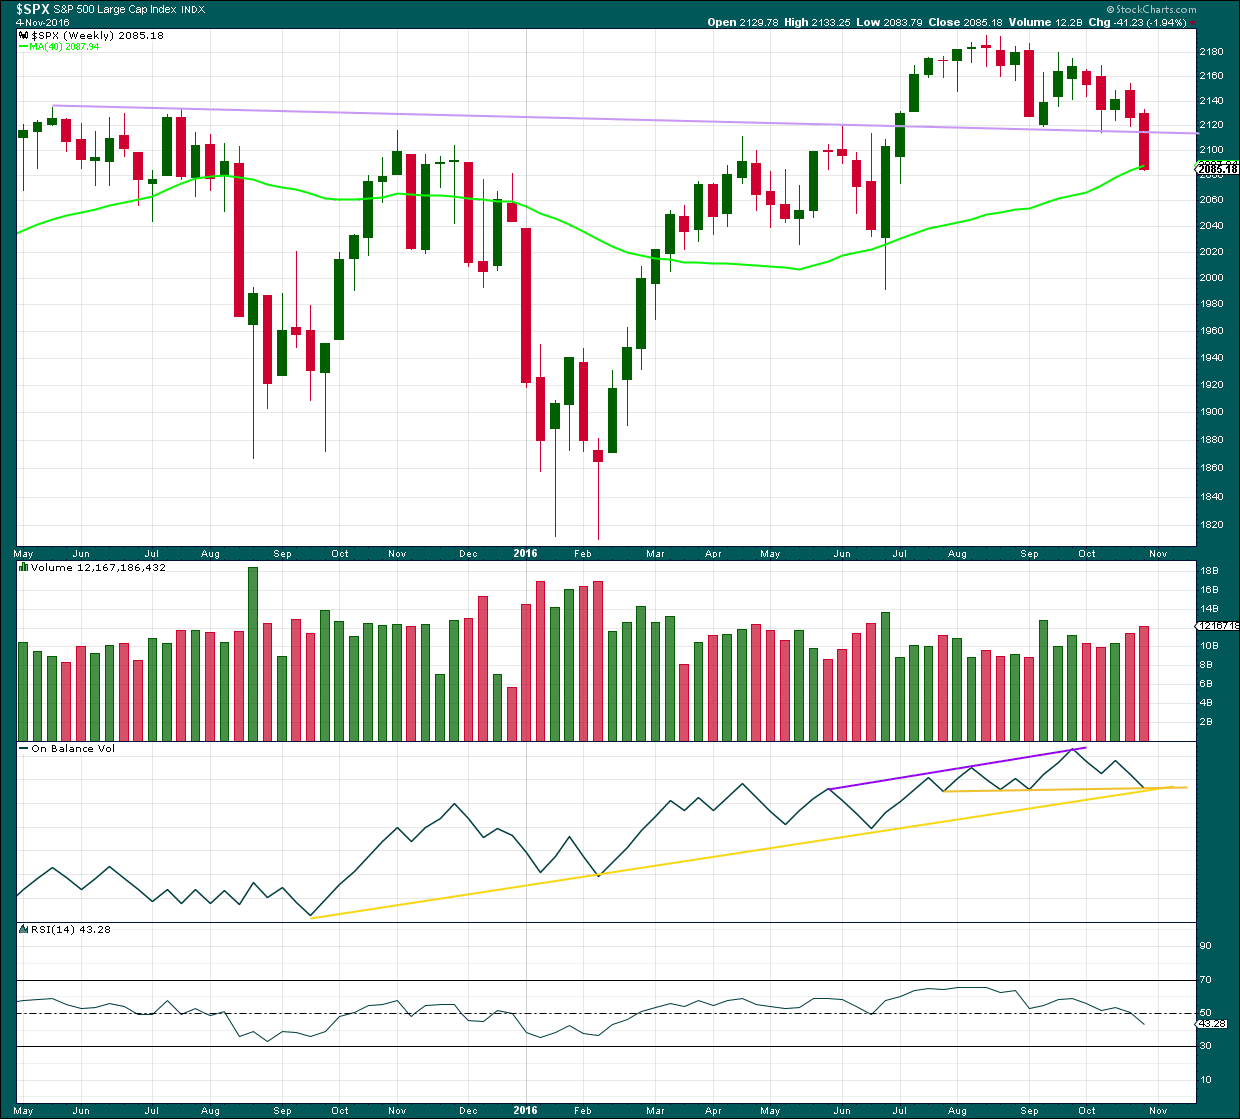
A strong downwards week breaking and closing well below the lilac trend line is a strong bearish signal. After a trend line breach, it would be typical to see price turn upwards and test resistance at the line.
There is strong support for price here from the 40 week (200 day) moving average. There is strong support for On Balance Volume here by both yellow lines. This suggests price may bounce early next week.
How high the bounce goes is going to tell us which Elliott wave count is correct. From a classic technical analysis point of view a breach back above the lilac line would be very bullish. If that happens, then new all time highs may be expected. But if the lilac line remains intact and provides strong resistance, then the possibility of a bear market would increase.
DAILY CHART
Click chart to enlarge. Chart courtesy of StockCharts.com.
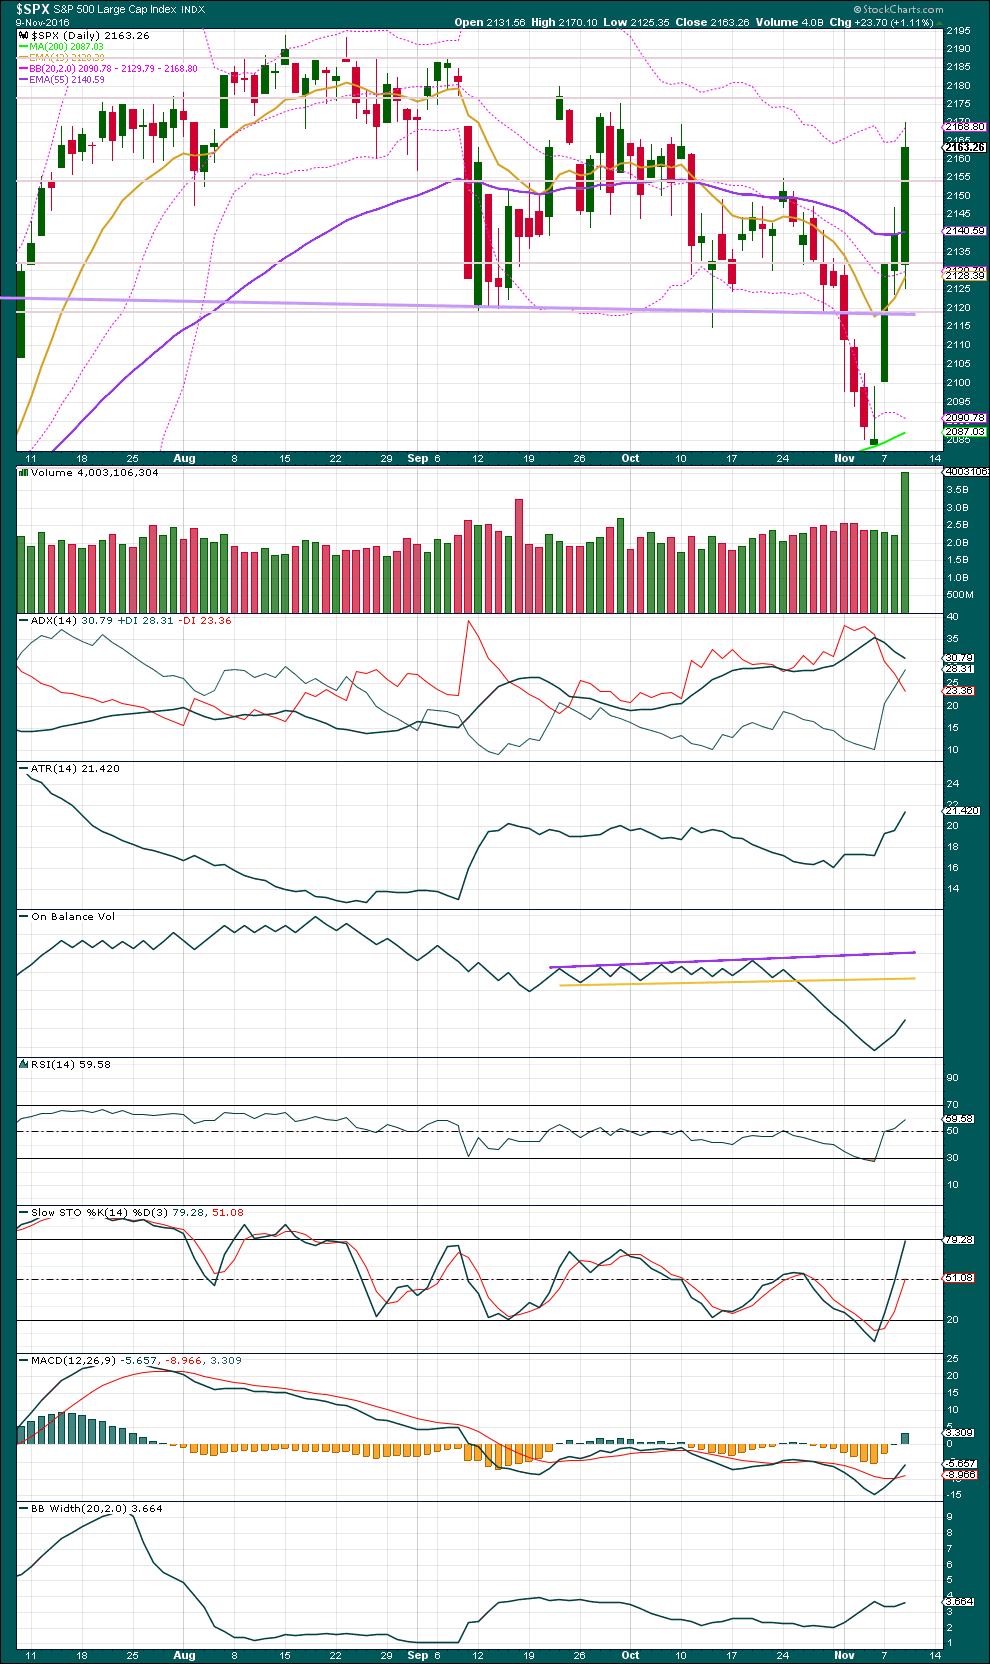
A strong upwards day has very strong support from volume. This is what a third wave should look like. This supports the main Elliott wave count over the alternate.
On Balance Volume moved upwards. There is plenty of room for it to continue higher before it meets resistance.
ADX now indicates a trend change. If the ADX line turns upwards, it would then indicate an upwards trend in place.
ATR indicates the market is likely trending as it is increasing. Bollinger Bands widened today in agreement that a trend is most likely unfolding.
Price is close to the upper edge of Bollinger Bands, but closed within them. During a trend, particularly a strong third wave, price can close close to the edge or just outside of Bollinger Bands for a few days before turning.
RSI is not yet extreme. There is room still for price to rise.
Stochastics is not yet extreme.
VOLATILITY – INVERTED VIX CHART
Click chart to enlarge. Chart courtesy of StockCharts.com.
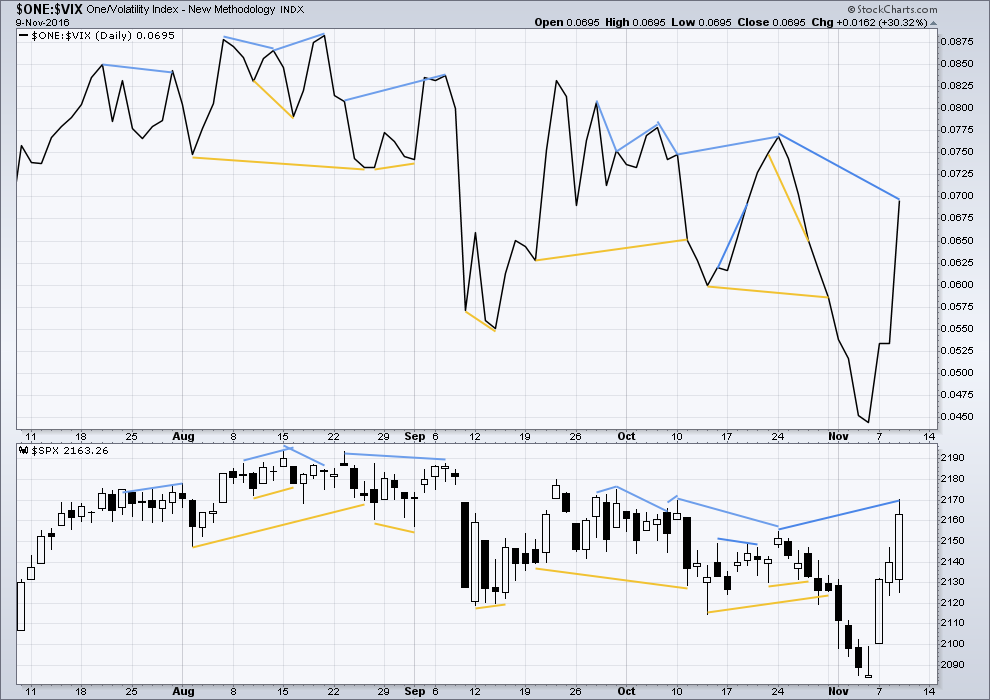
There are a few instances of multi day divergence between price and inverted VIX noted here. Bearish divergence is blue. Bullish divergence is yellow. It appears so far that divergence between inverted VIX and price is again working to indicate short term movements spanning one or two days.
Price moved higher today along with inverted VIX. However, price has made a new swing high above the prior swing high of the 24th of October yet inverted VIX has not. This is regular bearish divergence and indicates the bulls are exhausted. It may be followed by one or two days of downwards movement.
BREADTH – AD LINE
Click chart to enlarge. Chart courtesy of StockCharts.com.
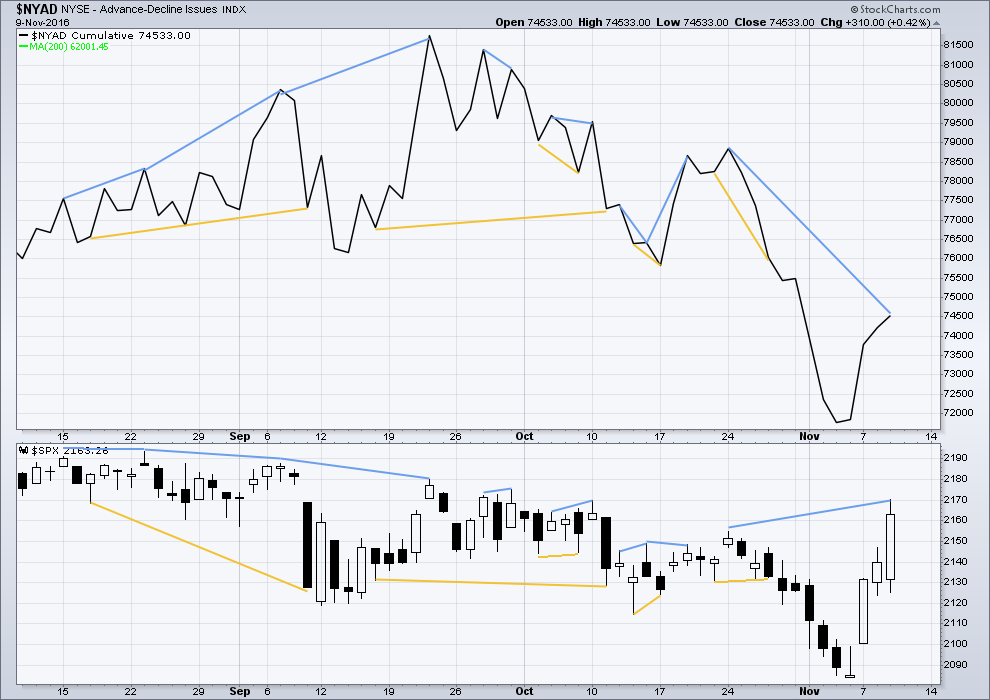
Short term bullish and bearish divergence is again working between price and the AD line to show the direction for the following one or two days.
There is regular bearish divergence today between price and the AD line: price today made a new high above prior swing high of the 24th of October, but the AD line has not. This indicates a lack of breadth to this upwards movement. It may be followed by one or two days of downwards movement.
BREADTH – MCCLELLAN OSCILLATOR
Click chart to enlarge. Chart courtesy of StockCharts.com.
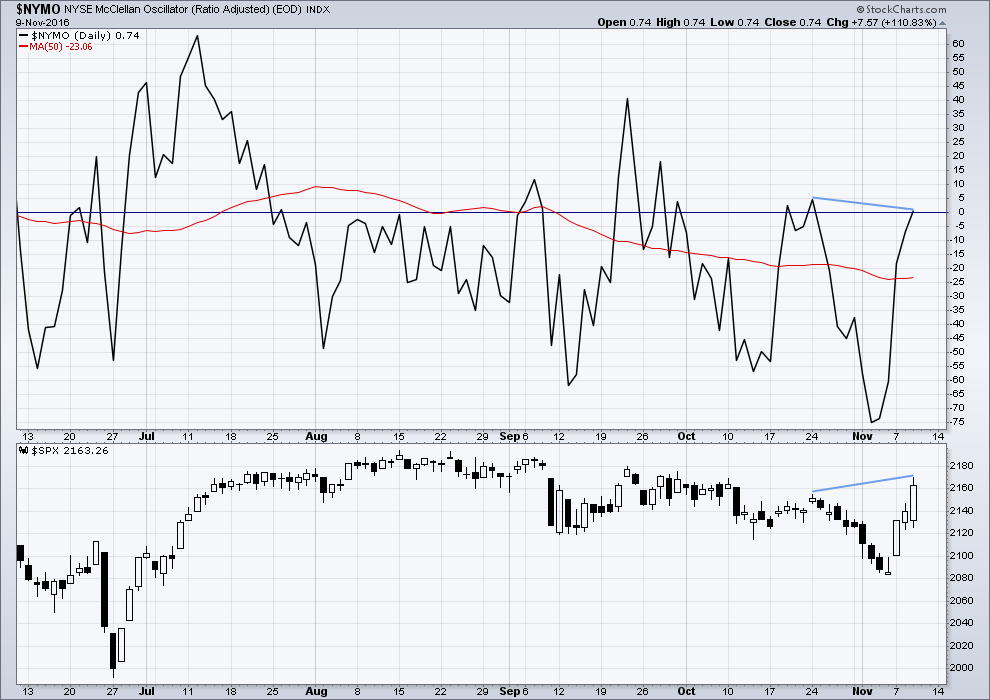
The McClellan Oscillator is now extreme (below 60). On its own this is not an indicator of a low, but it is a warning that this market is oversold. The McClellan Oscillator today is at -73.44.
On the 21st August, 2015, the McClellan Oscillator reached a similar point of -71.56. Price found a low the next session, 104 points below the closing price of the 21st August. This very extreme reading for the 24th August would have been a strong indicator of a low in place.
On the 11th December, 2015, the McClellan Oscillator reached -80.82. It moved lower the next session to -92.65 and price moved 19 points lower. The extreme reading of 11th December might possibly have led to an expectation of a bigger bounce than the one that occurred, and might have misled analysis into missing the strong fall from 29th December to 20th of January.
The next most recent occasion where this oscillator was extreme was the 8th January, 2016. It reached -66.25 on that date. The low was not found for seven sessions though, on the 20th January 2016, almost 110 points below the closing price of the 8th January. At the low of the 11th February, there was strong bullish divergence with price making new lows and the oscillator making substantially higher lows. This may have been a strong warning of a major low in place.
The most recent occasion of an extreme reading was -75.05 on the 2nd of November. The last low came two days later.
As an indicator of a low this is not it. It is a warning of extreme levels. The next thing to look for would be some divergence with price and this oscillator at lows. Divergence is not always seen at lows, but when it is seen it should be taken seriously. Any reading over 100 should also be taken very seriously.
This indicator will be approached with caution. It is one more piece of evidence to take into account.
There is regular bearish divergence today between price and the McClellan oscillator: price today made a new high above prior swing high of the 24th of October, but the McClellan oscillator has not. This indicates a lack of breadth to this upwards movement. It may be followed by one or two days of downwards movement.
DOW THEORY
Major lows within the old bull market:
DJIA: 15,855.12 (15th October, 2014) – closed below on 25th August, 2015.
DJT: 7,700.49 (12th October, 2014) – closed below on 24th August, 2015.
S&P500: 1,821.61 (15th October, 2014) – has not closed below this point yet.
Nasdaq: 4,117.84 (15th October, 2014) – has not closed below this point yet.
Major highs within the bear market from November 2014:
DJIA: 17,977.85 (4th November, 2015) – closed above on 18th April, 2016.
DJT: 8,358.20 (20th November, 2015) – closed above this point today, the 9th of November 2016.
S&P500: 2,116.48 (3rd November, 2015) – closed above this point on 8th June, 2016.
Nasdaq: 5,176.77 (2nd December, 2015) – closed above this point on 1st August, 2016.
Dow Theory Conclusion: The transportations today indicate an end to the prior bear market. The transportation index today confirms a bull market.
This analysis is published @ 11:06 p.m. EST.
Verne – a really huge THANK YOU to you for being so very kind and generous in sharing your trading tips and secrets. You add so much to this membership I think I should be paying you, not the other way around 🙂
We are all learning from your expertise. Pretty sure some of us are profiting from it too.
Unfortunately for me I cannot trade UVXY through my NZ broker. Not even CFD’s. VIX, yes. UVXY, no. Otherwise I would have bought some UVXY today.
So very kind of you Lara. You are MOST welcome!
This doesn’t meet all the rules for a diagonal for the S&P. The diagonal should be contracting, but the trend lines are diverging not converging.
It’s a rule for a contracting diagonal that trend lines must converge.
Also, diagonals normally adhere very neatly to their trend lines. This one doesn’t.
If this works for DJIA but not S&P then one of them is wrong.
Interesting EWT interim report from Prechter and company today. He thinks it is possible to see us close to a top in DJI. He sees a possible ending diagonal almost complete.
I do not know if he is correct in that assessment. I do know the violent jump of DJI to the top of its BBs strongly suggest some kind of imminent correction prior to a sustained move higher. The VIX close in the green today is also a cautionary tale for the immediate bullish case. Have great evening everyone. I will check in occasionally tomorrow to post any trades executed. Cheerio!
Like this? This meets all EW rules. Limit = 19,488.92 where 5 = 3.
Let me see if this idea works for the S&P….
Yep!!
Dragonfly doji on close for SPX.
Long Legged Doji ??? Dragon Fly Dji looks like a ‘T’, I think.
From Bulkowski: http://www.thepatternsite.com/LongLegDoji.html
“The long legged doji is like other doji candlesticks. It means nothing. Tests confirm that the breakout direction is random. In theory, the long legged doji acts as indecision among traders as to the direction price will take. In a doji, the opening and closing prices end where they started after both rising and dropping during the session. The tug-of-war between the bulls and the bears results in a stalemate at the closing bell. What will happen tomorrow is anyone’s guess. “
Long legged it is indeed so I stand corrected. True no predictive value, but coming at top of the BB seems to me to at least not militate against a possible move down and what one would expect for an impending directional change.
Thanks Lara
Lara – any update on the market before close today?
Rajesh
I posted a chart below
Sorry, I missed it. Thanks
Rajesh
No worries 🙂
I’m on the road shortly, I’ll be stopping to do the S&P analysis a bit after markets close. Depending on how easy it is for me to find a wifi hotspot and decent food…. this analysis today might be a wee bit later than normal.
Let’s see….
This is what I would have expected from a blow off top kind of move. The only thing missing so far is the participation of all the other senior indices. Bull markets often end without across the board participation in new ATH.
SPX now joining DJI in exploring nether regions of BB space. NDX apparently not interested at the moment…
Lara, my charts look very different to yours especially as your main Day chart did not show the big spike down yesterday. I understand this is because your charts on based on the cash market and the FXCM ones that I use on based on the futures. Can you please repeat again how you download the cash charts into MotiveWave?
I have MotiveWave set up to connect to my BarChart data feed.
But if you don’t have the BarChart data feed you can use the cash data from Yahoo Finance here.
Choose Historical Data, then at the bottom “download spreadsheet”. Save it as a .csv file. I use BB Edit for that, not sure how this works for Windows (I use Macs).
Open Motive Wave: File > Chart > Import Data > Add > find your .csv file. I uncheck every option on the bottom. Select NY time zone and don’t worry about the exchange or trading hours, doesn’t seem to matter.
Nick and anyone else: if you can’t follow my written instruction above let me know. I’ll do a short video on how to get data into Motive Wave for you all.
I need to do it for at least one market myself, so I may as well record the process for you.
This market is absolutely crazy!
It may be time for me to pack it in completely… I don’t understand “any of it” anymore. The BEAR is DEAD!!!! Never to be seen again.
I’ll certainly look back at 2016 as a tough year to trade. Trading a sideways market saps alot of time and energy for modest gain (if you’re nimble) or loss it you’re not. It started off great, then I’ve spent the rest of the year getting back to where I was in March.
I for one will be glad of any trend whether it’s up or down. I’m glad to have taken a few months away – I don’t think my account is any worse because of it and my sanity has definitely benefitted.
I guess you need to experience the rough to appreciate the smooth.
Ditto. In my short term trading account I have not yet gotten back to where I was in March. I am also hoping for a trend. I think it will be trending up for a while.
Taking a few months off is so often the very best thing we can do. Nice to have some commentary and analysis from you again.
Thanks Rodney 🙂
Missed ya too! Maybe now that you are back I can take a bit of a holiday!
Cheers Verne 🙂 I wouldn’t say I’m back – let’s see what Mr M has in store!
He seems to be up to the same old tricks today. If that’s still his game then I may sit it out for a few more weeks to preserve capital and sanity.
I’d recommend that holiday anyway buddy – a rest is as good as a change (and vice versa)!
Hard to trade as most of the moves are in the overnight and who wants to get trapped into that after what happened Tues night into Wednesday. Dow futures were down 900+ and I thought I saw down 1000 for a few moments… but I was wasted and could not find evidence of that the next day.
What if it keep going down from there?
If price goes below 2125.35, the alternate would increase in probability, but depending what traces out it probably wouldn’t be the only game in town.
Price is just poking the lower base channel now – lets see what Mr M has up his sleeve. If we get close to 2125 I would suggest a bullish entry with a stop just below 2125.
The bear will be here one day Joe, just not now.
The market may be insane but as long as it trends we can make $$$. And really, that’s all we’re here for.
If Trump get’s everything he wants to do economically & from a regulatory standpoint passed into law and implemented… there will be no Bear Market in the USA indexes for several years. I had all of this starting to affect the markets in the Summer of 2018.
It should not be affecting it now. The Bear should be flushing everything now and throughout 20017.
So if it doesn’t start now or very soon, I can come to only one conclusion… the last 2 years was not a topping process… just a pause. With no sign of a Real Bear Market for at least the next 8 years. Which means no Cycle waves are near a conclusion for at least the next 8 years.
That is what makes sense to me from all that know.
Yea… it can be traded but even short-term trades (for me 3 days to 3 weeks) well I have a hard time reading and making sense of that also.
Amazing is it not?
DJI up 237 points and VIX could care less…flying a green flag. Yikes!
Talk about some serious divergence.
These market makers are really too funny. They are now, and with a straight face I might add, offering only 0.45 for those TBT puts I picked up but STILL asking 0.81 for ’em. They love putting those ridiculous spreads out there when they don’t want you anywhere near certain option contracts…nothing to see here…move along! he! he!
Looks like we are going to extend the cavorting above the upper BB so I expect to be underwater on my long volatility positions for a bit but I’ve got my scuba gear at the ready! 🙂
Fat lady not singing quite yet – I see weakness in this move up atm.
If we exceed todays high then you might need to ensure those air tanks are full though 🙂
Very difficult to know what that wave down to todays lows was. Was definitely impulsive but was it a 5 or 3 wave overall structure. Stay tuned!!
This upper BB cavorting for me is definitive. It may take a day, or it may take two, but RTM it will. Not too much in these bizzaro markets one can be certain of…LOL 🙂
The spread trade on TBT is the conservative approach. That candle above the BBs is now clearly a doji. Buying the Nov 18 38 strike puts for limit price of 0.75 per contract GTC…filled @0.75
Will sell at 1.50, GTC
I think that’s all for minor 2. As Olga says, if it continues for longer it will be disproportionate to intermediate (2).
It could though. That’s the risk. The S&P’s structure don’t always look perfect. I wish they did, that would make analysing and trading this market a whole lot easier.
Risk must still be at 2,125.35. That’s a fair distance away. Scale positions down to limit no more than 3-5% of equity for any one trade.
Remember folk, it is the job of the bull to buck off its riders. Even in a bull run you don’t want to buy the rips, but instead the dips! 🙂
I think we’ll get another leg lower to finish up Minor 2 (unless C of Minor 2 was slightly truncated). I’m hoping price gets quite close to invalidation of Intermediate 2 as that would create a very low risk entry point to ride the bull.
That said, a move like that described above would take price well out of the Intermediate base channel which would make me suspicious.
ATM price is still within that channel as would be expected, but I can’t see this overlapping upwards movement from todays low being the start of Minor 3.
Agreed!
I can count the move down to todays low as a very fast double zig zag (1 min chart), so I guess it could be over – and the move stopped exactly on the lower base channel.
New highs would probably mean that was the case albeit I still don’t like the overlapping mess from this mornings lows. Maybe it will morph into a leading diagonal to kickstart Minor 3 up.
that fast wave down in the morning of this session does look very suspiciously like a five on the five minute chart…
I’m rather nervous about that too TBH
Yep! That indeed is what it looks like to me as well; suspiciously so methinks… 🙂
Perhaps the move down from today’s SPX high is an A wave and we currently are in a B wave up. A triangle of some sort at this juncture would allow the over bought conditions to be worked off in the next few days and prepare us for the move over 2200.
I do think the degree of labeling will need to be lowered to allow for an extended wave.
If we are in a fifth wave of cycle degree and fifth of primary degree, it certainly could come to us as tired and exhausted. But what is to say that we cannot have a powerful blow off top? I still think this is an entirely viable possibility.
Agreed Rodney, I expect today was a B wave. A sucker play.
Tomorrow C down.
Except this is a second wave so a triangle it cannot be.
Yes, it could all end in a blowoff top. That’s entirely possible.
My bet is on extreme weakness though. At the end a slow curving top; a nightmare to analyse and trade.
Then…. fall off a cliff 🙂
In response to NDX heading South, QID printing a nice fat bullish engulfing candle so it looks as if DJI will play catch-up to the downside.
scaling some dollar long and gold shorts.
Selling Nov 25 TBT 37/39 bearish call spread for limit credit of 0.85 per contract.
This trade should return an easy 50% over the next two weeks. Potential for more if 39 strike calls held for the continued march higher.
Here’s another RTM trade. I think bonds will continue to head South but that does not mean you cannot take advantage of the occasional pause that refreshes. Go do some early Xmas shopping courtesy of TBT! 🙂
Fascinating how the divergence in NDX and DJI futures is being reflected in today’s session, with the former being down over 1% and DJI still solidly in the green. Who will play catch-up?!
the initial reaction to trump is that he does not like Tech companies. Wants AAPL to manufacture phones here; etc. So maybe labor costs for tech companies goes higher (manufacturing here, limiting H1b1 visas, encryption , etc). Remember most tech companies did not support him. Look at AMZN stock.
What remains to be seen is that if this is a buying opportunity in techs or to avoid them for this leg of the bull run. Also stocks like FANG have been outperforming the markets for a while. So maybe they take a breather while rest of the market catches up.
AMZN completed five up long before Trump’s election. I think it and lots of other ridiculously valued stocks are toast and great long term shorts.
The trashing around today in the indices and especially DJI, is nothing more than sound and fury signifying nada. The upper BB penetration means we will ultimately get at least one close back below it and probably two. If price remains above it with additional spikes the move back below would only be delayed…but not ultimately denied….
NASDAQ futures are down over 2%. Long trades just might get an entry point sooner that we expect…Strangely enough, DJI futures are up over 100 points…weird!
Weird indeed. Just as was the action yesterday and the evening that preceded it. Down 900 DJIA points in futures overnight to recover 100% and finish up strongly is unprecedented.
Opened STC order on another 1/4 of UVXY 14.00 strike calls @ 1.75 GTC
A failure of the other senior indices to confirm the DJI’s ATH would be short term bearish imo…
If they do not do it today, I expect the pull back will continue at least through tomorrow before another attempt by the other indices.
Please keep in mind that even if we are indeed starting a new bull run higher, at some point those massive futures contracts that bought DJI out of 800 points in the red are going to be unwound. The payday for those holding those contracts is going to come out of the trading accounts of folk buying this move up.
If this is Minor 2, it needs to get a shift on imho otherwise it will look out of proportion with Int 2 which was quite swift. We may be in minute C of minor 2 now or still finishing off minute b of Minor 2 (starting minuette c or minute b of minor 2 now).
Below Intermediate 2 I start getting interested again. Atm I’m scalping with such small positions that they aren’t worth broadcasting.
Every little bit counts! 🙂
Yep – albeit my trading diary shows that I could have stopped trading in March, and I would have been in exactly the same position as I am now.
I guess there’s some lesson there. Bet I don’t learn from it though!
Might try a ‘reach target and run’ attitude next year. This year has been tough imho.
The hardest transition I had to make was from being a positional and swing trader to being a guerilla trader. I got so tired of winning positions turning into loosing ones and various other ambushes that I had no choice but to switch to the quick strike approach to survive this manic and manipulated market. I am not sure how else one could survive the past few years. Thanks to one of my mentors, Bryan Bottarelli for teaching me the art of “take no prisoners” trading, and Ken Trester for teaching the power, ease, and amazing versatility of the credit spread. Lock and Load! 🙂
I’m in that transition ATM Verne.
Cesar is much better at trading than me so far actually. I’m impressed.
Together we make a formidable team 🙂
My biggest weakness is in taking profits.
Lara, on that score of leaving profits in the market, I could tell you stories!
Selling SPX 215 puts for a quick double @ 1.65…will re-enter with a break of SPY 214.75
Selling 1/4 for 14 UVXY calls for a quick double on the first tranche…holding remaining calls for more upside…
I am going to give away a little secret at the risk of rendering it less effective as more people attempt it. This is one of the reasons the very best traders generally do not tell people what triggers they use so as to avoid dilution.
If UVXY makes a new 52 week low and it is trading below the price of VIX, don’t ask reasons why just buy it… 🙂
Thank you Verne. I’m literally writing this in my trading diary / book.
Most welcome Lara! You guys are like family so I am not really giving anything away. I really appreciate all the amazing things you do with those EW charts! 🙂
Filled at 1.49 on last quarter UVXY 14.00 strike calls….
My, my,my. New ATH on the DJIA. Soon to come on the SPX.
Vern, my friend, with the run up over the past few days, how can you say, “If the bull market is still alive, …”? It is alive and running. I suspect it is not going to stop running anytime soon as it gores the bears.
That being said, we have touched the upper Bolinger Bands as Vern astutely indicates. This is the place we start looking for a pullback. Remember though, the price can stay just below the BB at closing and push it higher for several days. A nearby example is July 11th though the 14th. Four days of relentless upwards pressure. Another example is March 1st through the 4th.
So if anyone wants to short this market, you must be prepared for a few more days of relentless upward pressure (panic buying) and you must be nimble with nearby stops. When that pullback comes it can technically drop to 2084 without invalidating this wave up. But I think the 2100 round number will not be seen again for some time. There is very strong support at 2120 and there is support in the 2150 region.
There is a decent chance we will soon take out 2200 and not look back. If the Main count is correct, and I believe it is, we are in or about to enter a 3rd of a 3rd of a 3rd up. This will be explosive as evidenced by volume and other technical indicators the past couple of days. Surprises will be to the upside not the downside. Those who have been bears for several years cannot believe their eyes. They are like a deer in the headlights of an oncoming auto, frozen. But the market is telling us to have a change of disposition from bear to bull. Psychology is a very important part of this market and we must adjust. Since the break out above 2133 this past July, many bears have not been able to make the adjustment.
I am grateful for Lara’s analysis and commentary. I am grateful for all the member commentary and camaraderie. I am concerned as well that many may try to buck the trend and get caught with their pants down. Not a good situation.
You could be right…I do think at the very least a short term pull back is in order….
I trade what I know and I know volatility…
I know your abilities and smarts are far beyond me. You trade very well and you are an expert on volatility. My concern is not for you but for those who might try to emulate your trades. They must be quick and agile like you. They must be quick to take profits off the table as well. Today may very well prove to be the perfect time to enter those short positions and volatility positions. And a short term pullback is in order. Possibly all the way to 2120. But the daily and longer term trend is up.
Point well taken my friend and I hope readers pay attention to what you said. I tend not to publish all my trades but will occasionally do so when I think we are at important pivots to illustrate how I put my money where my mouth is. There is no way novices or folk not very experienced with options should be executing these kinds of trades. I also try to post when I exit just to be transparent. Thanks for the heads-up Rodney.
I must say I do have very serious doubts about my smart exceeding yours my friend. I get very worried when you have a different out-look from mine and then I measure twice and try to cut only once! 🙂 🙂 🙂
See, that attitude of checking your assumptions is seriously smart Verne.
I suspect you may be one of the smartest people I’ve ever come across actually.
Adding UVXY 13 strike calls@ 1.43, 3/4 full position….last quarter to be filled at buy stop ask of 1.50….
Adding to UVXY 13.00 strike calls now at 1.33 ask….1/2 full position….
Buying SPX 215.00 strike puts expiring Nov 18 for 0.85 per contract.
Open sell to close at 1.50 GTC. Hard stop at SPY 218.32
Market makers are willing to pay 0.40 for VIX 14.00 strike puts expiring Nov 16.
They are willing to pay only 0.25 for the same strike puts expiring Nov 30
They expect VIX to trade higher and I think they are right.
Opened “stink bid” to buy SPX 216.50 puts expiring Nov 18 at 0.90 or less….
Buying UVXY Nov 18 13 strike calls for 0.90 per contract; 1/4 position with hard stop to sell at UVXY 11.25
Selling DIA 187/189 bearish call spread expiring Nov 18 for credit limit of 1.00 per contract.
Selling UVXY Dec 16 10 strike puts for 0.70 per contract – willing to take assignment of shares if UVXY below 10.00 at expiration. UVXY at new 52 week low today.
Sold yesterdays longs this morning
Looking for that red candle before starting to build up a final position
Thanks for all you comments and lets hope the markets trend and we all get an the oppurtunity of some great set ups
I’m with you on that Paresh. Let’s hope for a trend… either way and I’ll be happy, as long as this darn market stops mucking around sideways and trends already 🙂
If the bull is indeed still alive, a good entry point should be just ahead. Reversion to the mean trades are among the most reliably consistent and both DJI and DJT are trading above their respective BBs. I expect SPX to join them in that rarefied territory today and will be taking initial small short positions in all three indices as soon as SPX does, and adding to them after the first close back below the upper BBs. The massive buying of futures contracts we saw yesterday are probably going to be unwound as soon as the new upward thrust has drawn in enough new buyers to pull it off without upsetting the apple cart. I am still cautious and accumulating volatility shares.
If there is anything I have learned about the markets these days it is that nothing is always as it seems.
Nicely done. Thanks. And WOW to that volume today. Very strong support.
The SPX has basically gone sideways with some wide swings for 18 months now. We are breaking out of that consolidation and I am hoping we will see some strong trending for a while, like the next 3 to 6 months. That might make trading a bit easier.
Thanks also, Lara, for refereeing last evening. I hope your friends, in Texas was it, are doing okay. I’ll be online a bit tomorrow but then offline till next Wednesday. I am traveling with my family back to Chicagoland for a funeral for my wife’s sister at the young age of 58. Sad story. Sad times. See you all when I get back on line next week.
Travel safe Rodney. We shall welcome you back when you return.
It is Cesar’s family who are in Texas. They’re okay, but some are a bit sad today.
It looks like we have a bull market still. I’ll be looking for an entry point, but I also have to travel tomorrow so I’ll be on the road about 6 hours. I may get up very early to see what Mr Market is up to.
Condolences Rodney and safe travel. I know you will be a source of strength and encouragement to the rest of your family during a difficult time.