
More downwards movement was expected for Friday’s session.
Friday made a slightly lower low and a lower high.
Summary: Downwards movement is showing signs of weakness. With price and On Balance Volume at support, not much more downwards movement is expected. The target is now calculated at 2,076, which should be met on Monday.
Last monthly chart for the main wave count is here.
Last weekly chart is here.
New updates to this analysis are in bold.
MAIN WAVE COUNT
DAILY CHART
Click chart to enlarge.
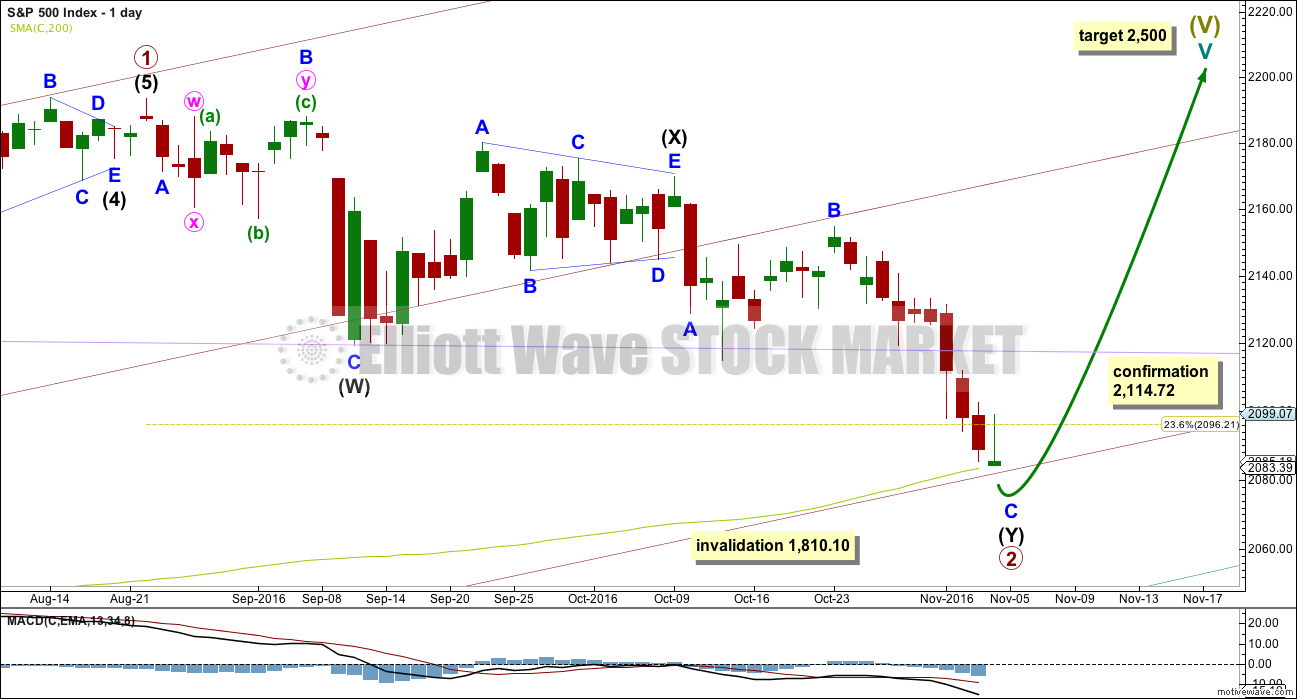
At this stage, primary wave 2 now has a completed zigzag downwards that did not reach the 0.236 Fibonacci ratio. It is very unlikely for this wave count that primary wave 2 is over there; the correction is too brief and shallow. Upwards movement labelled intermediate wave (X) is so far less than 0.9 the length of the prior wave down labelled intermediate wave (W). The minimum for a flat correction has not been met. Primary wave 2 may continue lower as a double zigzag. A second zigzag in the double may be required to deepen the correction.
Intermediate wave (W) lasted a Fibonacci 13 sessions. Intermediate wave (X) is a complete triangle. X waves may subdivide as any corrective structure (including multiples), and a triangle is possible here.
So far intermediate wave (Y) has lasted 20 sessions. If it exhibits a Fibonacci duration, then it may end in another one session to total a Fibonacci 21, or another 14 sessions to total a Fibonacci 34.
Primary wave 2 may not move beyond the start of primary wave 1 below 1,810.10. A new low below this point would see the degree of labelling within cycle wave V moved up one degree. At that stage, a trend change at Super Cycle degree would be expected and a new bear market to span several years would be confirmed. A new alternate wave count below outlines this possibility.
The target will now be about 2,038, the 0.382 Fibonacci ratio of primary wave 1. This target would see primary wave 2 move out of the wide channel (maroon), which contains primary wave 1, and end with a small overshoot only of the even wider teal channel (copied over from the weekly and monthly charts), which contains the whole of Super Cycle wave (V).
HOURLY CHART
Click chart to enlarge.
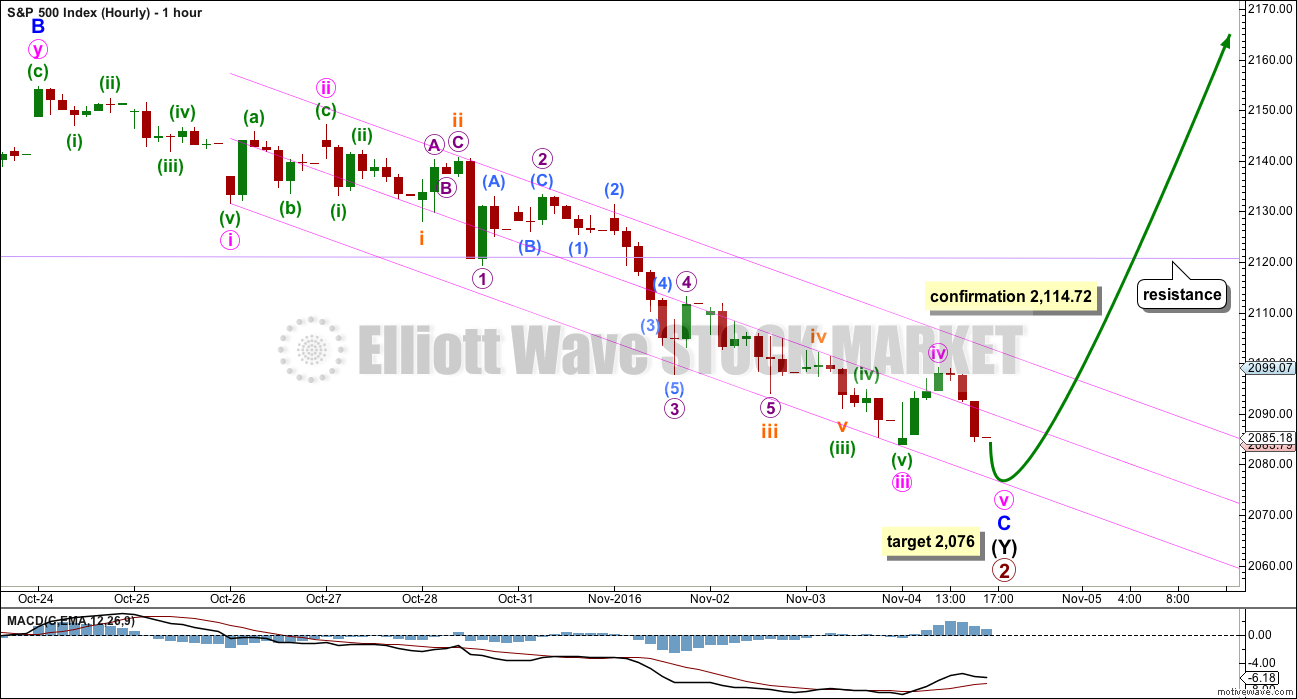
The structure of minor wave C is today relabelled. With strong support, a good Fibonacci ratio, and some indication this market may be oversold at this point, it looks more likely downwards movement may end soon.
At 2,076 minute wave v would reach equality in length with minute wave i. Minute wave iii is just 2.60 points longer than 2.618 the length of minute wave i.
So far minor wave C all fits neatly within this best fit channel. If upwards movement breaches the upper edge of this channel on Monday or Tuesday, then the expectation would be that downwards movement is over.
Ratios within minute wave iii are: minuette wave (iii) has no Fibonacci ratio to minuette wave (i), and minuette wave (v) is 0.97 points short of 0.236 the length of minuette wave (iii).
Ratios within minuette wave (iii) are: subminuette wave iii has no Fibonacci ratio to subminuette wave i, and subminuette wave v is just 0.69 points longer than 0.236 the length of subminuette wave i.
Ratios within subminuette wave iii are: micro wave 3 is just 0.84 points longer than 1.618 the length of micro wave 1, and micro wave 5 has no adequate Fibonacci ratio to either of micro waves 3 or 1.
Minute wave v may end early on Monday if price comes again to touch the lower edge of the channel.
If price does turn, then expect some resistance again at the lilac trend line on the way up.
A new high above 2,114.72 would invalidate the alternate and provide confirmation of this main wave count at this stage.
ALTERNATE WAVE COUNT
DAILY CHART
Click chart to enlarge.
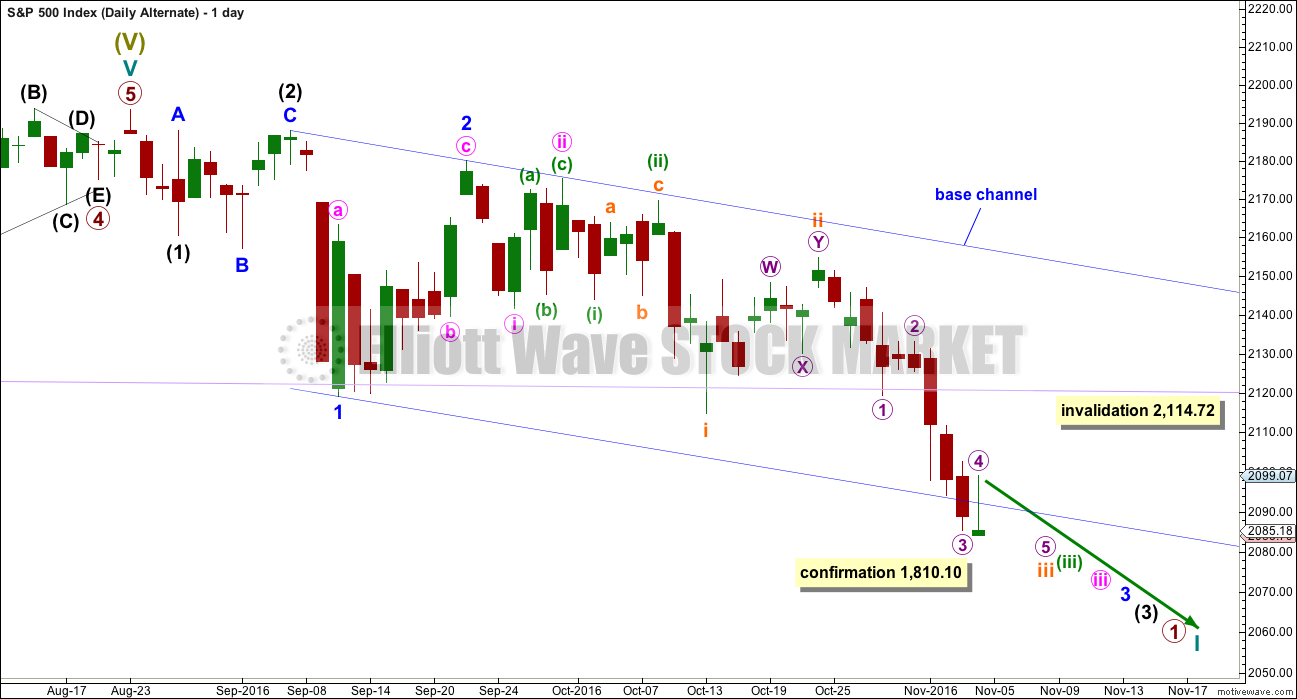
What if this downwards movement is the start of something even bigger?
This wave count expects that a new bear market to span several years and take price substantially below 666.76 has begun. For such a huge call it absolutely requires price confirmation below 1,810.10.
If a new bear market has begun, then the degree of labelling within the last impulse upwards is simply moved up one degree.
Downwards movement from the all time high may be a series of overlapping first and second waves. What looks like an obvious triangle must be ignored for this wave count. This is problematic, and it reduces the probability of this wave count. But this is a viable wave count.
The dark blue channel is a base channel about minor waves 1 and 2. Minor wave 3 should have the power to break through the lower edge of the base channel. The middle of minor wave 3 would not yet have passed for this wave count because price remains within the base channel.
Subminuette wave iv may not move into subminuette wave i price territory above 2,114.72.
TECHNICAL ANALYSIS
WEEKLY CHART
Click chart to enlarge. Chart courtesy of StockCharts.com.
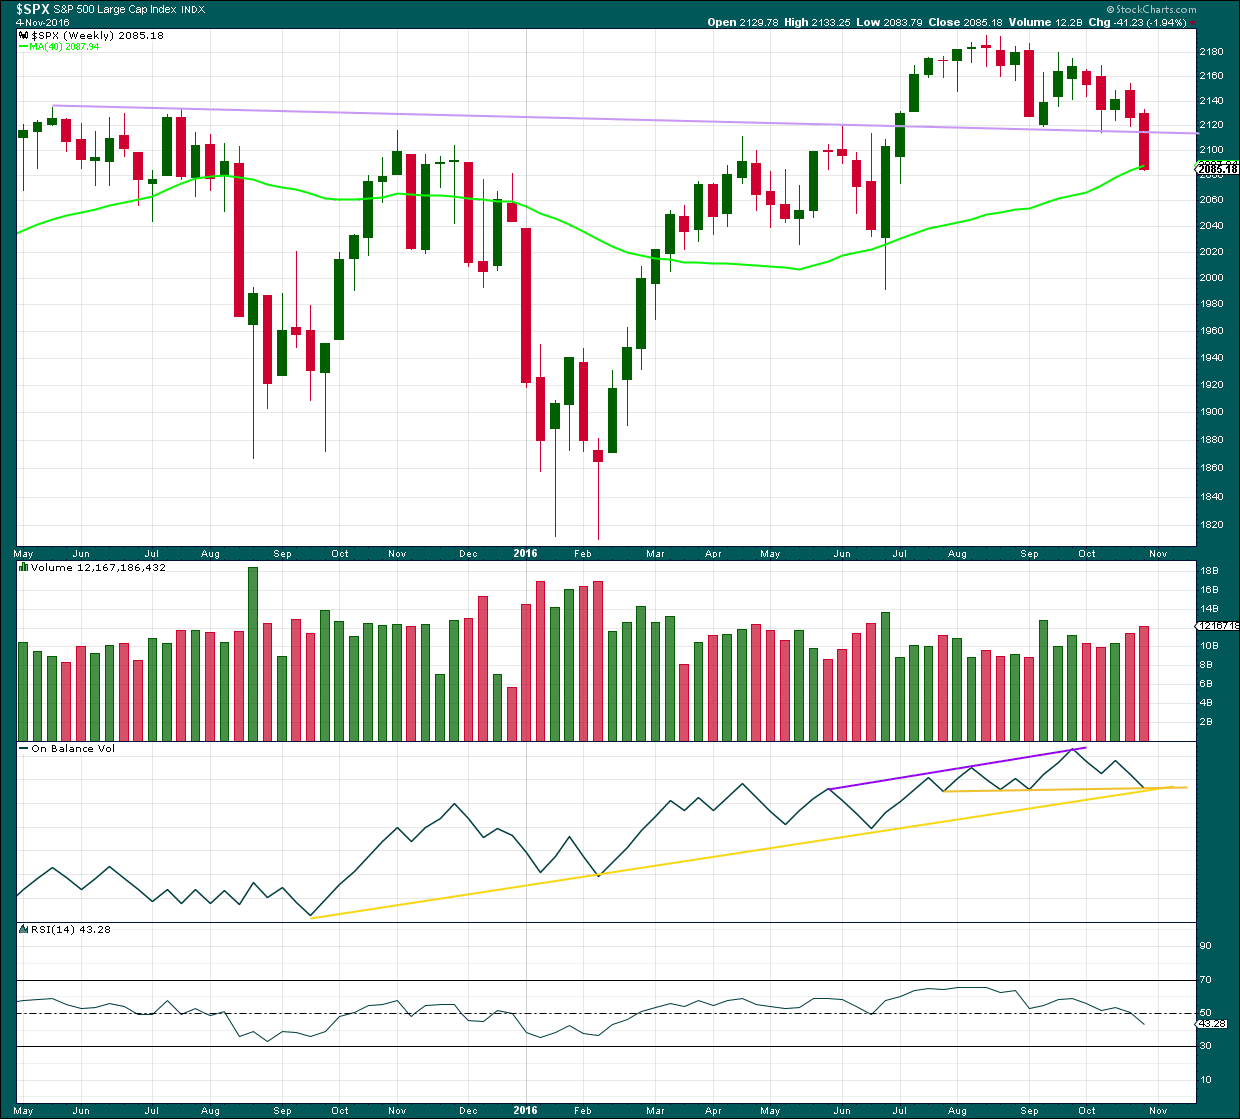
A strong downwards week breaking and closing well below the lilac trend line is a strong bearish signal. After a trend line breach, it would be typical to see price turn upwards and test resistance at the line.
There is strong support for price here from the 40 week (200 day) moving average. There is strong support for On Balance Volume here by both yellow lines. This suggests price may bounce early next week.
How high the bounce goes is going to tell us which Elliott wave count is correct. From a classic technical analysis point of view a breach back above the lilac line would be very bullish. If that happens, then new all time highs may be expected. But if the lilac line remains intact and provides strong resistance, then the possibility of a bear market would increase.
DAILY CHART
Click chart to enlarge. Chart courtesy of StockCharts.com.
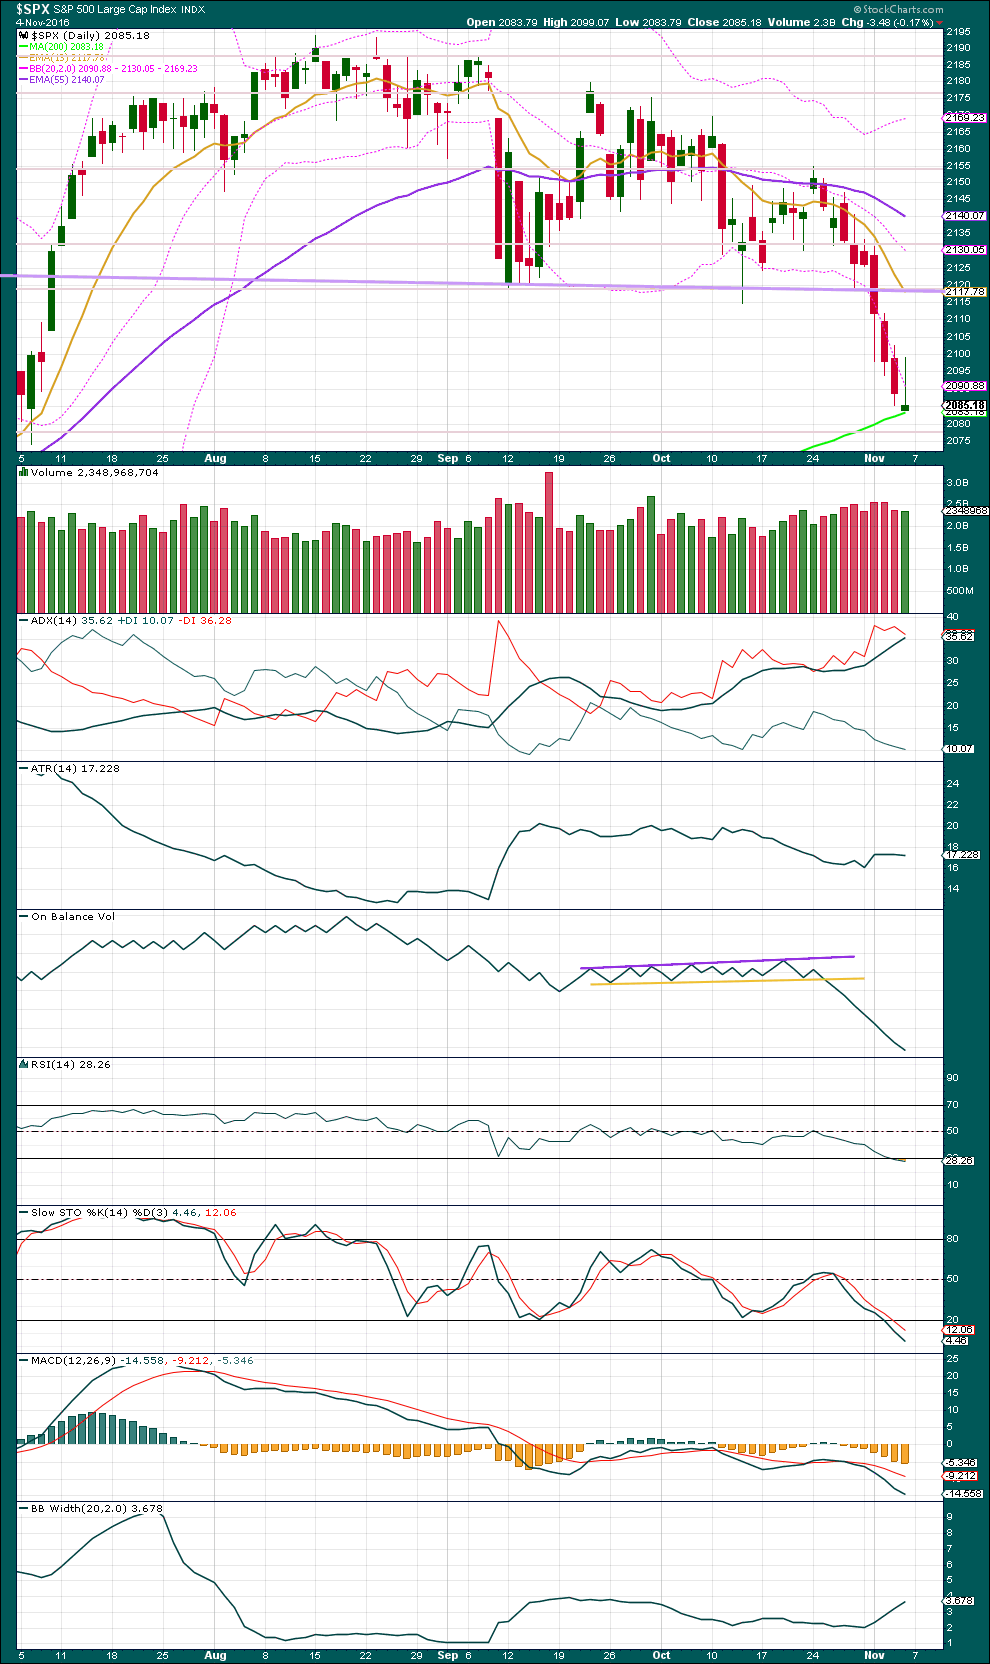
Price has bounced up off support from the 200 day moving average. With price closing now four days in a row below the lower edge of the Bollinger Bands, some reaction here or very soon indeed should be expected.
ADX is now over 35 and so extreme. This trend may need some relief, either by ending or from a consolidation for several days.
ATR has flattened off now for three days in a row. This indicates that the bears may be tiring; that they are unable to push price a greater distance each day, which is what should be seen for a deeper decline.
Bollinger Bands continue to widen, so volatility is increasing.
There is still a downwards trend, but it is showing some signs of weakness now.
RSI is now oversold as is Stochastics. Neither exhibit divergence yet though. If divergence does develop, particularly with price and RSI, then a low is fairly likely to be in place.
VOLATILITY – INVERTED VIX CHART
Click chart to enlarge. Chart courtesy of StockCharts.com.
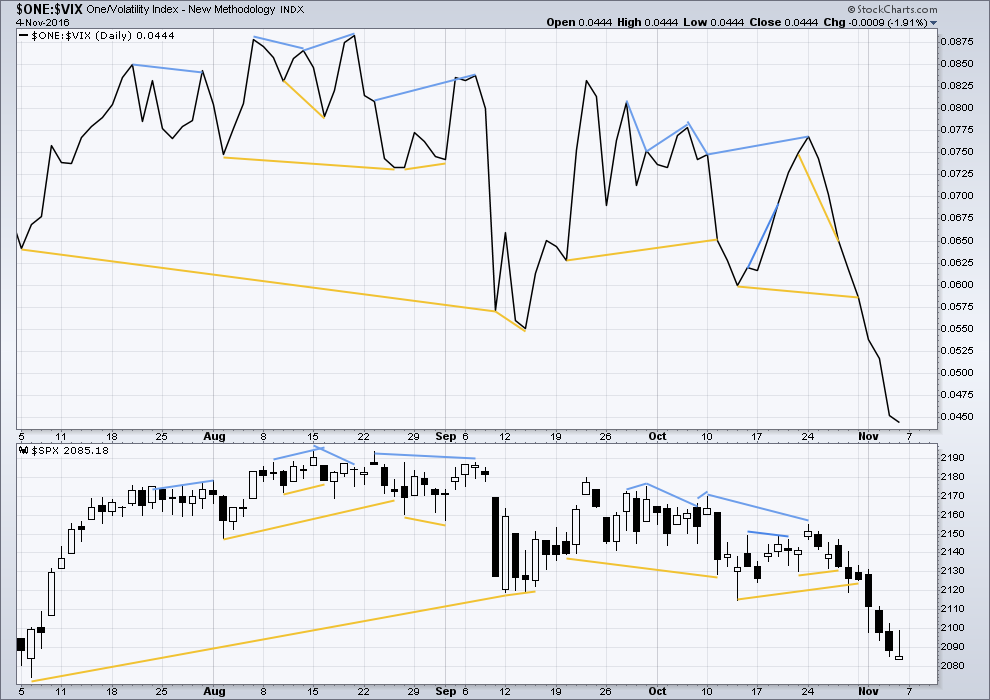
There are a few instances of multi day divergence between price and inverted VIX noted here. Bearish divergence is blue. Bullish divergence is yellow. It appears so far that divergence between inverted VIX and price is again working to indicate short term movements spanning one or two days.
No new divergence is noted today.
BREADTH – AD LINE
Click chart to enlarge. Chart courtesy of StockCharts.com.
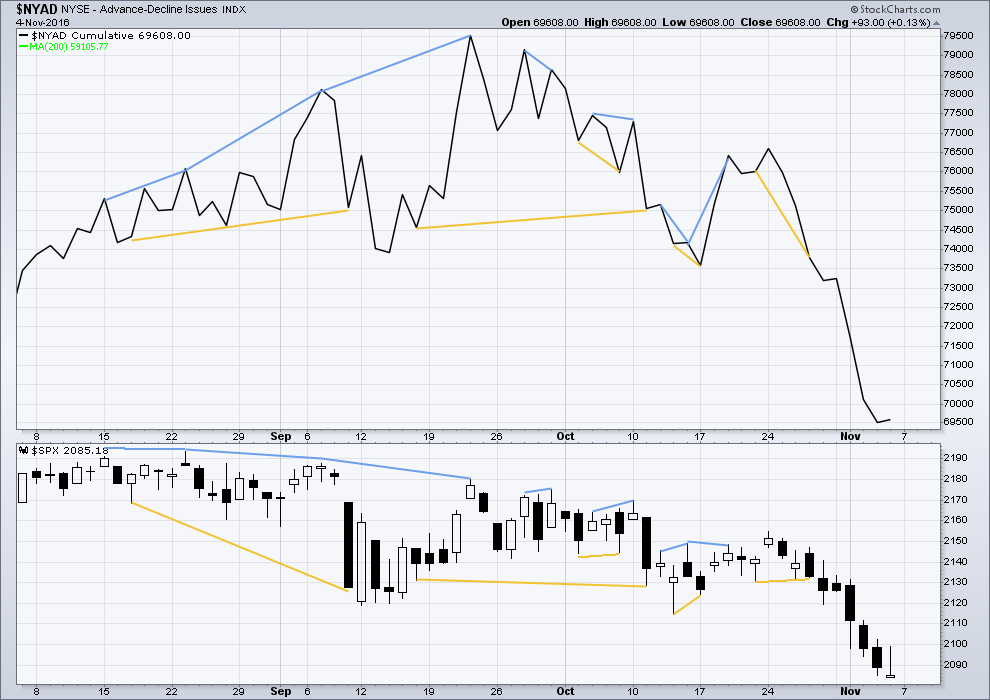
Short term bullish and bearish divergence is again working between price and the AD line to show the direction for the following one or two days.
The AD line moved higher while price moved overall lower for Friday. This divergence is bullish.
BREADTH – MCCLELLAN OSCILLATOR
Click chart to enlarge. Chart courtesy of StockCharts.com.
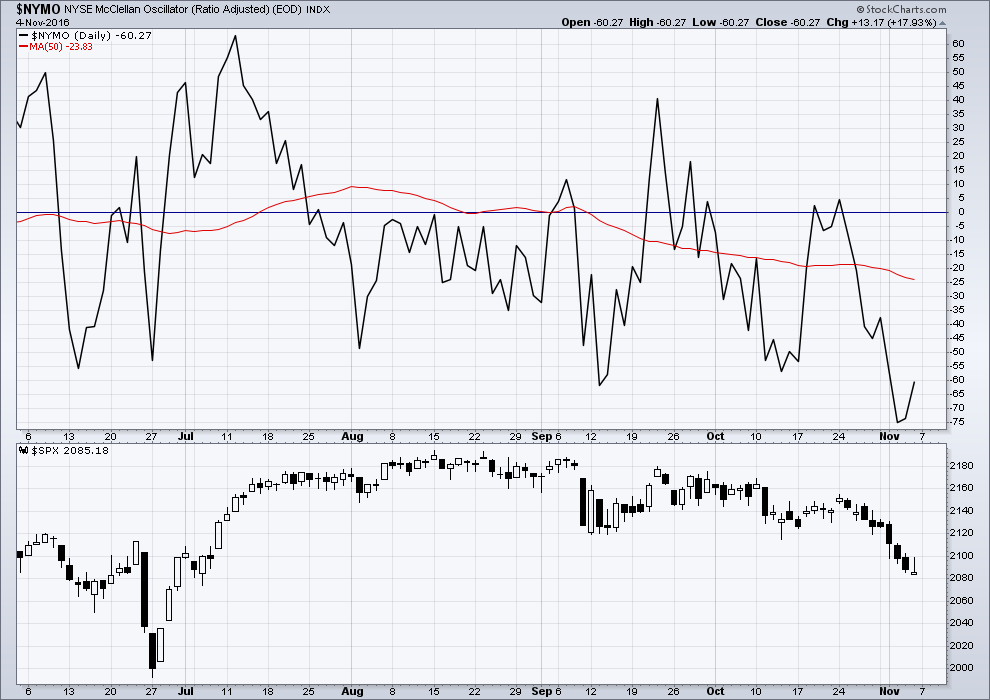
The McClellan Oscillator is now extreme (below 60). On its own this is not an indicator of a low, but it is a warning that this market is oversold. The McClellan Oscillator today is at -73.44.
On the 21st August, 2015, the McClellan Oscillator reached a similar point of -71.56. Price found a low the next session, 104 points below the closing price of the 21st August. This very extreme reading for the 24th August would have been a strong indicator of a low in place.
On the 11th December, 2015, the McClellan Oscillator reached -80.82. It moved lower the next session to -92.65 and price moved 19 points lower. The extreme reading of 11th December might possibly have led to an expectation of a bigger bounce than the one that occurred, and might have misled analysis into missing the strong fall from 29th December to 20th of January.
The next most recent occasion where this oscillator was extreme was the 8th January, 2016. It reached -66.25 on that date. The low was not found for seven sessions though, on the 20th January 2016, almost 110 points below the closing price of the 8th January. At the low of the 11th February, there was strong bullish divergence with price making new lows and the oscillator making substantially higher lows. This may have been a strong warning of a major low in place.
As an indicator of a low this is not it. It is a warning of extreme levels. The next thing to look for would be some divergence with price and this oscillator at lows. Divergence is not always seen at lows, but when it is seen it should be taken seriously. Any reading over 100 should also be taken very seriously.
This indicator will be approached with caution. It is one more piece of evidence to take into account.
For the last two days, this oscillator has increased as price has declined. This divergence is bullish.
DOW THEORY
Major lows within the old bull market:
DJIA: 15,855.12 (15th October, 2014) – closed below on 25th August, 2015.
DJT: 7,700.49 (12th October, 2014) – closed below on 24th August, 2015.
S&P500: 1,821.61 (15th October, 2014) – has not closed below this point yet.
Nasdaq: 4,117.84 (15th October, 2014) – has not closed below this point yet.
Major highs within the bear market from November 2014:
DJIA: 17,977.85 (4th November, 2015) – closed above on 18th April, 2016.
DJT: 8,358.20 (20th November, 2015) – has not closed above this point yet.
S&P500: 2,116.48 (3rd November, 2015) – closed above this point on 8th June, 2016.
Nasdaq: 5,176.77 (2nd December, 2015) – closed above this point on 1st August, 2016.
Dow Theory Conclusion: Original Dow Theory still sees price in a bear market because the transportations have failed to confirm an end to that bear market. Modified Dow Theory (adding S&P and Nasdaq) has failed still to confirm an end to the old bull market, modified Dow Theory sees price still in a bull market.
It is noted today that while the S&P500, DJI and Nasdaq are all falling, DJT is not. This is not part of Dow Theory, but divergent behaviour between DJT and the other indices is a cause for concern regarding this downwards trend for the S&P500.
This analysis is published @ 02:02 a.m. EST on 5th November, 2016.
Warning!!!! Today was nothing more than a Big Con Job by Wall Street! Notice it all started in the over night where it didn’t take much capital! Actually 6-7PM ET Sunday more than half the move occurred.
This was Wall Streets way of generating turn out (voting wise) for Hillary Clinton! Wall Street owns Hillary Clinton as WikiLeaks has proven!
Yes… The Economy and everything is else is fantastic and the Stock Market Proves it.
Yea… Sure it is!
He! He!
You know what Joseph? The thought had occurred to me that this rally might not be all it appears to be. If VIX prints a green doji tomorrow we could have a situation where the merry little fishies are all jumping on bankster bait….my bullish put spread is now showing a profit of 570.00 for my 25 contracts and I am taking the money and running at the open. Going to all cash for the duration of the on-going circus, a.k.a the US elections. I will be watching the clowns from a safe distance. 🙂
https://www.youtube.com/watch?v=8L6KGuTr9TI
An even more exquisite rendition; in my humble opinion.
Susan Boyle and the incomparable (although I do not like her politics) Barbara Streisand. 🙂
https://www.youtube.com/watch?v=OKbm90w14Cg
Alternate updated: final invalidation point for this idea 2,154.79.
Probability has reduced again today, but it can still be viable. Another second wave correction, but this one is deep and strong so this doesn’t look right… so far.
Six overlapping first and second waves now means a very strong move down imminent. Look out, this is still possible.
Further upwards movement should find very strong resistance at the upper edge of the base channel. A breach of that channel would substantially reduce the probability of this alternate, before it’s invalidated.
This why I love Lara’s analysis. Objectivity that is unflinching! Man is that a rare trade in Elliotticians!
Without it you will absolutely not survive as a trader. Thanks so much for this update Lara. I will be watching developments very closely the next day or two.
Take this possibility seriously folk.
Bullish put spread now up 330.00 so I will be holding through the close so the canary can continue to chirp. Let us hope hope it does not keel over and die overnight! Have a great evening everybody! 🙂
I meant of course “a rare trait”!
Freudian slip perhaps? I sure do have “trading” on the mind! 😀
On the lighter side:
A few sessions ago I was talking about bankster ambushes and how they sometimes gang up on short positions in an attempt to grind a large short position into powder Think I was joking?
Take a look at this chart of CBI which I think I may have mentioned that I was short. Can you believe these guys??!!
After seeing all that red in my account and finally locating the culprit, I quickly did my due diligence and tried to figure out what had happened.
A reverse stock split? Nope!
CBI blockbuster earnings? Nope!
CBB being bought out for for a 20% premium? Nope!
CBI discovered the perpetual motion machine? Nope!
Well then, it must be a bankster ambush!!!
I have a few friends who also have some deep pockets dudes!
Needless to say, I was reluctant to talk about this in the middle of the dog-fight but it does present quite a picture does it not?!
Guess what was down today, despite the massive SPX run-up…….. 🙂 🙂 🙂
A few comments on why I took the money and ran this morning. I think we can be fairly certain of Lara’s main count’s confirmation and that an interim bottom at the very least is in. What I saw with VIX however, was definitely not a capitulation move, ergo my personal level of caution. Lara pointed out that in a fifth wave of a fifth we should expect reduced momentum of the motive waves. Ordinarily, capitulation spikes are accompanied by the tell-tale move above the upper BB and long upper wick as the algos are forced to bail by the ferocity of the third and fifth wave completions. We also tend to get a bearish engulfing candle on the completion of the final wave down. These last few days saw none of these usually attendant signals and so in my opinion the usually safe 10X trade to the downside was definitely not in order this time around. The 23.01 high in VIX means we would need a return to the 13.00 level for that trade to pan out which is a possibility but not certain. The spike on June 27 to 26.72 was a much higher probability trade as a return to the 16.00 level was a fairly safe assumption. UVXY made its high at 20.84 last Friday and I think any chance of its trading back down to ten or below is remote and even less likely than VIX at 13.00 or less. The ridiculous reverse splits may have rendered this once reliable trade in UVXY now an impossibility. Note how it did not trade anywhere near where it did the last time SPX traded at the levels it did last Friday. One of the reasons this is emphatically NOT a buy and hold instrument. The last time SPX traded closed 2084 was on June 29 at 2070.77 and that day UVXY closed at at 50.45 after making a intra-day high at 53.05, levels we did not get anywhere near last Friday. There is clearly no linear relationship between the levels of SPX and UVXY so it generally has to be traded with a ruthless hit and run strategy. The one occasion on which it could be reliably held over several trading days now seems to have been distorted out of existence. The next few days should be most interesting.
Up 165.00 on my bullish put spread. Not exactly anything to write home about on a massive move up like this. Those puts are still fetching a pretty penny. I will be holding through the close and waiting to see what develops the next day or two. Yer’ can’t be too careful these days… 🙂
Update for the main wave count: the final low didn’t arrive 🙁 But we have some price confirmation 🙂
Target for primary 3 to = primary 1 at 2,467. This fits with the final target for cycle V = cycle I at 2,500.
If these targets are wrong they may be too high. This is a fifth wave at cycle degree within a fifth wave at super cycle degree. This is the last move up to end a Grand Super Cycle impulse. Thats a wave that lasts generations. We should expect extreme weakness, disassociation from reality, very strange goings on. It will not be a normal wave.
Sometimes for the S&P it’s third waves can be weaker than its first, then the final fifth wave weaker still. I will be looking out for that here. Primary 3 may even be shorter than primary 1, and primary 5 the shortest of them.
This is a third wave, but keep in mind the larger context. It may show some strength, but don’t be surprised if it doesn’t.
I’m so thankful to be on this site, so thank you Lara. I would have blown that last move down, but waited to go long thanks to Rodney, Vern, and Lara.
Most welcome David. Lara is the absolute best I have seen. Period.
I also really appreciate Rodney’s market instincts. The man thinks a lot like I do and its is great to often hear him mirroring what I am musing. Good to have one another’s backs in this tricksy (all due respect to Gollum) market.
The move of the September 12 low at 2119.9 was repelled by the 50 dma now around 2147.09. I will be riding a few bullish credit spreads in a conservative play on upside potential until we overtake the 50 dma on reasonably high volume. I still have the feeling we may be looking at bankster bait….
I cannot remember the last time I saw an interim bottom put in with this kind of gap down in VIX and gap up in the indices. I am really missing that long upper wick – my comfort blanket of sorts. 🙂
It is also interesting how much territory we have traversed toward the SPX upper BB in one trading session. Another move like this tomorrow and we surely burst through the upside. Is that sustainable??!! I am an agnostic on that query at the moment.
Back for a quick look see on my client’s network.
Well well well! The ramp up continues. Looks like I did bail a bit early but no worries. If we hold the ramp into the close I am back in. Instead of going straight out long the market, I will be using bullish credit spreads to get positioned ahead of a historic top.
We have not seen this kind of enthusiasm in quite some time. The bulls are downright giddy! 🙂
Today’s volume needs to be big. Or it would help a lot for the bull case if it were big. I am guessing 2140-2150 is the first real consolidation area. Daily MACD is just starting to turn up which is good news for the bulls because it can run awhile.
I should say “no worries” for your getting out too early. I saw that 150% profit. Great trade.
I am out for the rest of the trading day.
Market makers starting to show their hand. After being hugely in the green after the open, bullish put spread just about back to break-even….closing long side (short puts) of spread and holding long 208 puts. I could be leaving a lot of money on the table but I smell a rat….
A close above the round number pivots and I will be reloading volatility shorts. Have a great day everybody. Off to do a small window installment.
Did not get filled on the desired price for those short puts so I am still holding bullish put spread….
First the Cubbies win the World Series which they have not won since 1908; 108 years ago. Then the Irish Rugby team beats NZ for the first time in 111 years. Today the market snaps a 9 day losing streak which is the longest since 1918; only 98 years ago.
I too was expecting one more low for a chance to take my final long positions. I may still do that but nothing is for sure. If we started a Primary 3rd wave at Friday’s low, I guess this is a demonstration of that power. For the last two or three years, I have been looking for a blow off to the upside to signal the top to this bull market since the 2008 lows. It would be nice to see it materialize. 300 – 500 points to the upside by the New Year. The probabilities are low. But should that happen, we will conclude a Super Cycle top going back to the 1930’s. Stranger things have happened such as the Cubbies & the Irish rugby team.
NZ isn’t too unhappy about the Irish beating us. If the All Blacks had to end a strong winning streak then losing to the Irish is probably one of the better options.
Now if it had been a loss to Australia… the country would be in mourning.
UVXY chart going flat. VXX chart going flat. VIX chart going flat. Ahead of a sustained move higher they should all be pointing DOWNWARDS!
Except for bullish SPY put spread, going to 100% cash. The business of Mr. Market is to ambush as many folk as he can simultaneously. Be careful out there people.
On the sidelines for the time being.
Out of remaining vol shorts , including VXX, SVXY(long), UVXY, and VIX. Holding bullish SPY 208/211 spread as a canary trade. As soon as that spread goes in the red I know this ramp up is nothing but a great big pile of toro turd… 🙂
Do gaps more often than not get filled or if this is the 3rd waves can the momentum leave it open for the foreseeable future?
If this gap up is filled today you don’t need to be asking anyone what that means amigo!
Paresh, go back to late June of this year and look at the SPX daily chart. There are several gaps that have not been filled. However, these are the exception not the rule. You can see an unfilled SPX daily gap back in February as well.
So they do not need to get filled in the near term future.
Like Vern said, if we move down and fill the gap, then we have seen a failed attempt to break the 2114 long term trend line. Last week I said if we move up to 2114-2120 and keep going, the bottom is in. If we touch it an back off, we will most likely make another low. We are at that critical juncture.
As far as Lara’s counts, the Alternate has been invalidated and the Main count has been confirmed. Both when we reached 2114.72
Thanks you.
Monies on the table, lets wee what tomorrow bring!!
May the trend be with you 🙂
Closing out another 1/4 of short vol positions. A move of VIX back above 20 and I am shorting the HELL out of this market.
Don’t like what I’m seeing. Selling another half of vol short position and keeping an eye on VIX. I have a funny feeling a lot of traders are in the process of being set up for an ugly ambush. Any move by VIX one penny back above 19 and I suggest the longs get out of Dodge…pronto! Stay frosty!
We should know in the next hour or two how much of this ramp up is due to short covering….so far as VIX goes, so far, so good as we are still close to the day’s low. I will consider any move back above 19 a stark warning to take the rest of the money and run like a bat out of you-know-where! 😀
Selling 1/4 short vol position for 150% pop. Opened contingent .order to sell another half at 200%
I know I am probably leaving a lot of coin on the table but as they say, you gotta make hay while the sun shines!
Nice pop on short vol positions which I will be monitoring like a hawk into the close. NONE of these gains should be given back. Not one stinkin’ red penny!
Opened up a bearish put credit spread and those short-side put should continue to decline the entire trading session, a kind of canary in the coal mine as it were. I don’t fully trust this “rally”. It is in no way justified by things I know to be true. Then again, I am reminded of that old quote about the market remaining irrational… 🙂
O.K. European indices have now joined he party.
VIX also now appropriately showing an after-hours decline of 12%
Strangely though, none of the other volatility instruments like UVXY are currently showing an after hours bid that reflects futures prices and they also usually do right along with VIX. The indices are also still not showing elevated bids as would be expected from the current futures prices. I have looked at a few different feeds and they all show what I assume are bids from Friday’s close.
If futures stay this high, a lot of bearish positions are going to really get hammered. The vast majority of EW chartists and traders, myself included, were expecting at least one more low. I am glad I lightened my short positions and got positioned with my vol shorts, although I have to admit I was expecting to get ambushed by a gap down. The opposite seems to be what is going to happen at the open. I m glad I paid attention to the signal of the upper VIX BB penetration. Every single time in the past that I have ignored it because of conflict with other TA indicators the signal has proven to be more reliable, certainly so in the short term. I still intend to close out most of those positions during Monday’s session. I have a suspicion that this rally is going to be relatively short lived. If it is faded by the close that will be a huge clue that it’s a massive bull trap. Lousy bids on call options and a VIX strong move up off the day’s lows will also be a red flag. If this is really the start of a sustainable rally, volatility should head South and not look back, not even for a single second…
Good morning!
I’m taking a look at VIX and I’m seeing it closed above the upper BB for four days in a row.
I’m looking at the most recent data and seeing that four days might be reasonably considered a maximum?
Yep. It should be ordinarily. I am still a bit cautious about how the long the upcoming rally will be sustained in the absence of a VIX capitulation spike. It could be taking a pause that refreshes for another push higher…
European futures not sharing the euphoria.
Usually by now live VIX bid/ask as well as for indices available but nada.
Closing numbers from Friday still being shown and that is a bit unusual.
Just saying…remember who we are dealing with folks… 🙂
The excitement in futures suggesting that the next wave up has arrived, earlier than expected. I cannot at all complain as I minded the upper BB signal and started accumulating short vol positions. I still have a few downside hedges that I will be closing at the open. Media outlets all ascribing the powerful ramp up to a new letter from Comey asserting that the FBI’s conclusion regarding Clinton handling of her e-mails has “not changed”. This of course is compete mis-direction aimed only at the clueless masses who have no idea what is on the confiscated Weiner computers. I suspect this wave up will be quite brief – a bull trap for the ages, that will be triggered by a press conference by the NYPD or bureau agents fed up with the attempts to cover up the horror of what these people have been involved, Despite the collusion of the media, the DOJ, the FBI higher ups, there is no putting this genie back in the bottle. Hillary’s proverbial goose is cooked. Trade wisely!
Futures up 25 Points at open!!
Can imagine some margins have been called on bearish trades and may get a short squeeze
What is the line in the sand before we have confirmation that the move down is done?
Look for breach of the downward acceleration channel by upwards movement. It looks likely if futures remain elevated.
2114.72 is the line in the sand. If that is breached even momentarily, then the Alternate wave count is invalidated. That is roughly 30 points above Friday’s close. If futures hold up and the SPX opens up 25 on Monday morning, the 2114 invalidation point might fall the same day!
All because Hilary will not be indicted! Interesting. What happens if she wins the election?
According to Macroeconomics Advisers, a Clinton win would boost the S&P 500 by 2% while a Trump win would send U.S. stocks down 8%. Citigroup similarly predicted a 5% drop in stocks if Trump wins.
Not so fast on Hillary’s fate. You are right in that this is exactly what they want the masses to believe. However, if the reports about what is on those confiscated computers are even remotely accurate, and I believe they are, she is not only going to be indicted…she is also going to be incarcerated!I expect the NYPD to start leaking that material. We could be about to see a meltdown of the US judicial system run by the current corruptecrats….
To our Irish members: congratulations, well done on your team beating the All Blacks. That wasn’t expected by the NZers. First time in 111 years, pretty momentous!
WOW! First the Cubbies and now the Irish rugby team. Anything can happen including in the markets.
Yep! And it probably will! The kind of pop we are seeing in futures is something not seen for many months. There are a lot of smart folk that think this kind of manic move is emblematic of bear markets and rarely seen in true bull markets. That is why they call ’em bear market rallies. The turn in the M.O that Lara noted last Friday I guess was a great hint as well as the bounce off the 200 DMA, which frankly I was expecting. I am intensely curious to see how long this lasts- it seems to be mainly adrenaline driven.
Two quick queries for you Lara.
If primary two does continue to decline, I am curious as to how that would affect the wave count. The first thing that comes to mind is of course lowering the count degree but it seems as if that would result in some serious disproportion to minor waves A and B of intermediate Y
I am also wondering if the absence of more intense momentum (not a single day of a 1% decline) we would normally expect for a primary degree correction could be owing to the intermediate wave being a Y wave.
You could move the whole of primary 2 down one degree. But then primary 2 would be grossly disproportionate to primary 1.
Or you could move the degree within only intermediate (Y) down one degree and see primary 2 as a combination. But that would look wrong because intermediate (Y) has moved well below intermediate (W) now, where for a combination it should be sideways. So that would look very wrong indeed.
If price keeps going down hard then the probability of the alternate is going to increase. But it won’t be confirmed until 1,810.1.
I wouldn’t necessarily expect a primary degree second wave to have intense momentum. Put this into context: this whole movement from the low at 1,810.10 is for the main wave count a fifth wave within a fifth wave. The whole thing should be relatively slow and sluggish, lacking in momentum and volatility. At the end showing extreme divergence and weakness. This is the kind of wave that should have us guessing what on earth is happening, not making sense, almost a disassociation with reality.
A fifth wave to end a fifth wave… to end a huge Grand Super Cycle first wave….. Thats a wave lasting generations possibly coming to an end for this wave count. Or for the alternate, just over. We won’t see that again in our lifetimes, nor will our children.
So yeah, it should make no sense. And it isn’t. So that fits.
Thanks for that perspective Lara. It does make sense that momentum should be waning at this late stage in the game, and at this point in the wave count. It never occurred to me that third and C waves in a terminal structure of this magnitude showing weakness is not at all unusual, but rather to be expected. Now it all makes perfect sense, and in fact in a way could be confirmatory of the wave count.
Great analysis Lara. From my comments yesterday and this past week, you know I am on board with the main count. One more low Monday and / or Tuesday and then we look for the election rally followed by a year end Santa Claus rally to start the climb towards 2500 SPX. It is still difficult to comprehend we are going to continue the bull market. Ultimately it means the bear market to last several years will be even more devastating.
I sure hope you are right. I have been laddering into shot volatility positions the last few sessions in anticipation of an approaching market bottom. I now suspect the rally, if it occurs next week, is going to be far briefer than most expect. Just watched the latest Julian Assange interview with John Pilger. Amazing!
“Shot” volatility positions??! Was that a Freudian slip??!!
I sure hope it was not prophetic! Yikes!! 🙂 😀 🙂
The turn in the M. oscillator does give me a bit more confidence that we are not going to see a massive gap down on Monday. I think the comment on price moving back up to at least test the lilac trend line that previously provided support is very insightful and will be a critical key to assessing the market’s likely mid term direction. Outstanding analysis as usual!
Thank you very much Verne 🙂
I really like how price behaves around trend lines, I use it a lot for entry and exit points for trades.
Thank you Rodney.
So far that should be our main wave count yes, we should always assume the trend is the same until proven otherwise.
The long term trend is still indicated as up: the 200 DMA is pointing up and is below the mid and short term averages.
It’s the mid term trend which is indicated as down, not yet the long term trend. That fits with the main wave count.