
Yesterday’s analysis expected to see a green daily candlestick or doji for Thursday’s session.
This is not what happened, price has continued lower.
Summary: This trend may continue for a little longer and move a little lower. Some signs of weakness are now showing up, but not enough to call a low. Not yet. The target is now a simple Fibonacci retracement of the prior wave up at 2,038. Use the pink channel on the hourly chart. When and if price breaks above it with upwards (not sideways movement), then exit short positions.
Last monthly chart for the main wave count is here.
Last weekly chart is here.
New updates to this analysis are in bold.
MAIN WAVE COUNT
DAILY CHART
Click chart to enlarge.
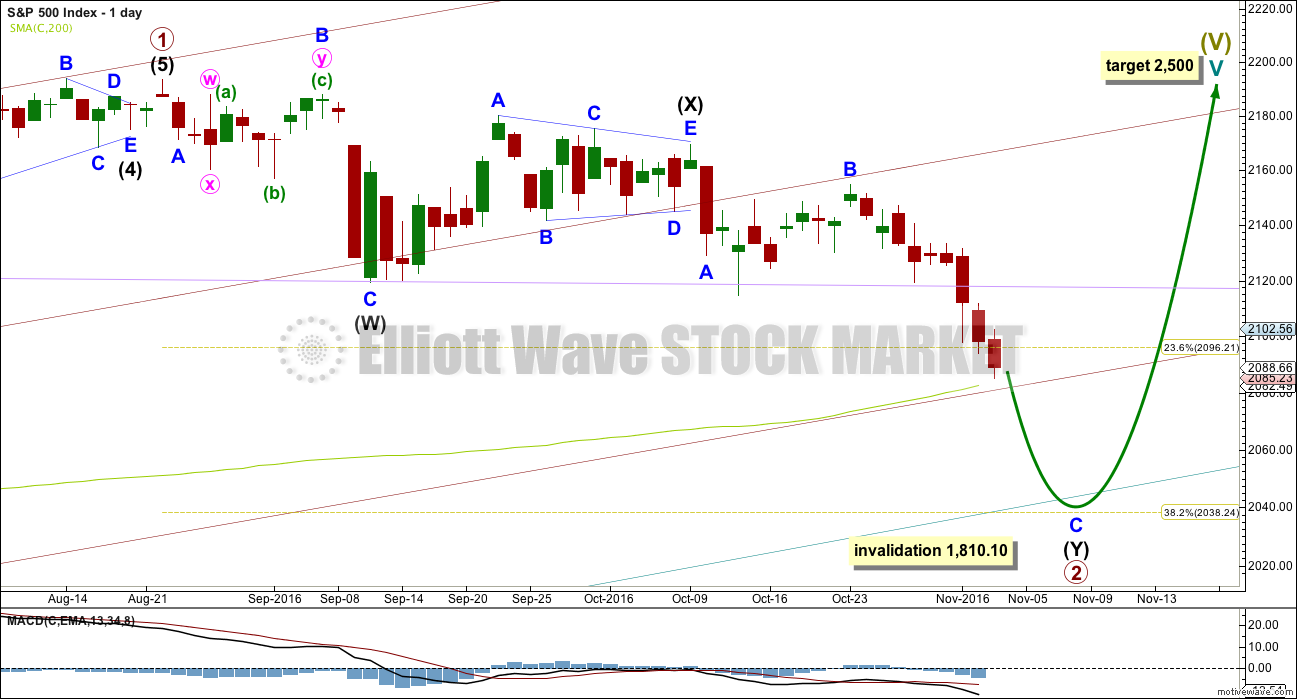
At this stage, primary wave 2 now has a completed zigzag downwards that did not reach the 0.236 Fibonacci ratio. It is very unlikely for this wave count that primary wave 2 is over there; the correction is too brief and shallow. Upwards movement labelled intermediate wave (X) is so far less than 0.9 the length of the prior wave down labelled intermediate wave (W). The minimum for a flat correction has not been met. Primary wave 2 may continue lower as a double zigzag. A second zigzag in the double may be required to deepen the correction.
Intermediate wave (W) lasted a Fibonacci 13 sessions. Intermediate wave (X) is a complete triangle. X waves may subdivide as any corrective structure (including multiples), and a triangle is possible here.
So far intermediate wave (Y) has lasted 19 sessions. If it exhibits a Fibonacci duration, then it may end in another two sessions to total a Fibonacci 21, or another 15 sessions to total a Fibonacci 34.
Primary wave 2 may not move beyond the start of primary wave 1 below 1,810.10. A new low below this point would see the degree of labelling within cycle wave V moved up one degree. At that stage, a trend change at Super Cycle degree would be expected and a new bear market to span several years would be confirmed. A new alternate wave count below outlines this possibility.
The first target at 2,089 looks to be too high now, because it does not allow enough room for the structure of minor wave C to complete. The target will now be about 2,038, the 0.382 Fibonacci ratio of primary wave 1. This target would see primary wave 2 move out of the wide channel (maroon), which contains primary wave 1, and end with a small overshoot only of the even wider teal channel (copied over from the weekly and monthly charts), which contains the whole of Super Cycle wave (V).
HOURLY CHART
Click chart to enlarge.
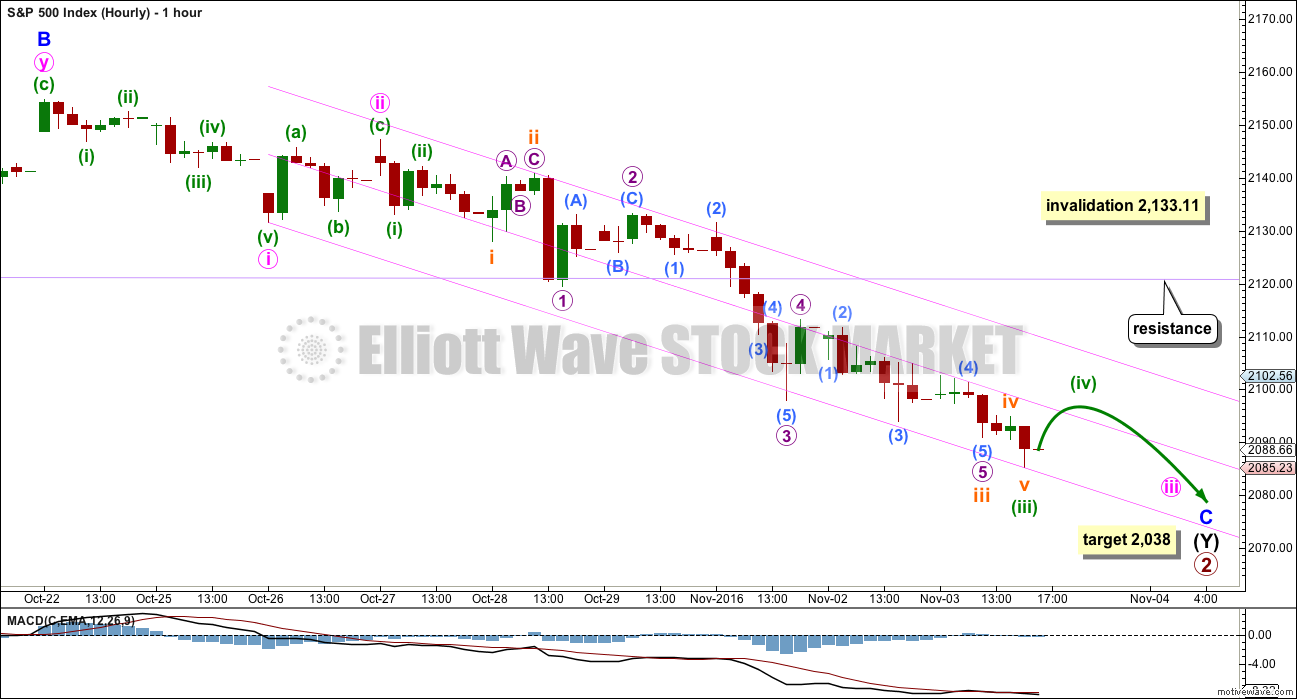
Minor wave C is still an incomplete five wave impulse structure. It still needs two more small fourth wave corrections and two more fifth waves down to complete it.
Minuette wave (iv) and minute wave iv may find resistance at either the mid line or the upper edge of the pink channel.
Minuette wave (iv) may not move into minuette wave (i) price territory above 2,133.11. It should not get anywhere near this point though. It should first find strong resistance at the upper edge of the pink channel.
The pink channel is a best fit acceleration channel. When minute wave iii is complete, then the upper edge should show where minute wave iv should find resistance. When this channel is properly breached by upwards movement, then it would be indicating an end to this wave down.
Expect the trend to continue while price remains within the channel.
ALTERNATE WAVE COUNT
DAILY CHART
Click chart to enlarge.
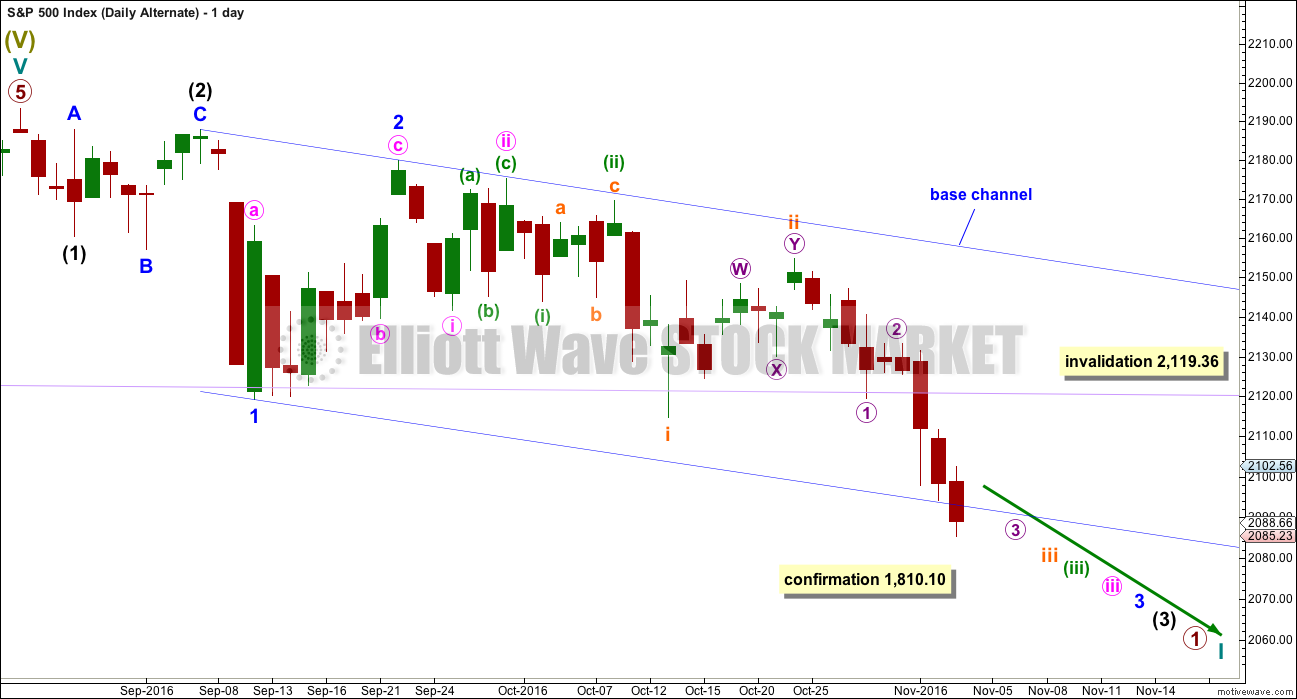
At this stage, a deeper pullback has been indicated by price for the main wave count. What if this downwards movement is the start of something even bigger?
This wave count expects that a new bear market to span several years and take price substantially below 666.76 has begun. For such a huge call it absolutely requires price confirmation below 1,810.10.
If a new bear market has begun, then the degree of labelling within the last impulse upwards is simply moved up one degree.
Downwards movement from the all time high may be a series of overlapping first and second waves. What looks like an obvious triangle must be ignored for this wave count. This is problematic, and it reduces the probability of this wave count. But this is a viable wave count.
The dark blue channel is a base channel about minor waves 1 and 2. Minor wave 3 should have the power to break through the lower edge of the base channel. The middle of minor wave 3 would not yet have passed for this wave count because price remains within the base channel.
Within the middle of the third wave, micro wave 4 may not move into micro wave 1 price territory above 2,119.36.
TECHNICAL ANALYSIS
WEEKLY CHART
Click chart to enlarge. Chart courtesy of StockCharts.com.
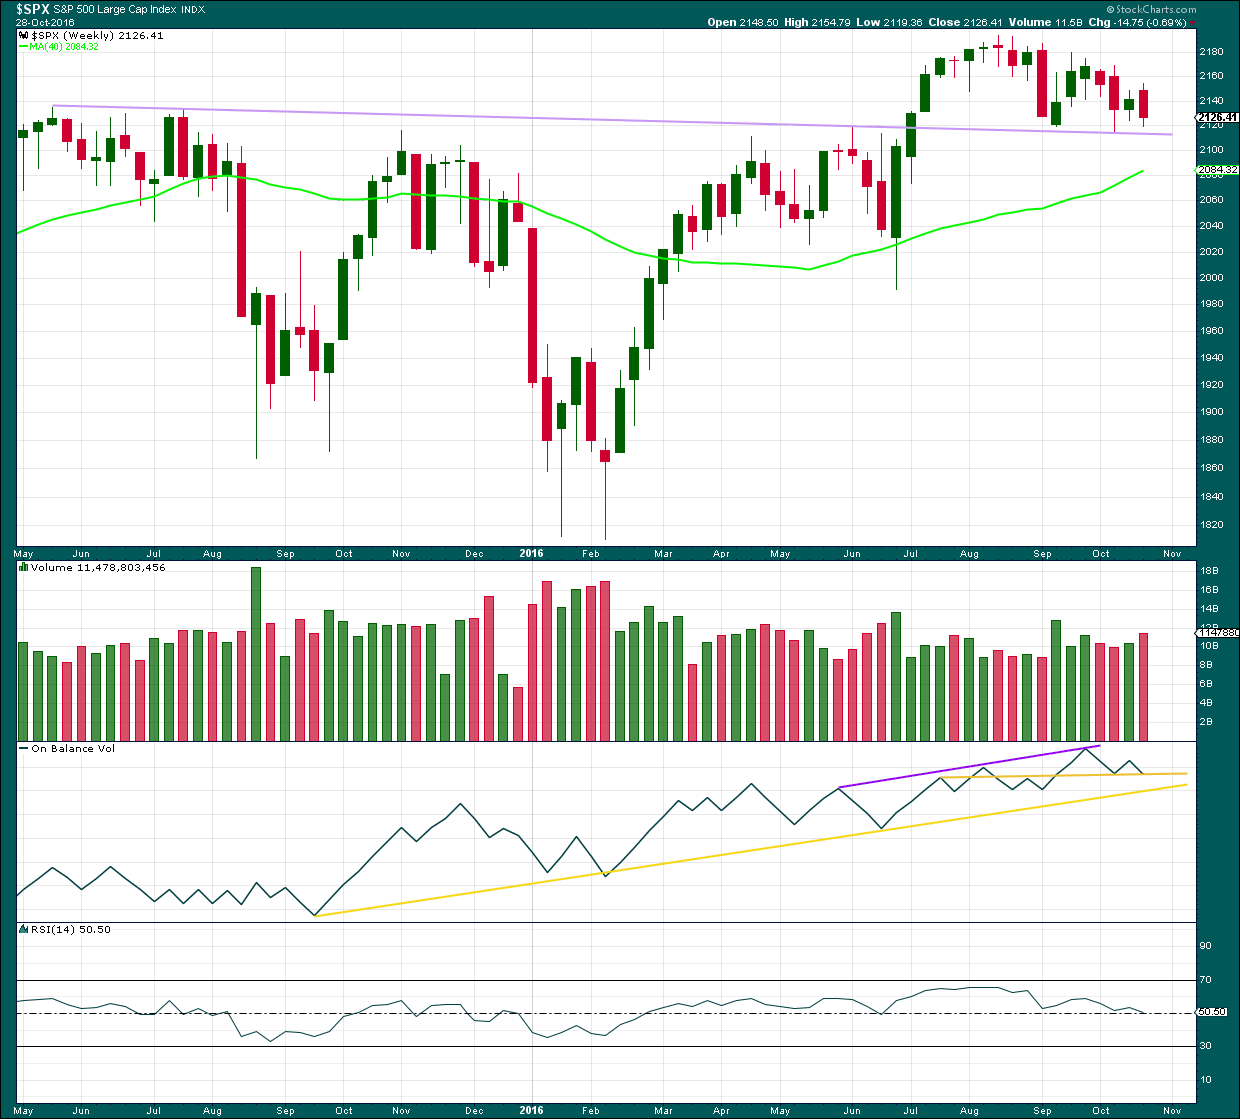
The lilac trend line has strong technical significance. Price broke through resistance, turned down to test support for the first time, and then moved up and away from this line. It was reasonable to conclude that a new all time high is a likely consequence of this typical behaviour.
Now price has come back down for a third test of the lilac trend line. A break below this line is a highly significant bearish signal.
Last downwards week closes red and has support from volume. Increased volume last week is bearish.
At the weekly chart level, On Balance Volume may find support here at the horizontal yellow trend line, which may halt a further fall in price. This support line on OBV in conjunction with the lilac support line for price are strong indicators that downwards movement is very likely to be over.
RSI is still close to neutral. There is plenty of room for price to rise further.
DAILY CHART
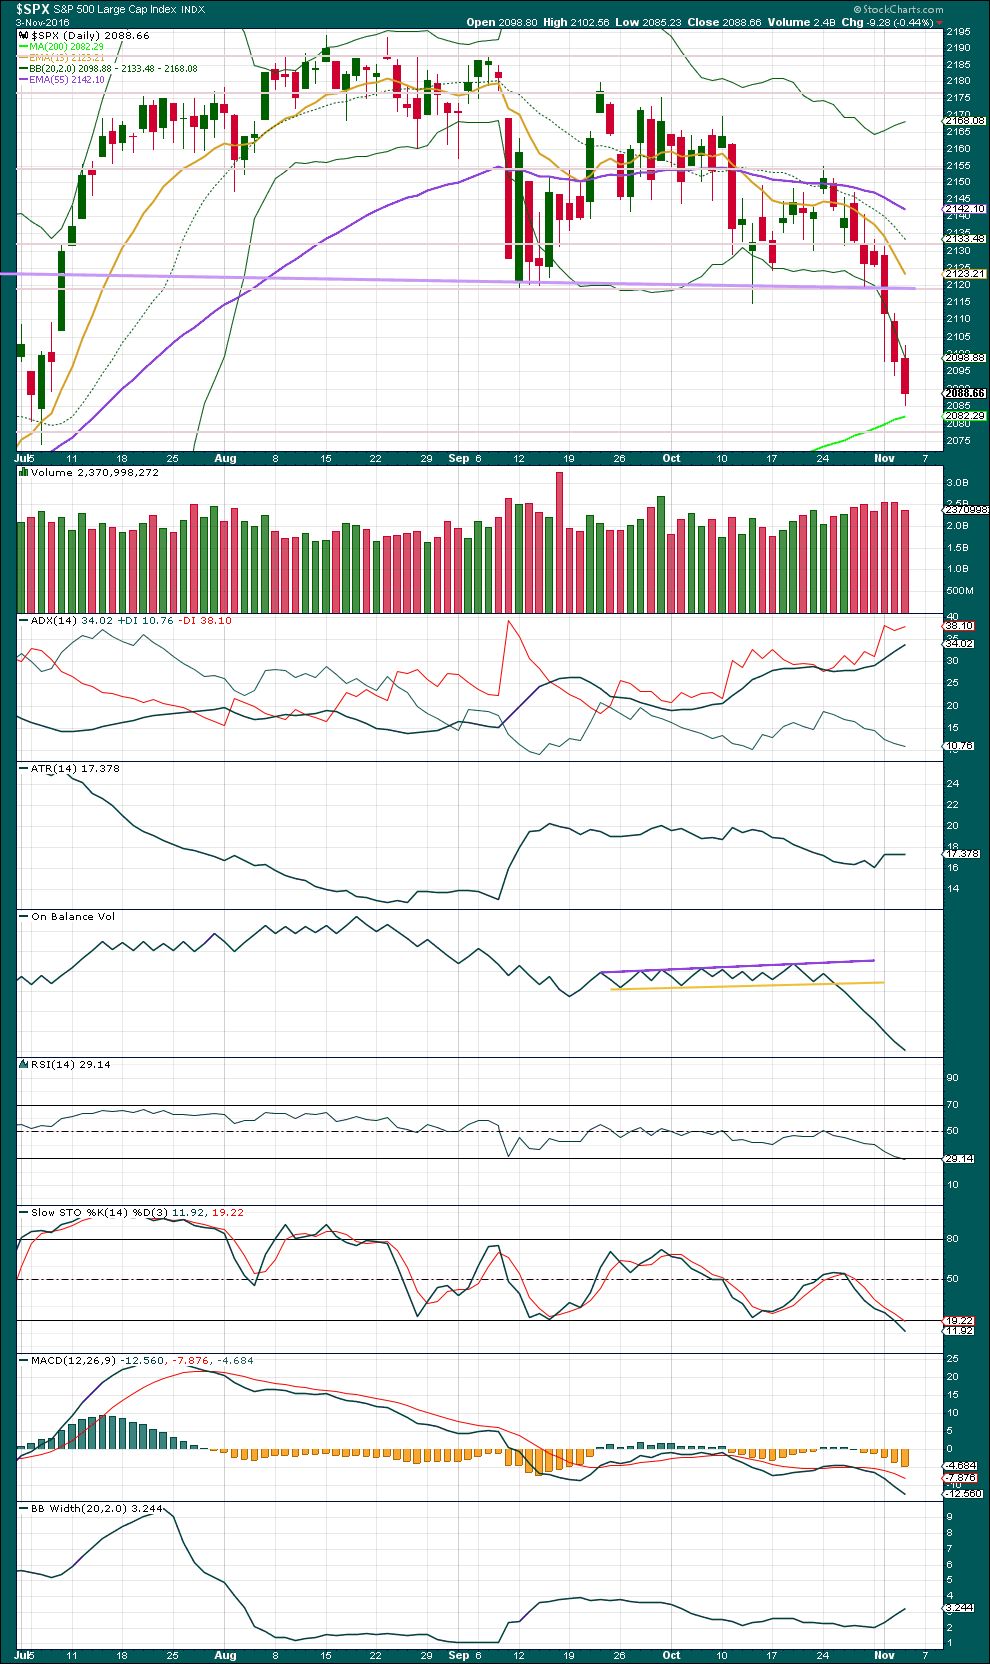
Click chart to enlarge. Chart courtesy of StockCharts.com.
A slight decline in volume today gives a small cause for concern over the main wave count and the target. Volume remains fairly heavy though compared to prior movement.
ADX is still increasing, indicating a downwards trend is in place. It is approaching extreme at 35 though, so this trend may be ready either to end or for an interruption soon. Not quite yet though.
ATR is now flattening off. This too indicates some tiredness, along with the slight decline in volume. Bears are not able to push price down in increasing amounts, so their activity is waning slightly.
Bollinger Bands widened further. This market is still trending downwards.
RSI and Stochastics are now just beginning to move into oversold. Only when they are oversold and then exhibit divergence may an end to this wave down be expected. That is not the case yet.
VOLATILITY – INVERTED VIX CHART
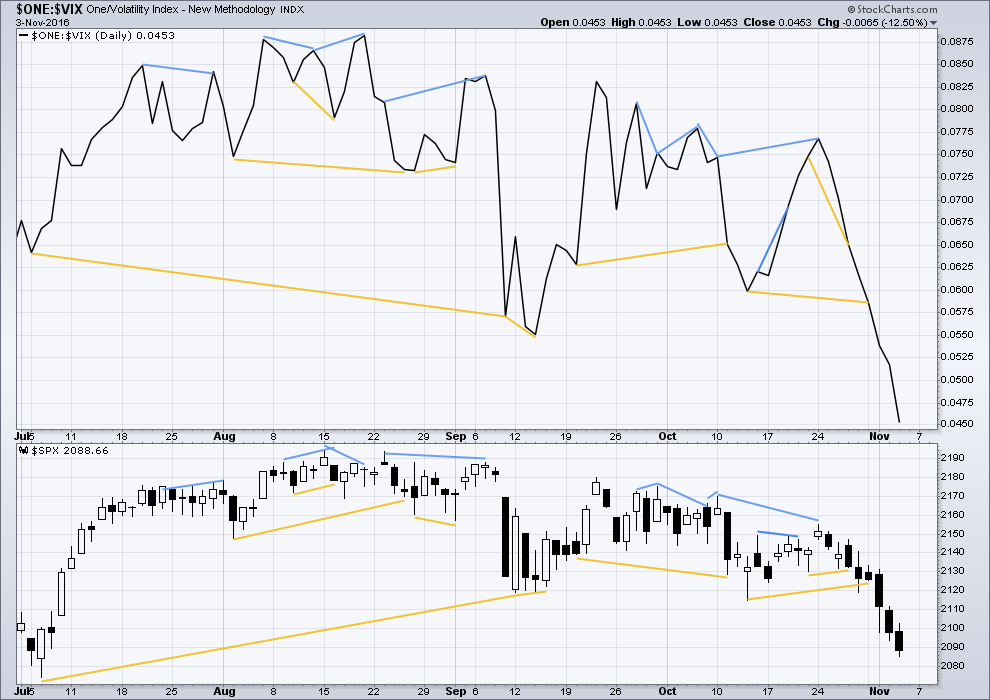
Click chart to enlarge. Chart courtesy of StockCharts.com.
There are a few instances of multi day divergence between price and inverted VIX noted here. Bearish divergence is blue. Bullish divergence is yellow. It appears so far that divergence between inverted VIX and price is again working to indicate short term movements spanning one or two days.
No new divergence is noted today.
BREADTH – AD LINE
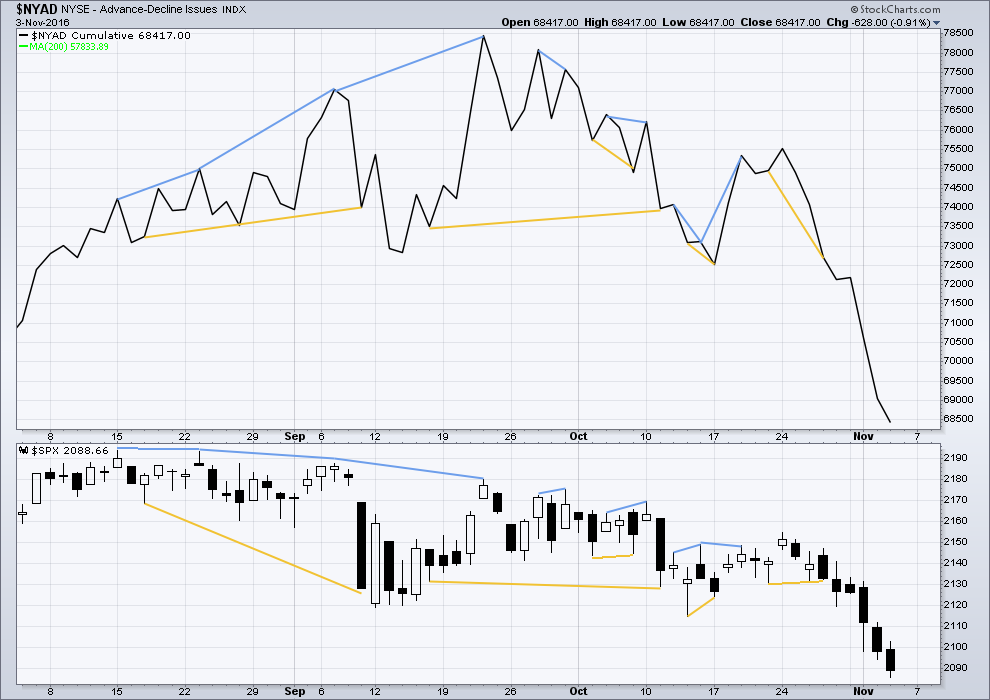
Click chart to enlarge. Chart courtesy of StockCharts.com.
Short term bullish and bearish divergence is again working between price and the AD line to show the direction for the following one or two days.
No new short term divergence is noted today.
BREADTH – MCCLELLAN OSCILLATOR
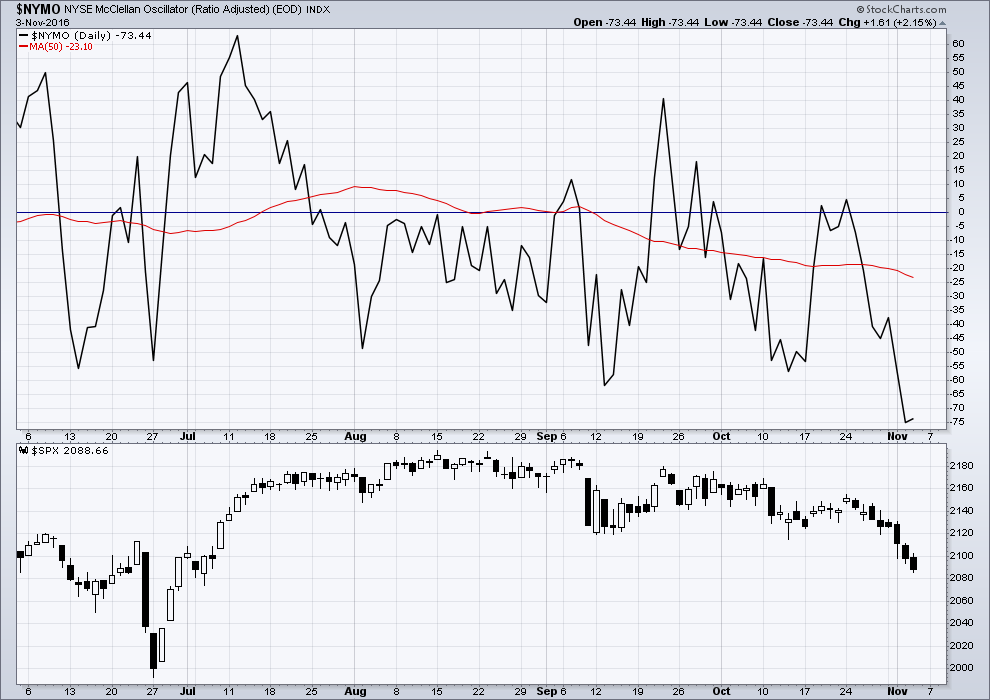
Click chart to enlarge. Chart courtesy of StockCharts.com.
The McClellan Oscillator is now extreme (below 60). On its own this is not an indicator of a low, but it is a warning that this market is oversold. The McClellan Oscillator today is at -73.44.
On the 21st August, 2015, the McClellan Oscillator reached a similar point of -71.56. Price found a low the next session, 104 points below the closing price of the 21st August. This very extreme reading for the 24th August would have been a strong indicator of a low in place.
On the 11th December, 2015, the McClellan Oscillator reached -80.82. It moved lower the next session to -92.65 and price moved 19 points lower. The extreme reading of 11th December might possibly have led to an expectation of a bigger bounce than the one that occurred, and might have misled analysis into missing the strong fall from 29th December to 20th of January.
The next most recent occasion where this oscillator was extreme was the 8th January, 2016. It reached -66.25 on that date. The low was not found for seven sessions though, on the 20th January 2016, almost 110 points below the closing price of the 8th January. At the low of the 11th February, there was strong bullish divergence with price making new lows and the oscillator making substantially higher lows. This may have been a strong warning of a major low in place.
As an indicator of a low this is not it. It is a warning of extreme levels. The next thing to look for would be some divergence with price and this oscillator at lows. Divergence is not always seen at lows, but when it is seen it should be taken seriously. Any reading over 100 should also be taken very seriously.
This indicator will be approached with caution. It is one more piece of evidence to take into account.
At this stage, the extreme reading gives a warning of an end close but not necessarily here. Market breadth declines as price falls supporting the fall in price.
DOW THEORY
Major lows within the old bull market:
DJIA: 15,855.12 (15th October, 2014) – closed below on 25th August, 2015.
DJT: 7,700.49 (12th October, 2014) – closed below on 24th August, 2015.
S&P500: 1,821.61 (15th October, 2014) – has not closed below this point yet.
Nasdaq: 4,117.84 (15th October, 2014) – has not closed below this point yet.
Major highs within the bear market from November 2014:
DJIA: 17,977.85 (4th November, 2015) – closed above on 18th April, 2016.
DJT: 8,358.20 (20th November, 2015) – has not closed above this point yet.
S&P500: 2,116.48 (3rd November, 2015) – closed above this point on 8th June, 2016.
Nasdaq: 5,176.77 (2nd December, 2015) – closed above this point on 1st August, 2016.
Dow Theory Conclusion: Original Dow Theory still sees price in a bear market because the transportations have failed to confirm an end to that bear market. Modified Dow Theory (adding S&P and Nasdaq) has failed still to confirm an end to the old bull market, modified Dow Theory sees price still in a bull market.
It is noted today that while the S&P500, DJI and Nasdaq are all falling, DJT is not. This is not part of Dow Theory, but divergent behaviour between DJT and the other indices is a cause for concern regarding this downwards trend for the S&P500.
This analysis is published @ 09:53 p.m. EST.
Good luck USA on Tuesday.
I’ll leave you with this. Scarily… kinda accurate.
I am more than ever convinced that there are some very serious hidden dangers in this market. I have previously commented on the strange disconnect between the levels we are seeing in VIX and index prices. Nine days of consecutive decline is the most in over thirty years. The last time we had eight consecutive days of decline was in October of 2008 and stocks lost 23% over those eight days. By comparison, stocks have only lost a paltry 2.9% during these nine days of decline, and not a single one of these days saw a decline in excess of 1%. I am glad I did a bit of digging. My sense of unease was not previously bolstered by hard numbers but thanks to Stansberry Research now it is. The media propaganda about the divergence between VIX and price being due to “hedging is pure BS. There is likely billions of bankster dollars being pumped into the markets in an attempt to hide the fact that we may be in the middle of, or possibly at the onset of a complete market meltdown. I am going to 100% cash at the open on Monday. I hope I can do so before the crowd figures out what is going on, and what could be about to unfold. Take care!
Thanks for this comment Verne.
I agree, it’s weird.
Look out to the downside folks. If that alternate wave count is correct, we could be about to head into total meltdown. This is a possibility.
Most welcome Laura.
If there was ever a situation that debunked the theory of “efficient markets”, we are now in one. I am absolutely dumbfounded by the complete black-out in the newsmedia of some of the horrifying discoveries by law enforcement officials in the NYPD investigating Weiner. Unless one follows alternative news outlets, one would be completely in the dark. None of these things are being so much as hinted at by a single news program I have watched in the last several days. Oh, they know about what is coming; absolutely no doubt in my mind. They are simply determined to keep the public at large blissfully unaware; at least until after next Tuesday.
Even as I am writing this the lights suddenly went on!
I was about to day doesn’t Mr. Market know what is coming? Why, for the love of God are we still trading so close to all-time-highs??
Then it hit me. Mr. Market DOES know, and he has been telling us that he does by what has been going on with the VIX!!!
I am not sure if they can keep these things under wraps until after the election on Tuesday. At some point the sleepy general public is going to get wind of what is going on. It is absolutely mind-blowing that they have been able to keep index prices elevated during these last few weeks. NYPD made these discoveries back on October 3rd. Some of you on the forum who follow alternative media know exactly what I am talking about.
Here is the bottom line. All my years of experience watching volatility would lead me to conclude that the extreme divergence we are now seeing between VIX and price necessarily means that VIX must shortly return to the mean to resolve the extremity. In the vast majority of cases I have seen, that is how this sort of divergence is resolved, reliably signaled by upper BB penetration. We got a big hint something different was going on by its failure to spike, and instead remain pinned close to the upper BB the last several days. If you think about it, there is indeed another way the divergence can be resolved. Exactly! A dramatic change in price!
Caveat Emptor!
By the way, NYPD informed Comey that he either re-open the investigation based on the information they provided him on the 3rd of October or they would hold a press conference and inform the public. They have copies of the files they gave to the FBI so unless they fire the entire NYPD there is no way they are going to cover this up. Apparently the trail of corruption leads to several prominent politicians, in both parties. The DOJ threatened NYPD and has been working over-time to keep the entire situation out of the public domain. While some politicians are squealing like stuck pigs for Comey’s departure, they are ignoring the fact that the man put in charge of the new investigation at the FBI is a Clinton puppet. As I said, the cat’s out of the back and NYPD has drawn a line in the sand. It’s going to be interesting to see what extremes (possibly a false flag?) they go to to try and keep everyone distracted. Strange times indeed!
Very cagey action into the close. We either get a big ramp up next week to start the year end rally, or one final wave down to complete the correction. I hope everyone has a wonderful and restful week-end! 🙂 🙂
As to this election on Tuesday November 8th, I expect price is going to move very fast.
My job will be to give you a main count with probability based on classic TA, and alternates. I’ll use confirmation / invalidation points to indicate which direction price will move in.
I’ll be trying to give some trading advice for those who are game enough to try and profit from the price shock that is likely.
For those of us who are more risk averse we should be out of the market during that time.
Updated hourly chart.
My only concern / question is what degree is this fourth wave? Is it minuette (iv) as I have labelled, or is it minute iv one degree higher?
It’s important, because it tells how much more downside potential there is.
At the hourly chart level I’m not seeing weakness yet at the last low.
The pink channel should be useful for us. When that is clearly breached by upwards movement then it’s fairly likely downwards movement is over.
Looks like we are going to get the final wave down starting before the close….
That seems to be the pattern lately.
Loaded the rest of my volatility short positions at the VIX high this morning but I do not think we have a lasting bottom. I will probably be exiting some of those short positions today to reduce exposure, and most of the remaining positions on Monday. I plan to be mostly on the sidelines pending the election outcome. Things could get quite interesting.
Looks like we are in some kind of 4th wave bounce…not quite a capitulation spike in VIX so far….
I am with you on this. 4th wave on the daily chart means we are getting close. At up 9 points, SPX is back inside it’s lower BB. VIX not so yet. SPX has bounced right off the the 200 MA that Vern mentioned earlier this week.
We may retrace to the underside of the descending triangle. What happens after will give us the clue as to if we have seen the bottom. If we go right through and above 2154, chances are the bottom is in. If we touch the line at ~2120 and come down, chances are we will tag the 200 day MA at least and possibly more.
Hourly MACD on SPX has turned up. 4 hour appears it will do so soon. Daily MACD on SPX will likely follow if 4 hour makes the cross over and turns up.
vernecarty,
I am new to options trading and have been watching your posts for some time and am interested in some of the tools you use to trade. Can you explain to me how you use the VIX in your trading?
A very difficult question but I will try to give it to you in a nutshell. It is difficult because if I were to try and outline everything that goes into my thinking (based on long experience watching it) about volatility I suspect it would be more confusing than clear. The simplest way, in my opinion to use volatility (trading its various instruments) is to buy it when it’s cheap, and sell it when it is expensive.
How do you know when it is cheap?
A few things I look for are new 52 week lows, and also lower BB penetration.
Conversely, upper BB penetrations can be a useful signal that it has become expensive. Rodney’s comment below is right on the money so far as trade triggers go.
So far as the markets go, of course you want to be cautious or short the market when VIX is at an extreme low, and long the market when it is at an extreme high. Hope that helps a bit.
I think that helps a lot Verne. As clear an explanation I think as could be had.
Thanks Lara for the additional coverage of the MCCLELLAN OSCILLATOR. I find this to be quite useful. Your commentary is helpful. Thanks again.
I am looking for VIX and SPX to close inside of their BBs for the next clue to a bottom. That must be followed by a second day of movement lower for VIX and higher for SPX. That often (with good reliability) signals a bottom.
No worries Rodney. McClellan is one of the better breadth indicators.
And when Verne comments that something should be watched, I take it very seriously 🙂 He knows his stuff.
Awww…Shucks! 🙂
I would have expected a third wave down at multiple degrees to show up at some point in overnight futures. I am thinking the probability of the alternate would be greatly enhanced were we to see something of the sort, but so far no cigar. Perhaps we will see an increase in downside momentum with the fifth wave but VIX suggesting this move down is just about done…