
Yesterday’s main and alternate Elliott wave counts expected more downwards movement. This is what happened.
The target for the main Elliott wave count remains the same.
Summary: A green daily candlestick or a doji may unfold tomorrow as a fourth wave correction ends. Thereafter, more downwards movement would be expected. The target remains the same at 2,089.
Last monthly chart for the main wave count is here.
Last weekly chart is here.
New updates to this analysis are in bold.
MAIN WAVE COUNT
DAILY CHART
Click chart to enlarge.
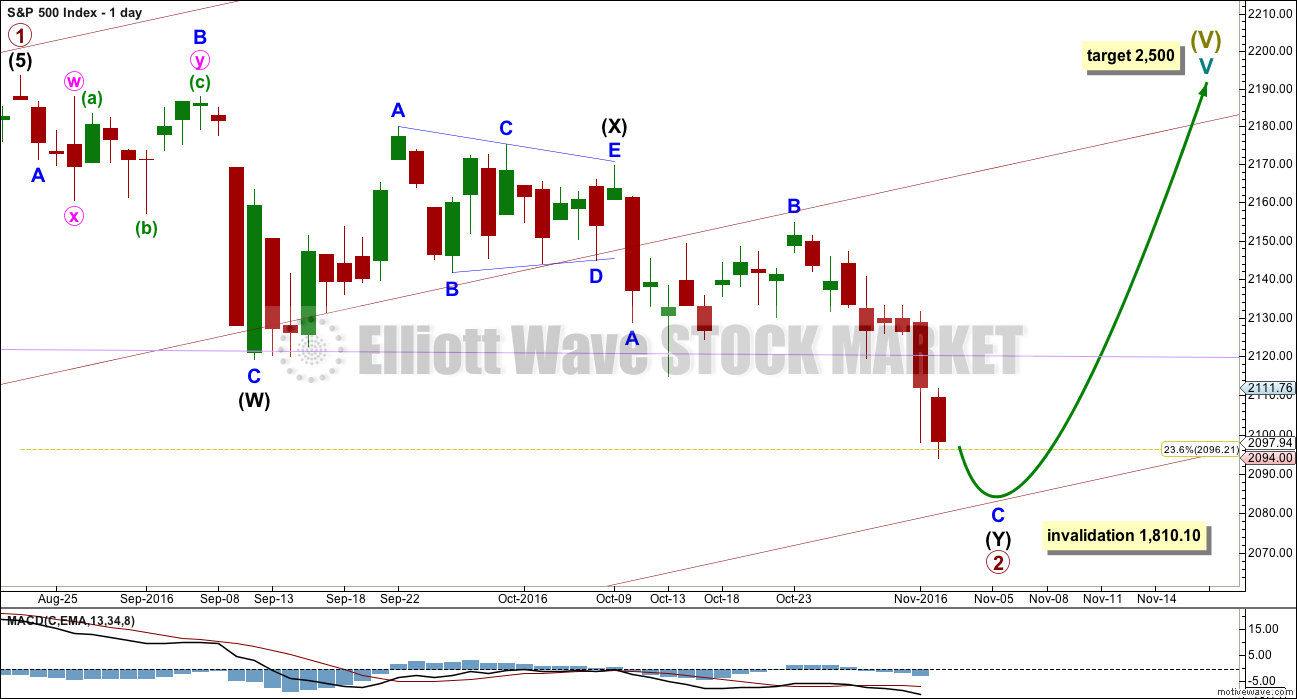
At this stage, primary wave 2 now has a completed zigzag downwards that did not reach the 0.236 Fibonacci ratio. It is very unlikely for this wave count that primary wave 2 is over there; the correction is too brief and shallow. Upwards movement labelled intermediate wave (X) is so far less than 0.9 the length of the prior wave down labelled intermediate wave (W). The minimum for a flat correction has not been met. Primary wave 2 may continue lower as a double zigzag. A second zigzag in the double may be required to deepen the correction.
Intermediate wave (W) lasted a Fibonacci 13 sessions. Intermediate wave (X) is a complete triangle. X waves may subdivide as any corrective structure (including multiples), and a triangle is possible here.
So far intermediate wave (Y) has lasted 18 sessions. If it exhibits a Fibonacci duration, then it may end in another two sessions to total a Fibonacci 21, or another 16 sessions to total a Fibonacci 34.
Primary wave 2 may not move beyond the start of primary wave 1 below 1,810.10. A new low below this point would see the degree of labelling within cycle wave V moved up one degree. At that stage, a trend change at Super Cycle degree would be expected and a new bear market to span several years would be confirmed. A new alternate wave count below outlines this possibility.
HOURLY CHART
Click chart to enlarge.
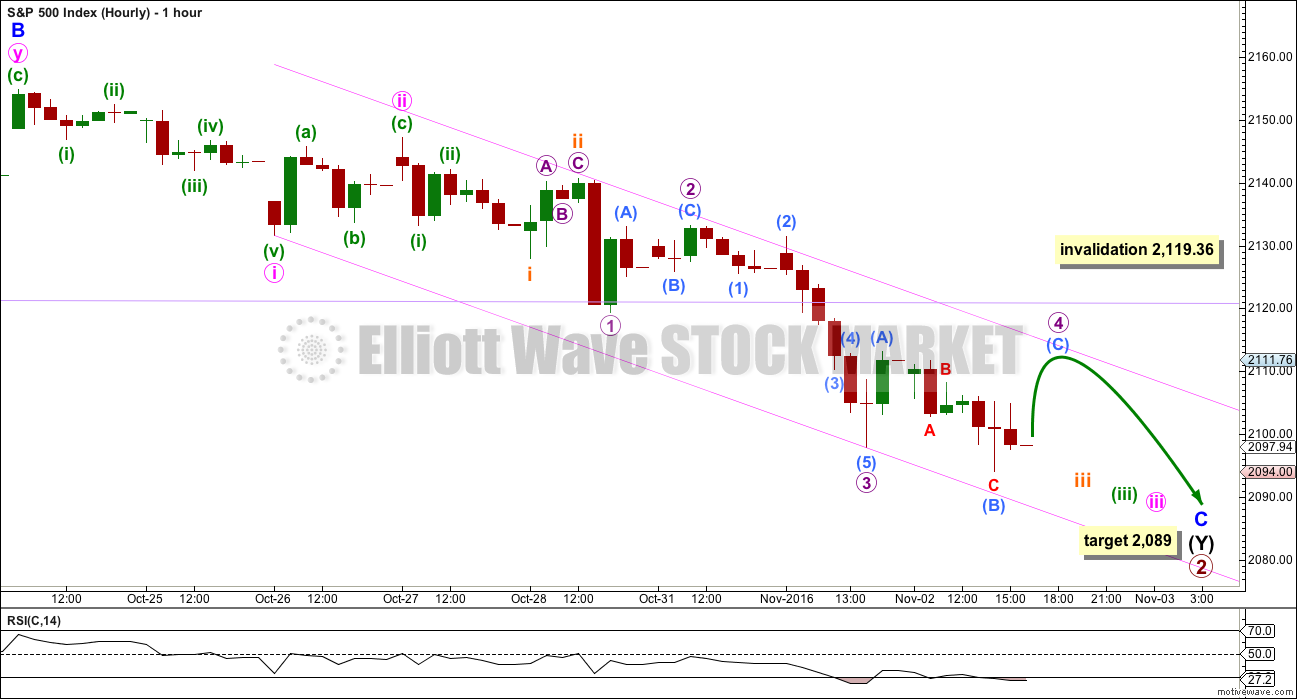
At 2,089 minor wave C would reach 1.618 the length of minor wave A. This would take intermediate wave (Y) somewhat below the end of intermediate wave (W), achieving its purpose of deepening the correction.
The strong downwards movement for Tuesday’s session fits as the middle of a third wave. Price may now move through a series of small fourth wave corrections and fifth waves down to complete the whole structure of minor wave C.
Micro wave 3 is just 0.83 points longer than 1.618 the length of micro wave 1.
Micro wave 4 may not move into micro wave 1 price territory above 2,119.36.
Downwards movement for Wednesday’s session fits as a 5-3-5. This may be two first and second waves within micro wave 5, or it may be a zigzag down within micro wave 4. For this reason the invalidation point is left at the low of micro wave 1. It is entirely possible that micro wave 4 may not be over and may move higher tomorrow to produce a green daily candlestick.
At the low for today, there is some weakness indicated by RSI moving into oversold and now showing divergence with price. This may be followed by a bounce tomorrow. If micro wave 4 moves up tomorrow to complete a flat correction, then submicro wave (C) would be very likely to make at least a slight new high above the end of submicro wave (A) at 2,108.73 to avoid a truncation. If micro wave 4 continues as a triangle or combination, then a new high above 2,108.73 may not happen.
Downwards movement should continue thereafter, so that the structure of minor wave C is a complete five wave impulse.
ALTERNATE WAVE COUNT
DAILY CHART
Click chart to enlarge.
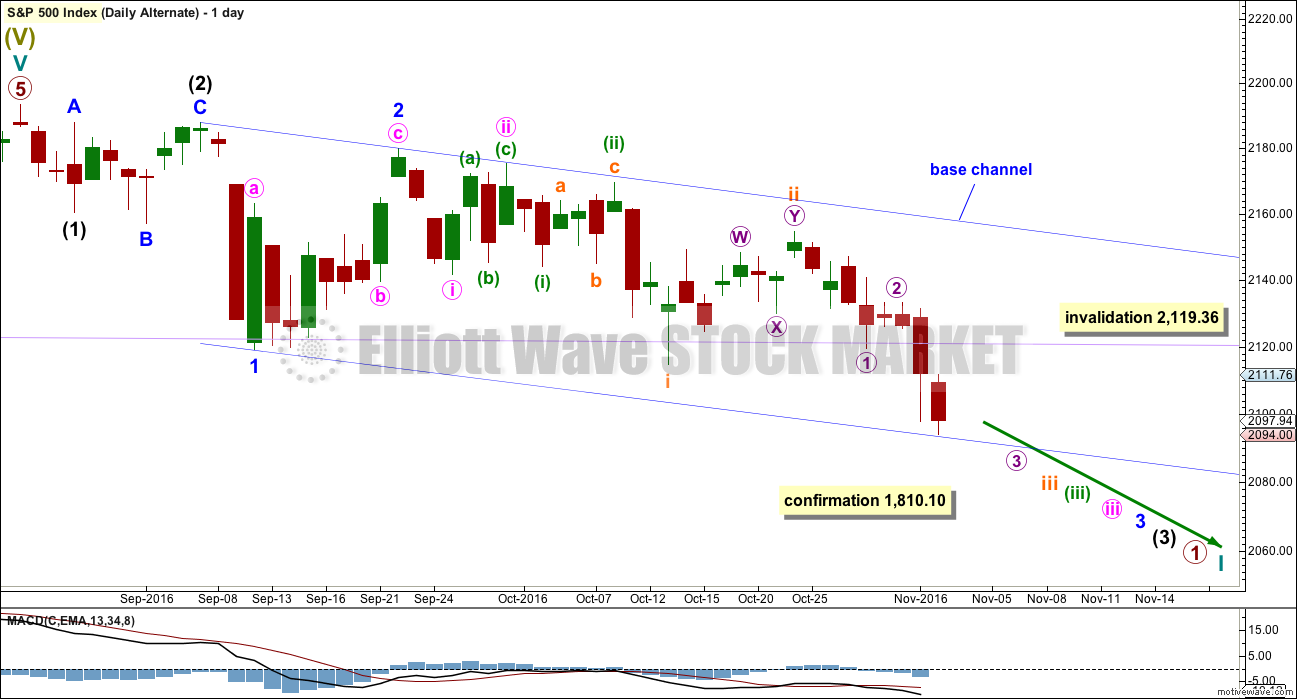
At this stage, a deeper pullback has been indicated by price for the main wave count. What if this downwards movement is the start of something even bigger?
This wave count expects that a new bear market to span several years and take price substantially below 666.76 has begun. For such a huge call it absolutely requires price confirmation below 1,810.10.
If a new bear market has begun, then the degree of labelling within the last impulse upwards is simply moved up one degree.
Downwards movement from the all time high may be a series of overlapping first and second waves. What looks like an obvious triangle must be ignored for this wave count. This is problematic, and it reduces the probability of this wave count. But this is a viable wave count.
The dark blue channel is a base channel about minor waves 1 and 2. Minor wave 3 should have the power to break through the lower edge of the base channel. The middle of minor wave 3 would not yet have passed for this wave count because price remains within the base channel.
Within the middle of the third wave, micro wave 4 may not move into micro wave 1 price territory above 2,119.36.
TECHNICAL ANALYSIS
WEEKLY CHART
Click chart to enlarge. Chart courtesy of StockCharts.com.
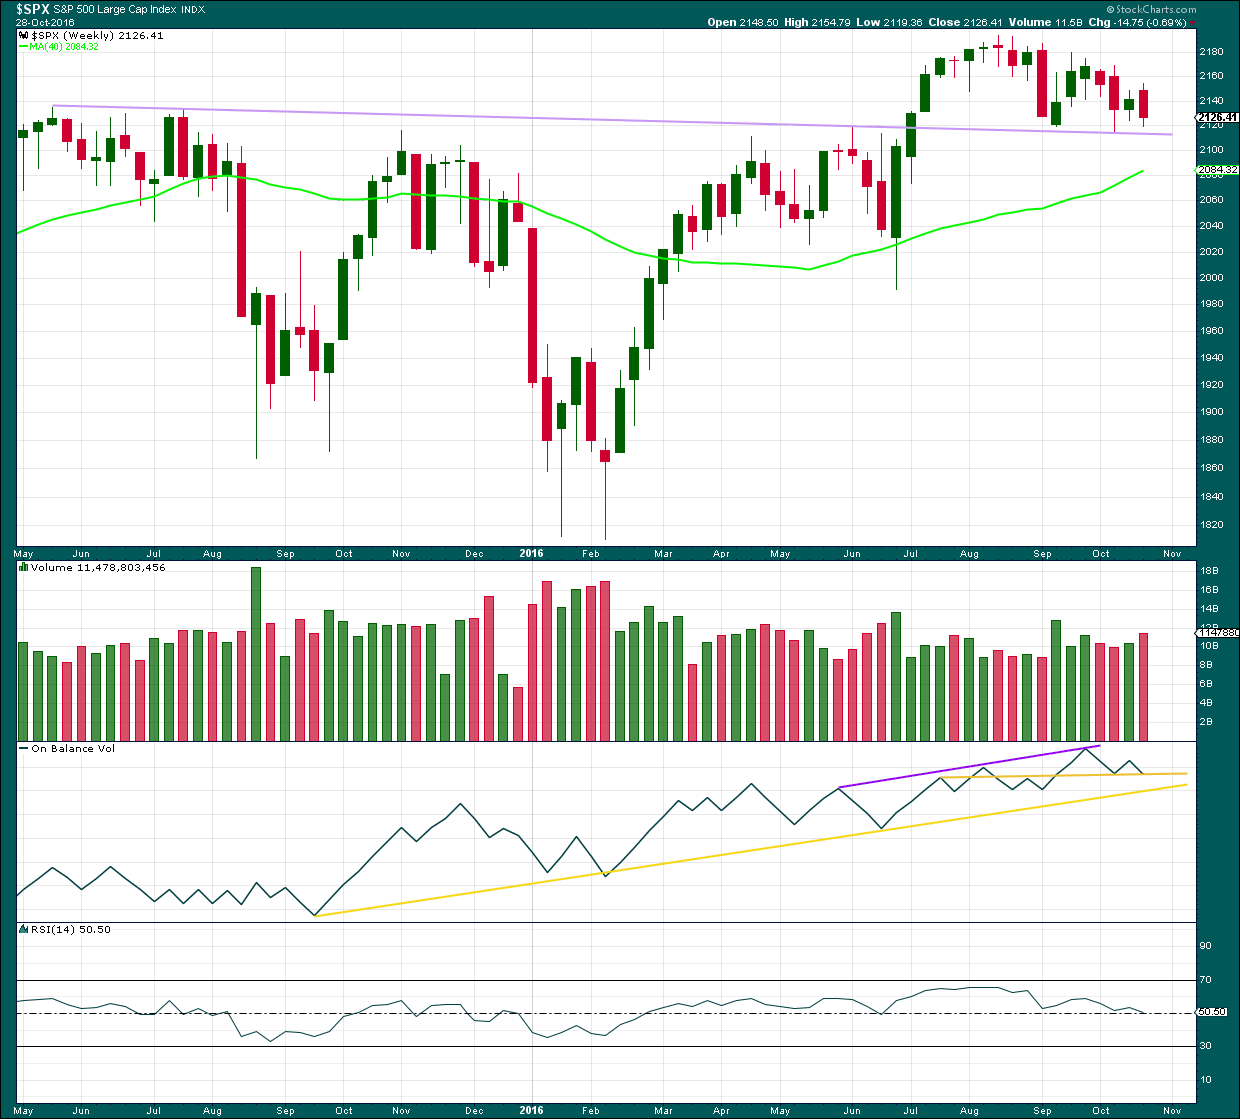
The lilac trend line has strong technical significance. Price broke through resistance, turned down to test support for the first time, and then moved up and away from this line. It was reasonable to conclude that a new all time high is a likely consequence of this typical behaviour.
Now price has come back down for a third test of the lilac trend line. A break below this line is a highly significant bearish signal.
Last downwards week closes red and has support from volume. Increased volume last week is bearish.
At the weekly chart level, On Balance Volume may find support here at the horizontal yellow trend line, which may halt a further fall in price. This support line on OBV in conjunction with the lilac support line for price are strong indicators that downwards movement is very likely to be over.
RSI is still close to neutral. There is plenty of room for price to rise further.
DAILY CHART
Click chart to enlarge. Chart courtesy of StockCharts.com.
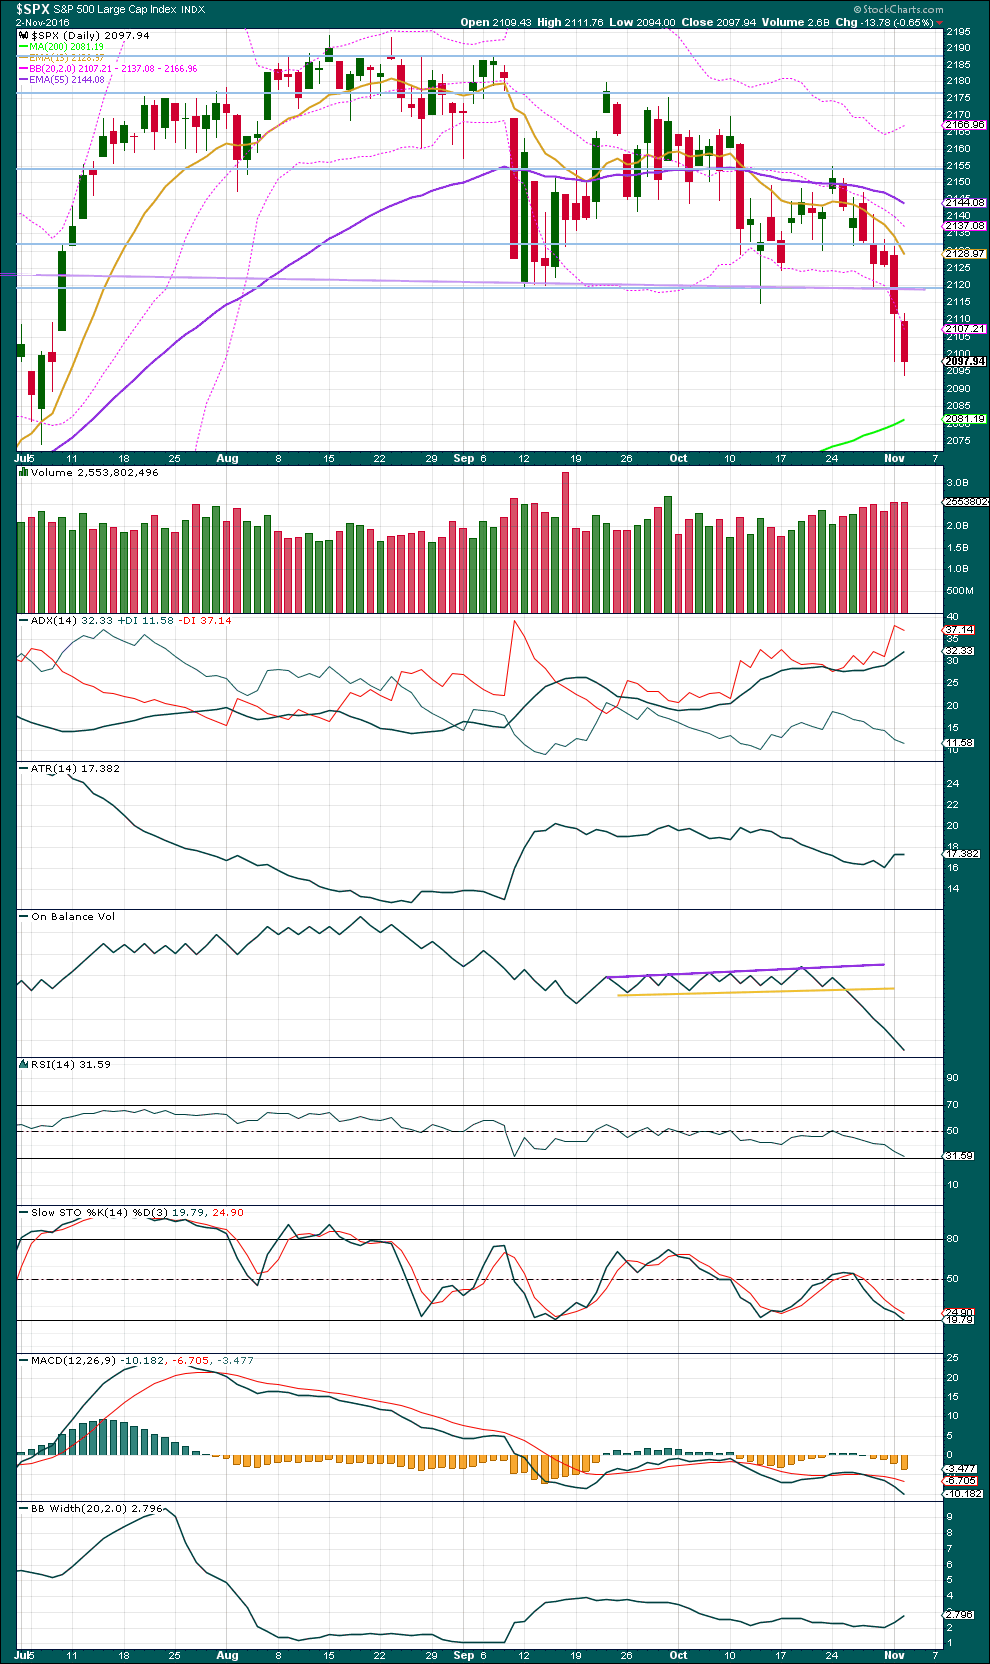
Price has moved lower overall now for five days. Today saw a further increase in volume although the increase was small. With volume rising as price falls, the fall is supported by more active selling.
ADX indicates a downwards trend is in place. ATR may be beginning to agree as it may be showing some increase. Bollinger Bands are widening. With all three of these indicators mostly in agreement, it may be assumed that a downwards trend is currently in place.
On Balance Volume continues to be very bearish.
RSI is not yet extreme at the daily chart level. There is still a little room for price to fall before a bounce may be expected.
Stochastics is not yet extreme.
MACD indicates a downwards trend with momentum.
VOLATILITY – INVERTED VIX CHART
Click chart to enlarge. Chart courtesy of StockCharts.com.
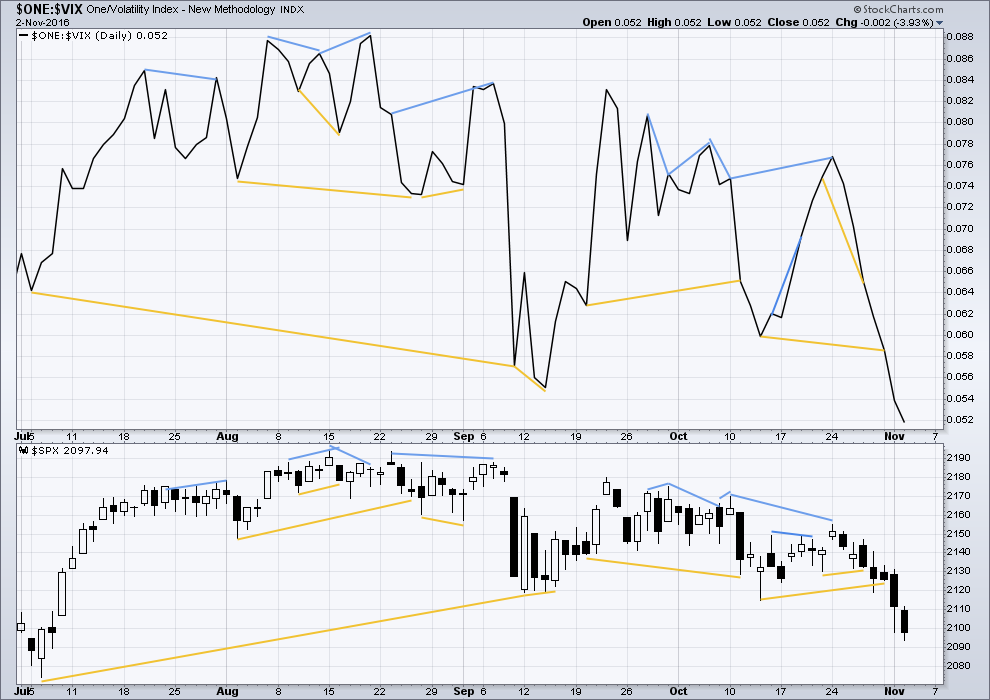
There are a few instances of multi day divergence between price and inverted VIX noted here. Bearish divergence is blue. Bullish divergence is yellow. It appears so far that divergence between inverted VIX and price is again working to indicate short term movements spanning one or two days.
No new divergence is noted today.
BREADTH – AD LINE
Click chart to enlarge. Chart courtesy of StockCharts.com.
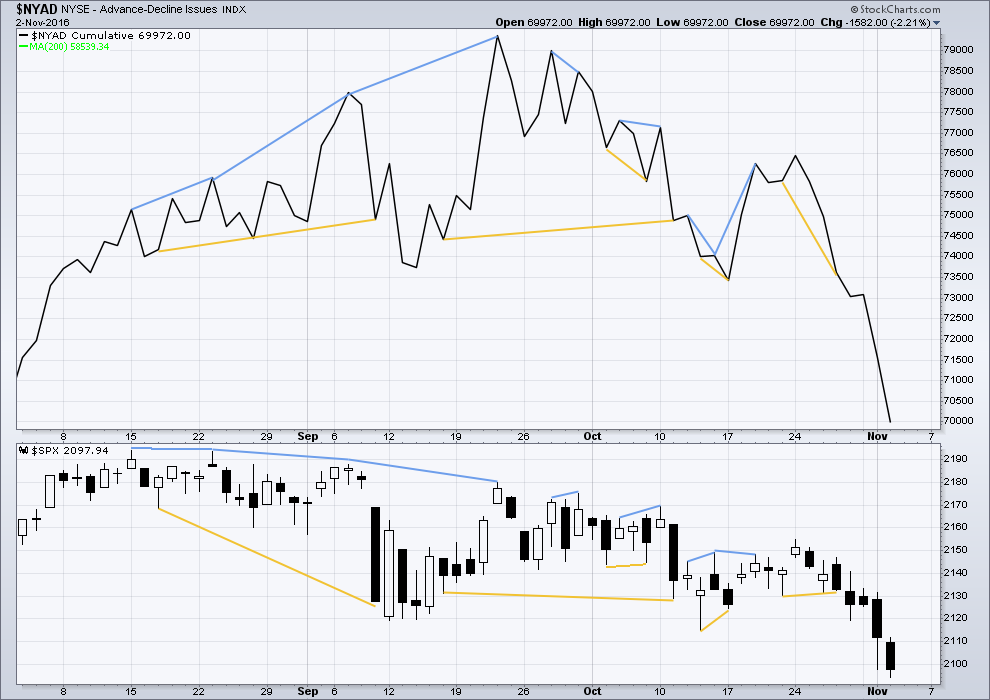
Short term bullish and bearish divergence is again working between price and the AD line to show the direction for the following one or two days.
No new short term divergence is noted today.
DOW THEORY
Major lows within the old bull market:
DJIA: 15,855.12 (15th October, 2014) – closed below on 25th August, 2015.
DJT: 7,700.49 (12th October, 2014) – closed below on 24th August, 2015.
S&P500: 1,821.61 (15th October, 2014) – has not closed below this point yet.
Nasdaq: 4,117.84 (15th October, 2014) – has not closed below this point yet.
Major highs within the bear market from November 2014:
DJIA: 17,977.85 (4th November, 2015) – closed above on 18th April, 2016.
DJT: 8,358.20 (20th November, 2015) – has not closed above this point yet.
S&P500: 2,116.48 (3rd November, 2015) – closed above this point on 8th June, 2016.
Nasdaq: 5,176.77 (2nd December, 2015) – closed above this point on 1st August, 2016.
Dow Theory Conclusion: Original Dow Theory still sees price in a bear market because the transportations have failed to confirm an end to that bear market. Modified Dow Theory (adding S&P and Nasdaq) has failed still to confirm an end to the old bull market, modified Dow Theory sees price still in a bull market.
This analysis is published @ 11:39 p.m. EST.
I have to say I am pleasantly surprised. Bloomberg finally had a guest on who called out the notion that Trump is responsible for the market decline as “utter nonsense”. Of course we know that so many so-called news networks today are anything but…
A close above SPX 2102.56 prints a bullish engulfing candlestick…probably even better that a hammer as a reversal signal…
I could be wrong about an interim bottom being in. Every time I have ignored UVXY BB price action in deference to other TA considerations I end up being wrong. A reclaim of DJI 18,000.00 and SPX 2100.00 by the close would in my opinion suggest that we have already started, at the very least, a near term bounce.
I wonder if the indices are going to act like commodities on this decline with the greatest momentum coming on the fifth wave down. I am just not feeling this primary wave decline – way too timid imo….despite the run-up in VIX we are still in spitting distance of the round numbers. Most peculiar….
SPX just at about 200 dma. DJI still about 100 points away so we will probably see at least some kind of pause soon…
True to form – prop it up all day, let it sink at night. Taking profits on more short positions. Adding to short volatility positions, now at 3/4 full quota.
Slowing down…. no green candlestick today. Micro 4 was over already. Darn it. That’s how I labelled it first, but then changed it after looking at the 5 minute chart.
Keep redrawing the pink channel, its an acceleration channel about minor C. Price seems to be finding resistance about the mid line.
This structure still looks incomplete. The target now looks too high. Next target would be the 0.382 Fibonacci ratio of primary 1 at 2,038.
Are you going to change the target of C, (Y), 2 on the chart? 2038 falls right into my descending triangle approximation target of 2046.
Yes, I’ll be changing that today.
There’s not enough room for the last three fifth waves with the target at 2,089.
I suspect minor C may not exhibit a ratio to minor A. P2 may end about the 0.382 Fibonacci ratio instead.
VIX is up 10% and DJI is printing green??!! This is absolutely nuts!!!
Bloomberg is reporting that the climbing VIX is reflecting a lot of hedging activity as opposed to outright selling. Interesting take…
I am starting to suspect that we are going to get a temporary bounce at the 200 dma around 2082.31 with a pullback in the VIX, and then the real final wave down, similar to what we saw in June….
One thing that would explain the kind of divergence we are seeing is focused buying of index heavily weighted components to keep prices aloft, very much in keeping with the kind of subterfuge of central bank attempts at maintaining phantom prices. The problem with this is that with VIX at these levels, that implies some big air pockets in these indices and any unwinding of the concentrated positions, whether forcibly or voluntarily could result in some serious “gappage”. This does not look good… 🙁
I agree Verne. What they’re doing will be detrimental in the long run.
I remember reading about replications of bubbles and effects different interventions had on them, how they burst and how fast price fell. One surprising finding was removing the option to sell short made the situation worse; price fell faster.
I suspect that similarly the market intervention of the last few years may have an unintended consequence of making the resulting collapse worse than it would otherwise have been. Just my opinion of course, no research to back that up.
Certainly the eventual collapse of the current system will come. It looks like soon. But it has looked like soon since the 2000 high. In the current bull run from the 2007 – 2008 low, no one I speak with can believe we are at SPX 2100. But here we are.
We thought Brexit was the big event to cause the big decline. We have been looking for it for years. Yet, the top and eventual collapse has escaped us and all reality. What makes us think tomorrow will be any different? It is not many weeks or months ago where almost all indicators we were following proved unreliable at that time. What makes us think tomorrow will be any different?
The doctor told me yesterday, “The trick here is to remove the growth just before it turns to cancer.” Well, for us in the world equity markets, the trick is to get out just before it collapses. Both goals are easier said than done. I have more confidence in my doctor’s ability to achieve the goal than I do in my ability to exit the markets just before the top while still trying to harvest something from the last leg up.
Agreed. We have been waiting for this for years and years.
1,810.10 is my line in the sand. If this market is going to keep going up, it absolutely has to remain above that point.
Once it makes a new low below 1,810.10 it’s all over.
That would also be a huge breach of the big Elliott channel about super cycle (V)
Although I try not to leave large positions in the market overnight, that does not alleviate the sense of unease I have been experiencing for quite some time now. Rodney the argument you make is exactly one of the things that is kind spooky – the fact that we have been expecting the collapse for so long now and it has simply not happened. I think for many that equates to a confidence that it never will, or at least not just yet… current price agrees with that sanguine view methinks! 🙂
I completely agree. So often while it is impossible to quantify these opinions in a rigorous scientific way, watching price action over the years makes it impossible to not note that something is seriously amiss.
We see a sort of stair stepping downward now. The past few days the decline was steep. But that has lessened somewhat. I am thinking this is associated with completion of a series of 4-5 waves until we complete Intermediate (Y) and Primary 2 on the Main Wave Count.
The descending triangle broke to the downside as I anticipated a couple of days ago. Classic chart patterns would derive a target of 2046 approximately. Will we return to the lower triangle trendline (2111 to 2119 SPX) before we move to 2046? Maybe. Maybe not. We may not even go that deep.
I say this because descending triangles are not a classic topping pattern. They are continuation or consolidation patterns. Therefore, my guess is that this is a false breakout of a descending triangle which will eventually be fully retraced and penetrated to the upside (2200+).
I am also guessing the up move will not begin in earnest until after the US Presidential election.
Finally, my Cubbies did it. What a great day it was for me yesterday.
Sweet vindication. I was practicing my sailor speech when Maddon pulled Hendricks after one lousy walk. But all is well that ends well!
I am looking past that triangle formation to the larger apparent topping process we have been in for the last few months. Something really does not look quite right about the way the market has been declining- it really lacks, at least to me, the kind of impulsive momentum we should be seeing for a primary wave correction; especially with VIX at these levels. I can only conclude that either we are seeing a sea change in the relationship between price and volatility, or the biggest part of the move is yet to come.
Goodness. I had to look up “Cubbies”. Baseball? (not really a NZ thing, we’re more rugby and cricket down here). So glad to hear you’re super happy Rodney 🙂
It is called the WORLD Series. Please forgive the all caps. This accomplishment is 108 years in the coming and deserves to be shouted from the roof tops. Cricket, that is a British game. In America we took a good thing and made it perfect. Baseball is THE American pastime.
Well done to your Cubbies Rodney.
The NZ All Blacks (rugby) are playing in Chicago this Saturday, 5th November at Soldier Field (kick off at 6pm I think). They’re playing Ireland, so pretty sure they’ll whomp them (apologies to any Irish members, but you know it’s true 🙂 )
If it’s not Scottish…It’s….well…..you know! 😉
VIX has now penetrated its upper BB for the fifth straight day and we STILL have not had a meaningful market decline. It is looking to me like the market is going have to fall very hard to bring prices in line with the levels we currently seeing in VIX. I am at a complete loss to comprehend why market price remains this elevated. Something does not smell right about all this- this is extreme divergence, more extreme than I can remember ever seeing….
Banksters?
They’ll be exhausted eventually. When social mood turns and they can no longer hold back fear.
Yep. I get the impression that despite the signals from VIX, the failure of price to confirm is telling me that there is STILL not that much true fear in this market. Hard to believe, but that is exactly what price is telling me….
As must be obvious, I am fascinated with pivots and what they portend for future price action. I think an important one has recently been broken. Kimble has a bit of a different take and thinks SPX is STILL testing what was previously resistance and has yet to violate it. Thoughts?!
Scaled some more VIX – will keep some until election as a hedge
I am 1/4 full on my volatility short positions; waiting for final spike up. Will go 1/2 full if it exceeds 20….
The pattern of price wrangling during regular trading hours and tanking close to the close appears to be continuing….I am still hoping for a signal from futures that will tell us when the final wave down is about to unfold…..
It’s a congestion zone. That would be my take on it. There’s multiple layers of support in there.
I’ll go back over my horizontal support lines on the TA chart again carefully today to try and pinpoint them.
A close below 1,810.10, final support, would be enormously bearish IMO.
The way things are going, I would not be at all surprised to see a massive gap move of some kind…probably down…
The bears need to keep DJI firmly below 18,000.00 and SPX equally firmly below 2110 for the immediate bearish case. A close above those key levels will be the first clue that a bankster ambush is about to be sprung on the bears…
Making the typical move back to test the underside of that long-held support shelf. Next move should be a rapid fall away toward new lows…
Jeff Clark is an analyst with Stansberry Research and one of the most skillful bear market traders I have ever seen. His specialty is trading the “dark side”. Bear markets unfold much more swiftly that bull markets and therefore provide opportunities for gains that are both bigger and faster if one plans carefully. One of his favorite “bread and butter” trades is triggered by the Mcclellan Oscillator that monitors over-bought and over-sold conditions. Readings of over 60 represent extremely overbought conditions, and readings below – 60 represent extremely over-sold conditions. Clark has noticed that oscillators for both NYSE and NASDAQ are about to approach over-sold conditions, now around -57. This has happened three times in the last year – in Decemer, January, and June, and in each case was followed by 4% rallies. Here is the key point though. In each case those rallies were followed by an even more vigorous market sell-off. The upcoming rally might be a good opportunity to cash in your long positions.
Excellent tip Verne, thanks! I think I should add this to the daily analysis
NYSE McClellan Oscillator is today extreme oversold at -73.44
And yes, I note that in each case it was able to move further into extreme and price was able to move lower by quite a lot.
Then a rally… and another hard fall.
Most welcome Lara! 🙂
The banksters bought the European markets out of deep in negative territory, a generally very reliable signal to short the market. I will be adding to my short positions.
I have a question for you Lara,
If we are in a Second wave correction wouldn’t you be expecting a deeper retracement to .618 of wave 1?
often that is the case, yes.
Second waves are commonly deep, but not always. In this case there is strong support at a channel drawn about this whole bull market which began back in 2009; an Elliott channel. See this weekly chart.
For primary 2 to reach 0.618 of primary 1 it would have to substantially breach the channel.
Cycle IV overshoots the channel. An overshoot is okay, a breach is concerning.
P2 may overshoot the channel to reach the 0.382 Fibonacci ratio.
Morning!!
Good morning!