
Upwards movement was expected for a green daily candlestick for Thursday’s session.
The session had a higher high and a higher low, but closed red.
Summary: There is conflicting evidence today from bullish divergence between price and VIX and the AD line, and a strong bearish signal from On Balance Volume trend line break. A new high above 2,147.13 would add confidence to the main wave count. At that stage, the probability of a third wave up would increase. A new low below 2,130.09 would invalidate the main Elliott wave hourly count and confirm the alternate Elliott wave hourly count (with the main daily count). At that stage, expect a third wave down to end slightly below 2,124.43 but not below 2,114.72. Look for support at the lilac trend line.
Last monthly chart for the main wave count is here.
New updates to this analysis are in bold.
MAIN WAVE COUNT
WEEKLY CHART
Click chart to enlarge.
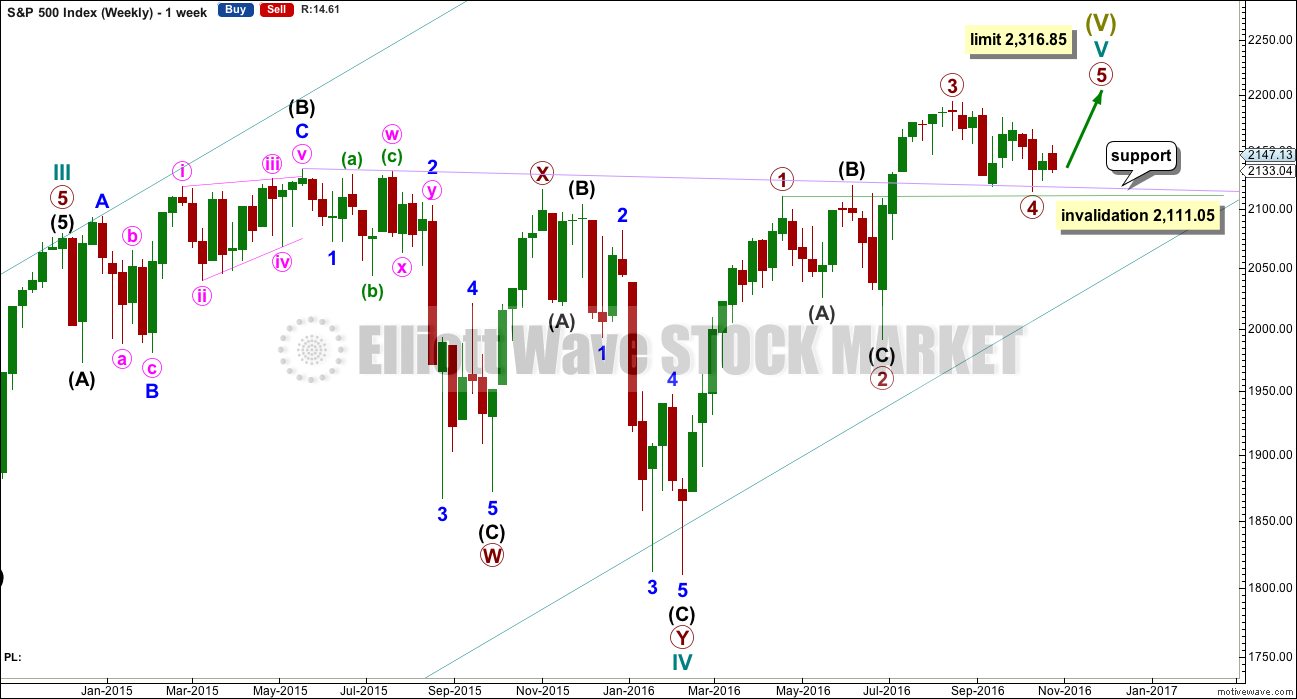
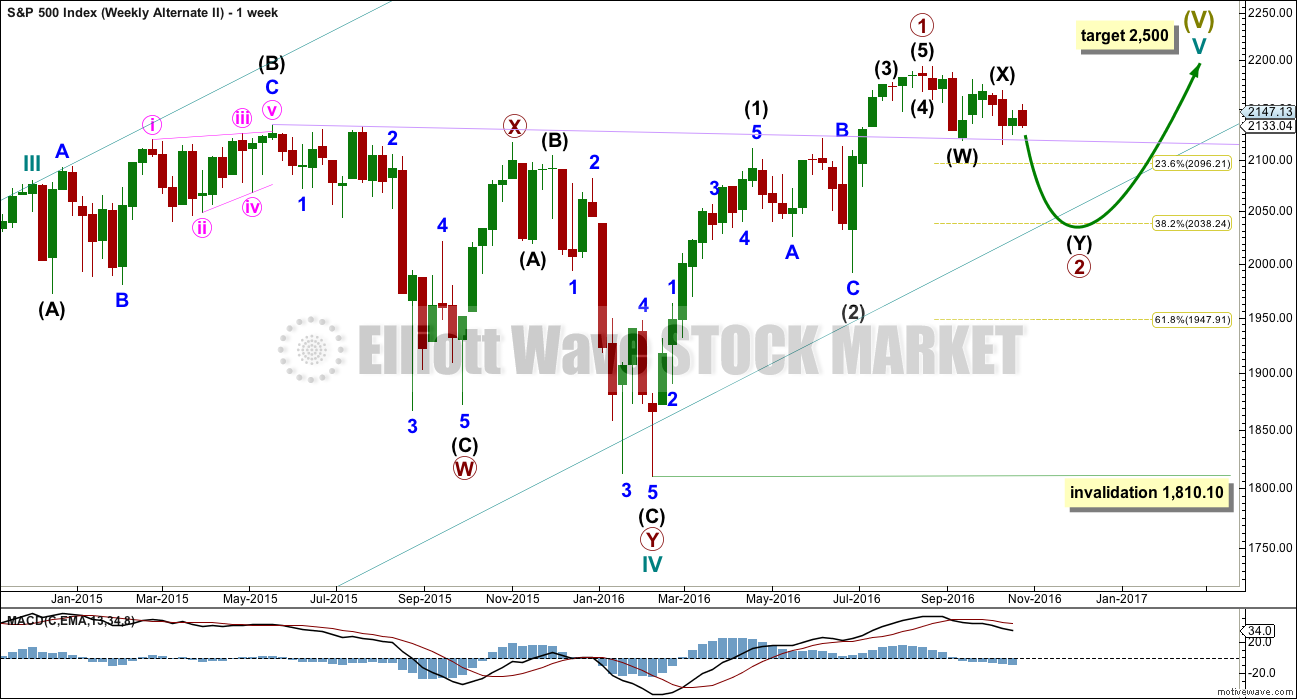
Cycle wave V must subdivide as a five wave structure. I have two wave counts for upwards movement of cycle wave V. This main wave count is presented first only because we should assume the trend remains the same until proven otherwise. Assume that downwards movement is a correction within the upwards trend, until proven it is not.
Primary wave 3 is shorter than primary wave 1, but shows stronger momentum and volume as a third wave normally does. Because primary wave 3 is shorter than primary wave 1 this will limit primary wave 5 to no longer than equality in length with primary wave 3, so that the core Elliott wave rule stating a third wave may not be the shortest is met. Primary wave 5 has a limit at 2,316.85.
Primary wave 2 was a shallow 0.40 expanded flat correction. Primary wave 4 may have ended as a shallow 0.39 double zigzag. There is no alternation in depth, but there is good alternation in structure.
Primary wave 4 may not move into primary wave 1 price territory below 2,111.05.
It is also possible to move the degree of labelling within cycle wave V all down one degree. It may be only primary wave 1 unfolding. The invalidation point for this idea is at 1,810.10. That chart will not be published at this time in order to keep the number of charts manageable. The probability that this upwards impulse is only primary wave 1 is even with the probability that it is cycle wave V in its entirety.
When the five wave structure upwards labelled primary wave 5 is complete, then my main wave count will move the labelling within cycle wave V all down one degree and expect that only primary wave 1 may be complete. The labelling as it is here will become an alternate wave count. This is because we should always assume the trend remains the same until proven otherwise. We should always assume that a counter trend movement is a correction, until price tells us it’s not.
DAILY CHART
Click chart to enlarge.
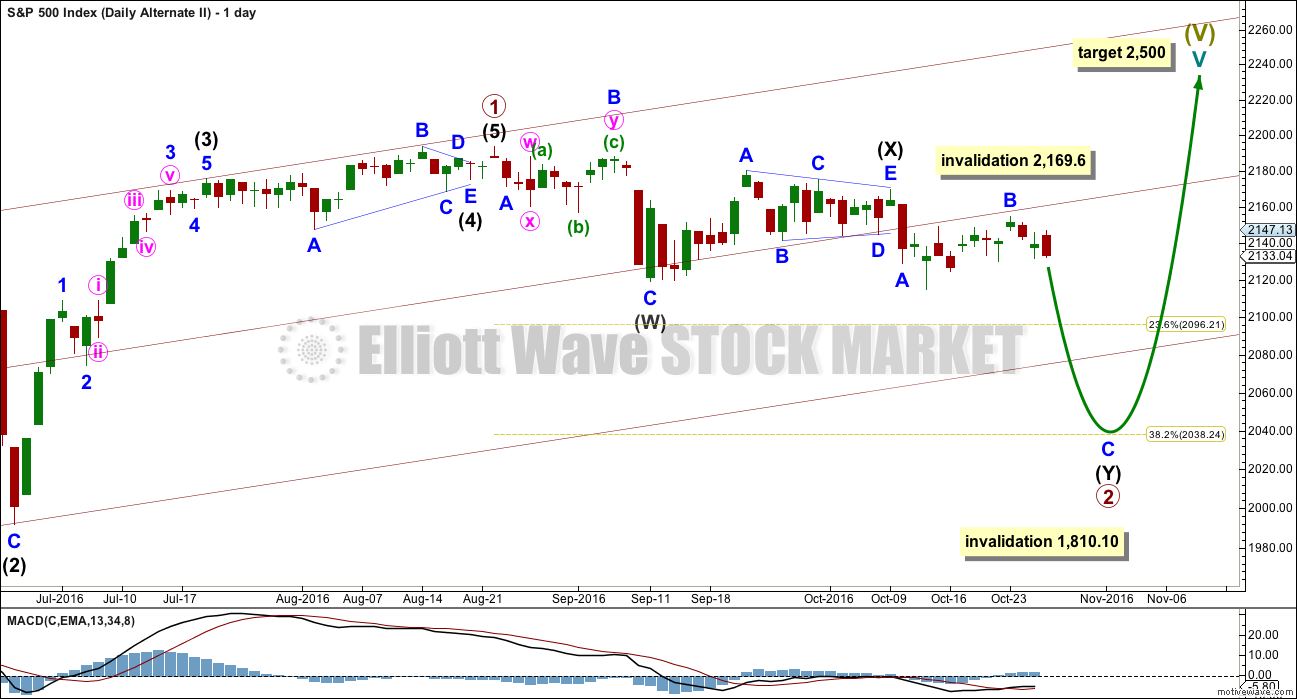
Primary wave 3 is 16.14 points longer than 0.618 the length of primary wave 1. This is a reasonable difference. But as it is less than 10% the length of primary wave 3, it is my judgement that it is close enough to say these waves exhibit a Fibonacci ratio to each other.
If this pattern continues, then about 2,240 primary wave 5 would reach 0.618 the length of primary wave 3. If this target is wrong, it may be too high. When intermediate waves (1) through to (4) are complete, then the target may be changed as it may be calculated at a second degree.
Within cycle wave V, so far primary wave 3 is shorter than primary wave 1 in length. So that the rule stating a third wave may not be the shortest is met, this limits primary wave 5 to no longer than equality in length with primary wave 3 at 2,316.85.
There is good proportion for this wave count. Primary wave 1 lasted 46 days, primary wave 2 lasted 47 days, primary wave 3 lasted a Fibonacci 34 days, and primary wave 4 lasted 42 days. So far primary wave 5 has lasted ten days. With the very slow pace of primary wave 5 so far, if it exhibits a Fibonacci duration when complete, that may now be a Fibonacci 21 days and that would see it end on the 10th of November (give or take one day either side).
Primary wave 4 fits perfectly as a double zigzag. The second zigzag in the double should have ended with a small overshoot of the lilac trend line. This line should provide very strong support. There is almost no room left for primary wave 4 to move into.
If primary wave 4 continues any further, it may not move into primary wave 1 price territory below 2,111.05.
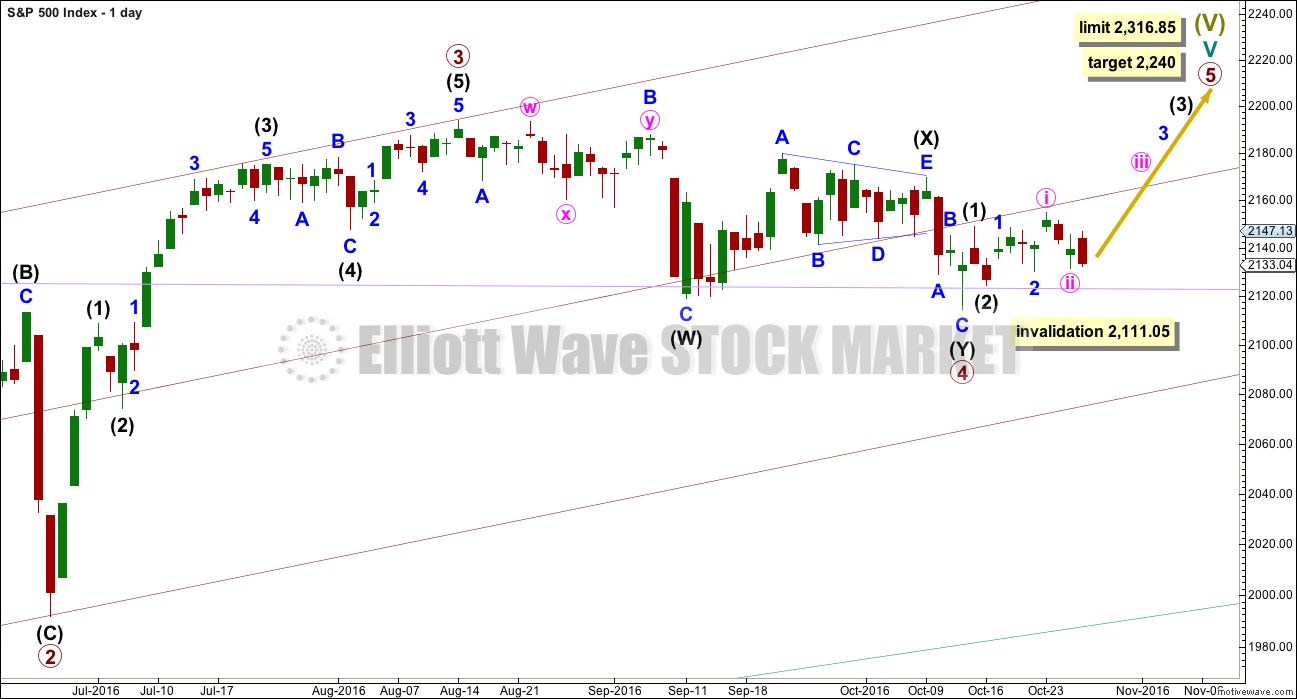
Primary wave 5 must be a five wave structure, so it is most likely to be a simple impulse. It would be very likely to make at least a slight new high above the end of primary wave 3 at 2,193.81 to avoid a truncation. So far it looks like it is unfolding as an impulse rather than an ending diagonal. Within the impulse of intermediate wave (3), the correction of minor wave 2 is now clear. This is typical for third waves of the S&P, so now at the daily chart level this part of the wave count has the right look.
Because primary wave 5 must be shorter in length than primary wave 3, each of its sub-waves should be shorter in length and duration. For this reason intermediate waves (1) and (2) are labelled as complete within primary wave 5. Intermediate wave (2) may have ended when price came to almost again touch the lilac trend line.
HOURLY CHART
Click chart to enlarge.
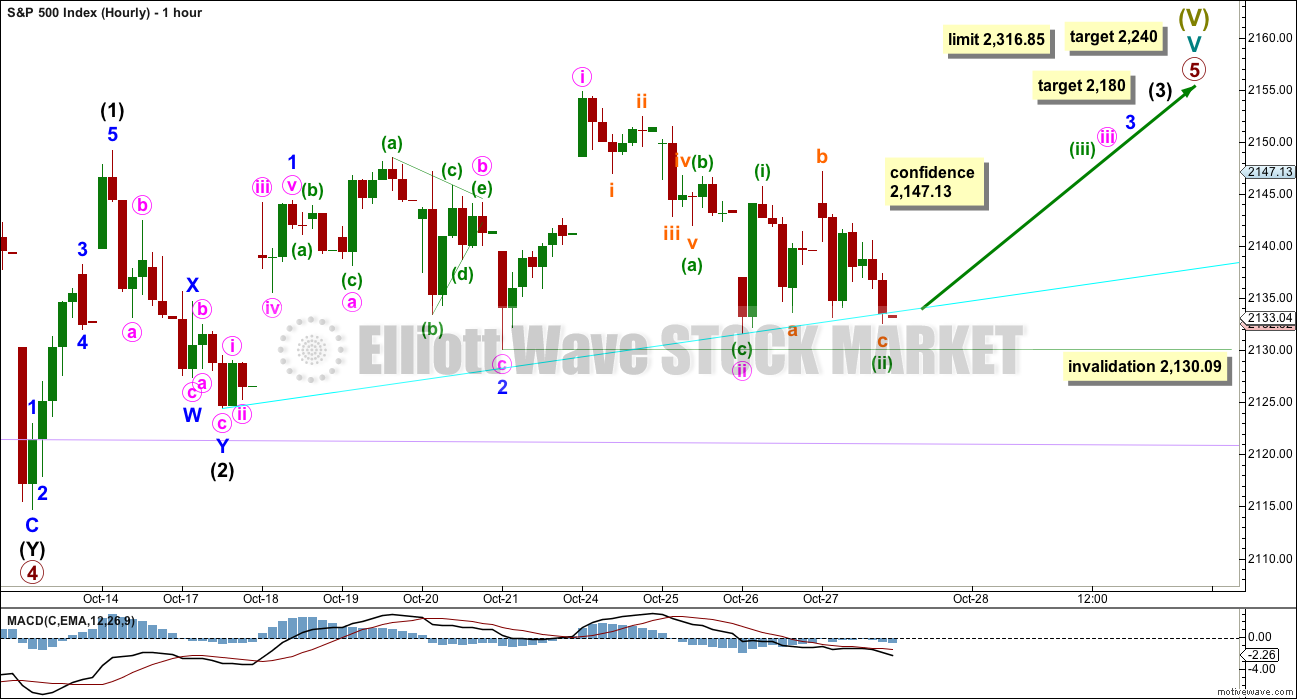
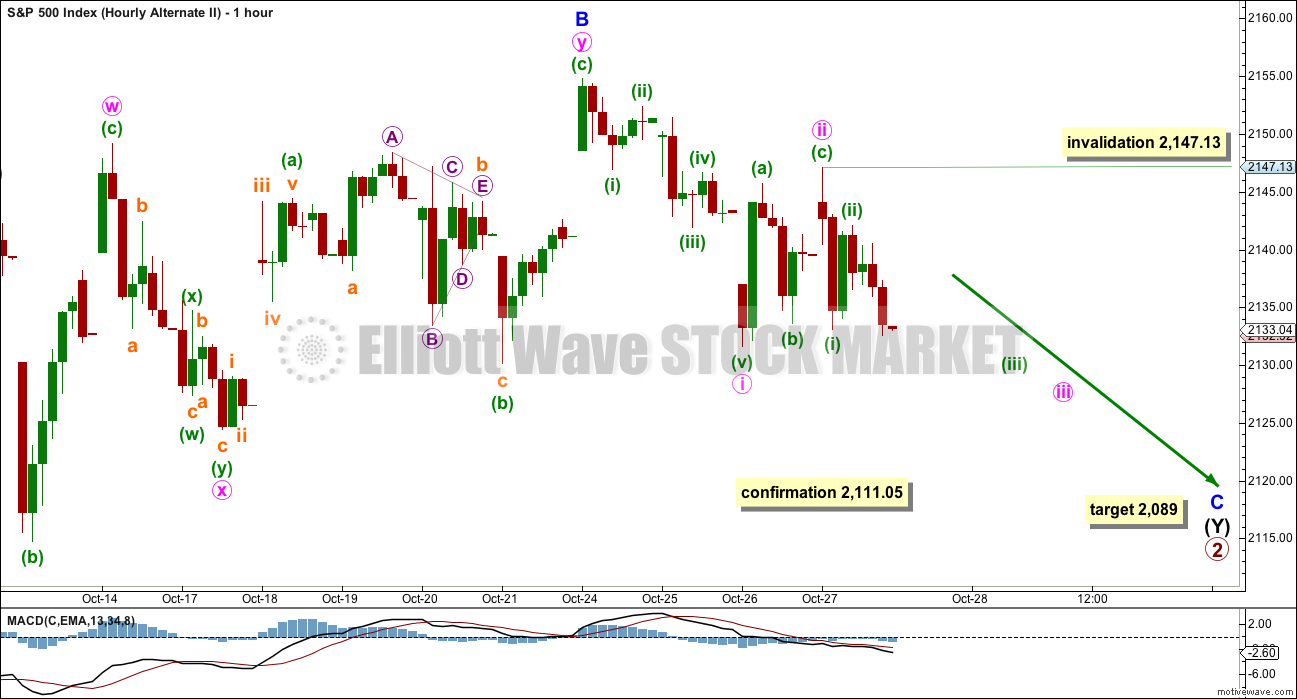
This wave count now has four overlapping first and second waves. This wave count should see upwards movement show an increase in upwards momentum, and it should have support from volume. The fact that this has failed to happen so far is concerning.
The cyan trend line may provide some support.
If minute wave ii moves lower tomorrow, it may not move beyond the start of minute wave i at 2,130.09.
The mid term target for intermediate wave (3) remains the same. At 2,180 it would reach 1.618 the length of intermediate wave (1). This is also an area of strong resistance, so this target looks likely.
Within intermediate wave (3), so far the corrections of minor waves 2 and minute wave ii are now showing clearly on the daily chart. When minute wave iv and minor wave 4 arrive, they too may show on the daily chart, so that the wave count at the daily chart level has the right look with the middle of the third wave being a clear five wave impulse.
At 2,172 minute wave iii would reach 1.618 the length of minute wave i. This target may be met in another two to four sessions.
A new high tomorrow above 2,147.13 would add confidence to this main wave count. At that stage, both alternate hourly wave counts would be invalidated.
ALTERNATE HOURLY CHART
Click chart to enlarge.
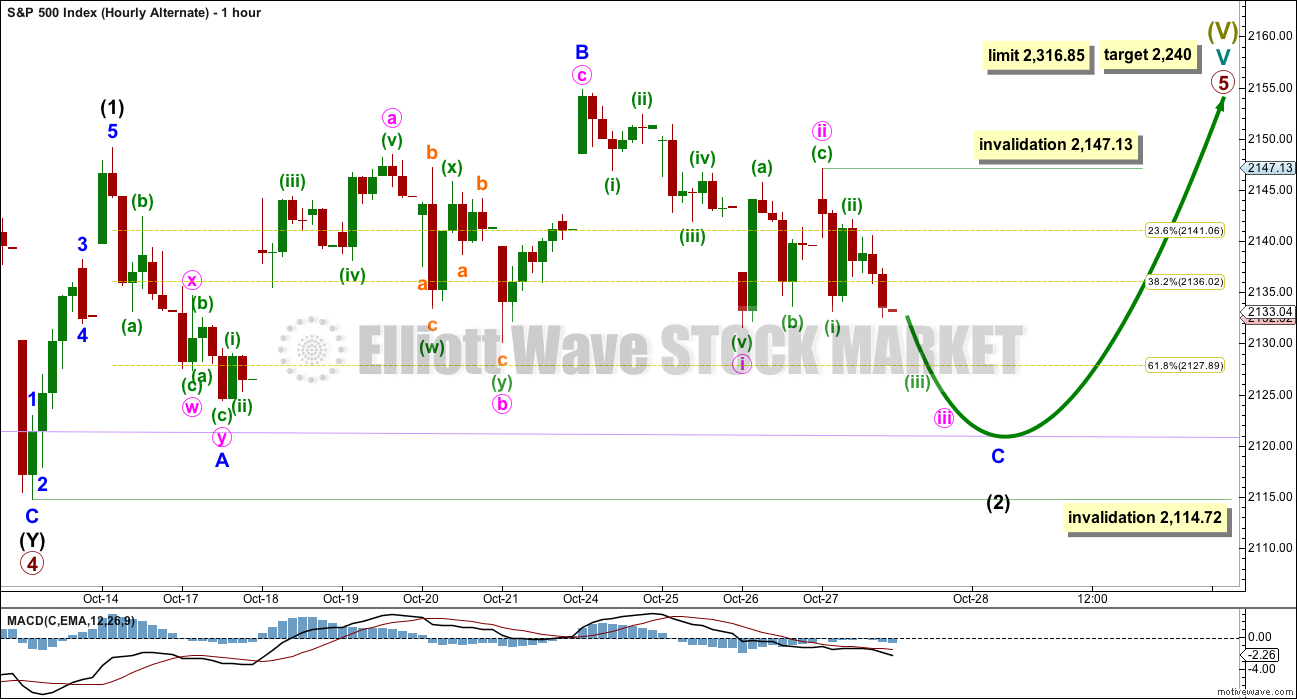
This idea now makes sense. It is possible that intermediate wave (2) is continuing further as an expanded flat correction.
Minor wave A fits as a double zigzag, which is classified as a three. Minor wave B fits as a zigzag and is a 1.23 length of minor wave A, within the normal range of 1 to 1.38.
Minor wave C would be very likely to make at least a slight new low below the end of minor wave A at 2,124.43 to avoid a truncation.
Minor wave C must subdivide as a five wave structure. It may now be ready to move into the strongest portion, the middle of its third wave down, tomorrow. It may find support close to the lilac trend line.
Intermediate wave (2) may not move beyond the start of intermediate wave (1) tomorrow below 2,114.72.
Within minor wave C, minuette wave (ii) may not move beyond the start of minuette wave (i) above 2,147.13.
ALTERNATE WAVE COUNT
WEEKLY CHART
Click chart to enlarge.
What if an impulse upwards is complete? The implications are important. If this is possible, then primary wave 1 within cycle wave V may be complete.
With downwards movement from the high of primary wave 1 now clearly a three and not a five, the possibility that cycle wave V and Super Cycle wave (V) are over has substantially reduced. This possibility would be eliminated if price can make a new all time high above 2,193.81.
If an impulse upwards is complete, then a second wave correction may be unfolding for primary wave 2. Expectations on how deep primary wave 2 is likely to be are now adjusted. It may be expected now to more likely only reach the 0.382 Fibonacci ratio about 2,038.
At this stage, it looks like price has found strong support at the lilac trend line.
Primary wave 2 may not move beyond the start of primary wave 1 below 1,810.10.
DAILY CHART
Click chart to enlarge.
If an impulse upwards is complete, then how may it subdivide and are proportions good?
Intermediate wave (1) was an impulse lasting 47 days. Intermediate wave (2) was an expanded flat lasting 47 days. Intermediate wave (3) fits as an impulse lasting 16 days, and it is 2.04 points short of 0.618 the length of intermediate wave (1). So far this alternate wave count is identical to the main wave count (with the exception of the degree of labelling, but here it may also be moved up one degree).
Intermediate wave (4) may have been a running contracting triangle lasting 22 days and very shallow at only 0.0027 the depth of intermediate wave (3). At its end it effected only a 0.5 point retracement. There is perfect alternation between the deeper expanded flat of intermediate wave (2) and the very shallow triangle of intermediate wave (4). All subdivisions fit and the proportion is good.
Intermediate wave (5) would be very brief at only 18.29 points. Intermediate wave (5) is 1.43 points longer than 0.056 the length of intermediate wave (1).
At this stage, primary wave 2 now has a completed zigzag downwards that did not reach the 0.236 Fibonacci ratio. It is very unlikely for this wave count that primary wave 2 is over there; the correction is too brief and shallow. Upwards movement labelled intermediate wave (X) is so far less than 0.9 the length of the prior wave down labelled intermediate wave (W). The minimum for a flat correction has not been met. Primary wave 2 may continue lower as a double zigzag. A second zigzag in the double may be required to deepen the correction closer to the 0.382 Fibonacci ratio.
Intermediate wave (W) lasted a Fibonacci 13 sessions. Intermediate wave (X) is a complete triangle. X waves may subdivide as any corrective structure (including multiples), and a triangle is possible here.
If minor wave B within the second zigzag of intermediate wave (Y) moves any higher, it may not move beyond the start of minor wave A above 2,169.60.
Primary wave 2 may not move beyond the start of primary wave 1 below 1,810.10. A new low below this point would see the degree of labelling within cycle wave V moved up one degree. At that stage, a trend change at Super Cycle degree would be expected and a new bear market to span several years would be confirmed.
HOURLY CHART
Click chart to enlarge.
Intermediate wave (Y) should subdivide as a zigzag to deepen the correction.
Minor wave B may have completed as a double combination: flat – X – zigzag.
While the subwaves of W, Y and Z within combinations may be only simple corrective structures, X waves may be any type of corrective structure including a multiple. The maximum number of corrections within a multiple is three, so this rule applies to W, Y and Z and not to the X waves which move in the opposite direction and join the corrective structures within a multiple.
Minute wave x subdivides as a double zigzag in this case, and the rule is met: there are only two corrective structures in this multiple with one X wave joining them.
At 2,089 minor wave C would reach 1.618 the length of minor wave A. This would take intermediate wave (Y) somewhat below the end of intermediate wave (W), achieving its purpose of deepening the correction.
This wave count requires confirmation with a new low below 2,111.05 before it should be used.
Within minor wave C, minuette wave (ii) may not move beyond the start of minuette wave (i) above 2,147.13.
TECHNICAL ANALYSIS
WEEKLY CHART
Click chart to enlarge. Chart courtesy of StockCharts.com.
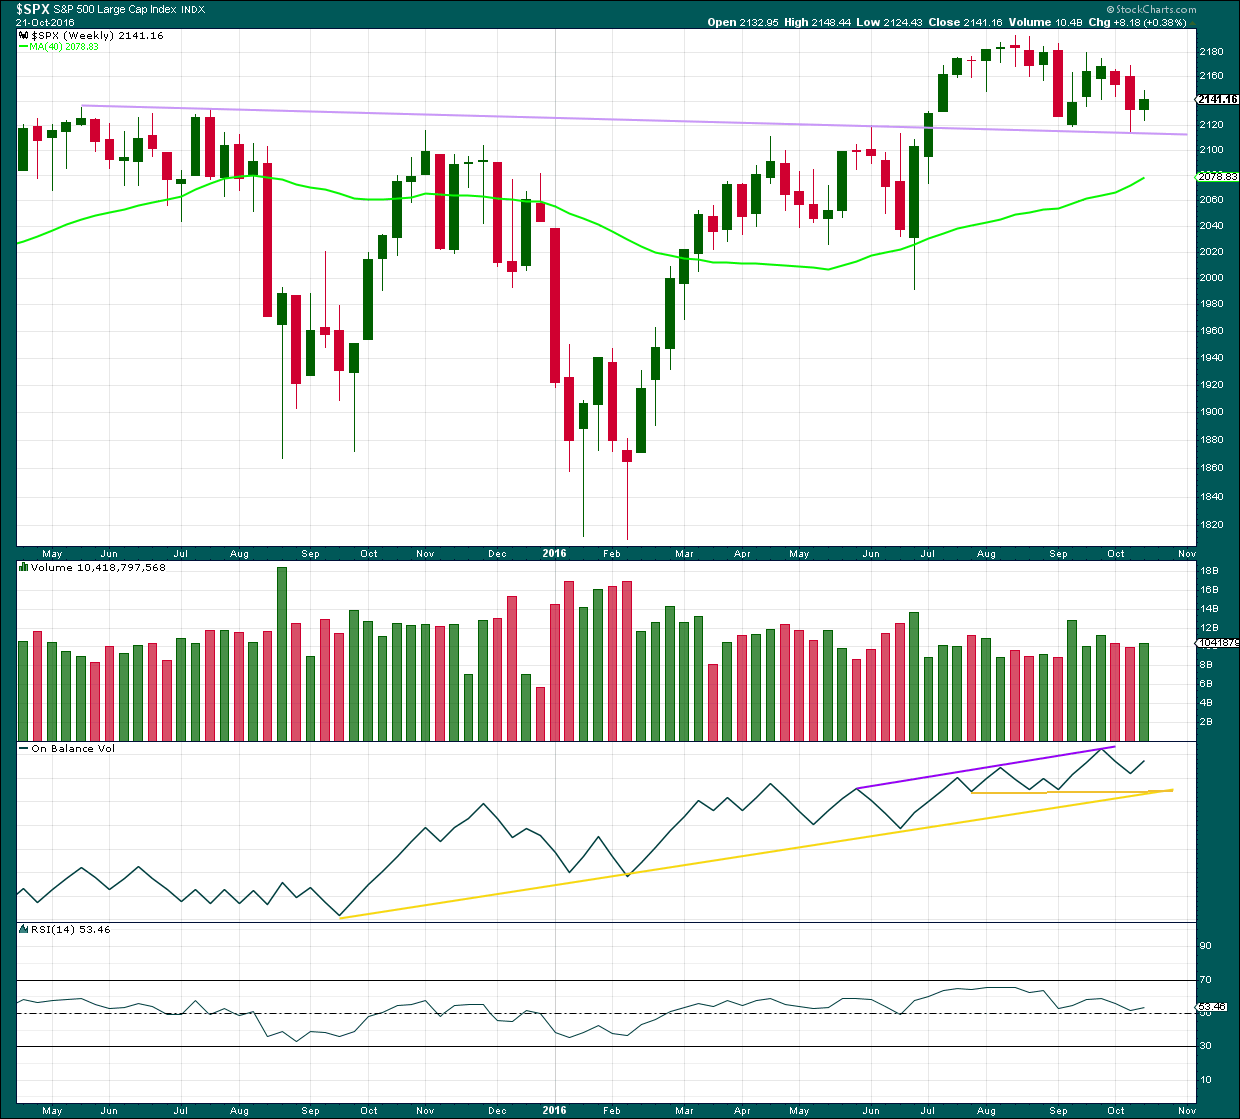
The lilac trend line has strong technical significance. Price broke through resistance, turned down to test support for the first time, and then moved up and away from this line. It was reasonable to conclude that a new all time high is a likely consequence of this typical behaviour.
Now price has come back down for a second test of the lilac trend line. This line is expected to continue to provide support because support at this line is so strong. A break below this line would be a highly significant bearish signal.
A small inside week closes green. Overall, price last week moved upwards. This comes with some increase in volume to support a small rise in price, so this is bullish.
On Balance Volume has some distance to go before it finds any resistance at trend lines.
RSI is still close to neutral. There is plenty of room for price to rise further.
DAILY CHART
Click chart to enlarge. Chart courtesy of StockCharts.com.
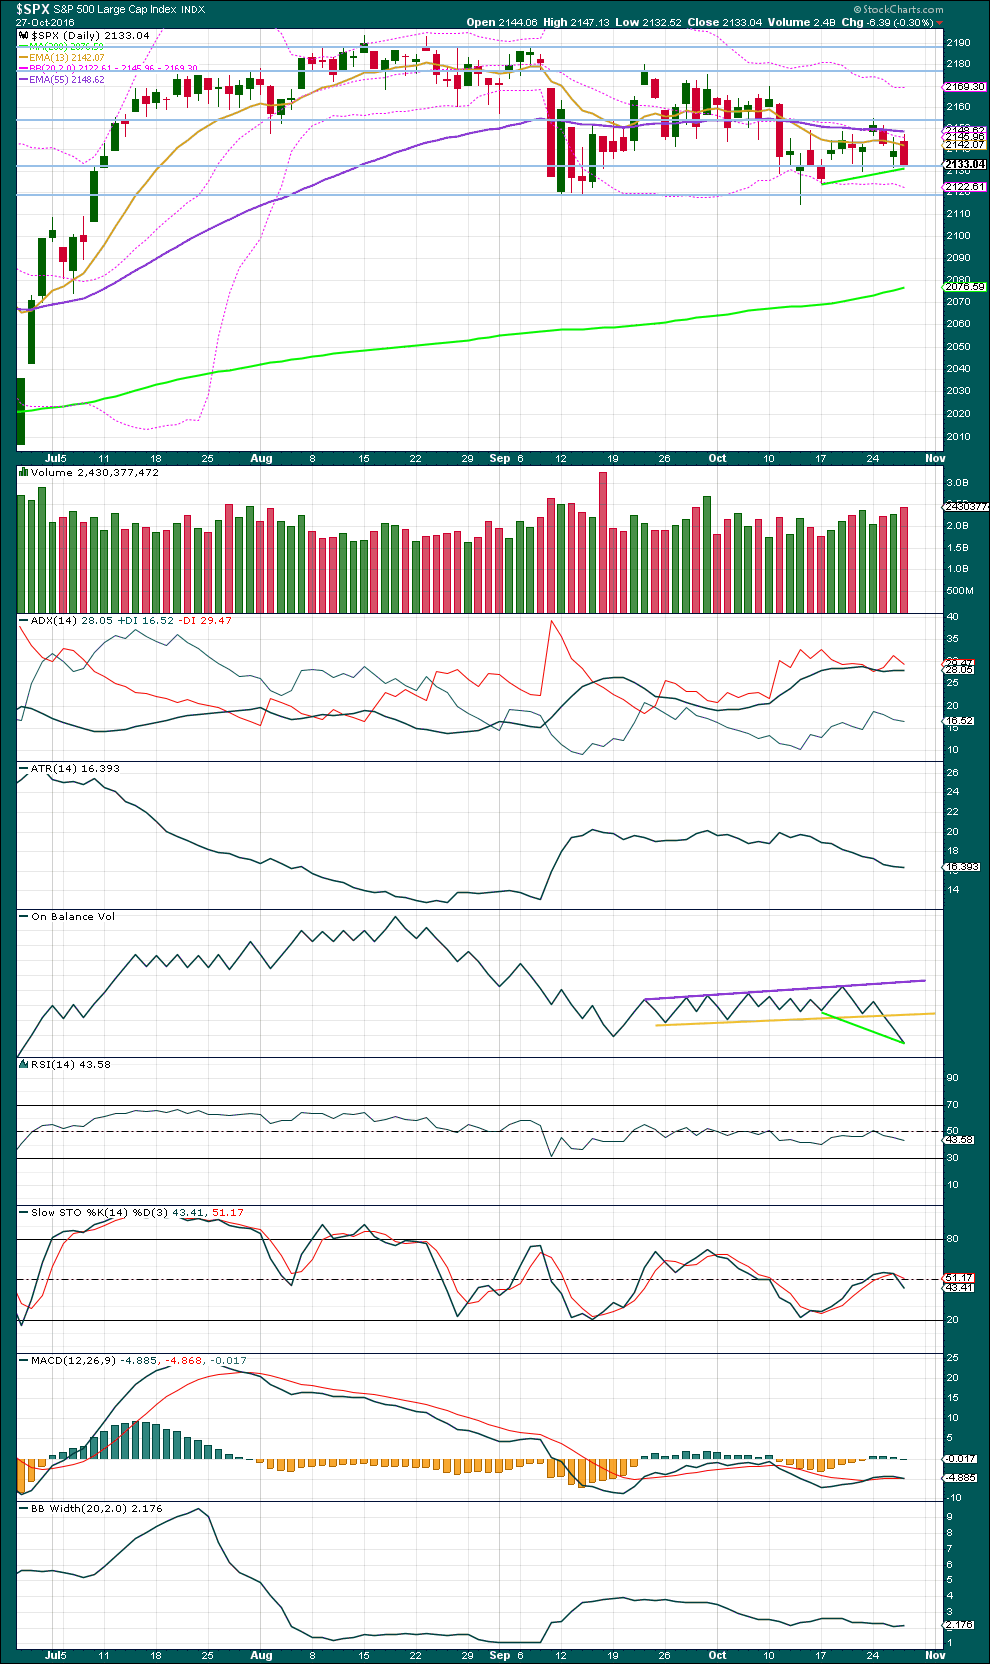
Again, there is support for downwards movement today. On Balance Volume shows there is more support from volume for downwards movement during today’s session.
Volume is rising for the last four days while price is overall moving lower. In the short term, this supports the alternate hourly chart (with the main wave count).
ADX increased very slightly today from 28.04 to 28.05. This may indicate a downwards trend.
ATR disagrees as it is still declining. If this is a downwards trend, it is not healthy. It may more likely be a pullback within a larger upwards trend.
Bollinger Bands slightly widened today, but are still closely contracted. This market lacks volatility.
On Balance Volume today gives two conflicting signals. The break below the yellow support line is a strong bearish signal. The divergence with today’s low and the low eight days ago on the 17th of October is a bullish signal. So far trend lines have been working more reliably than divergence with OBV, so the bearish signal will be given more weight.
Stochastics and RSI are close enough to neutral to allow this market plenty of room to move up or down.
VOLATILITY – INVERTED VIX CHART
Click chart to enlarge. Chart courtesy of StockCharts.com.
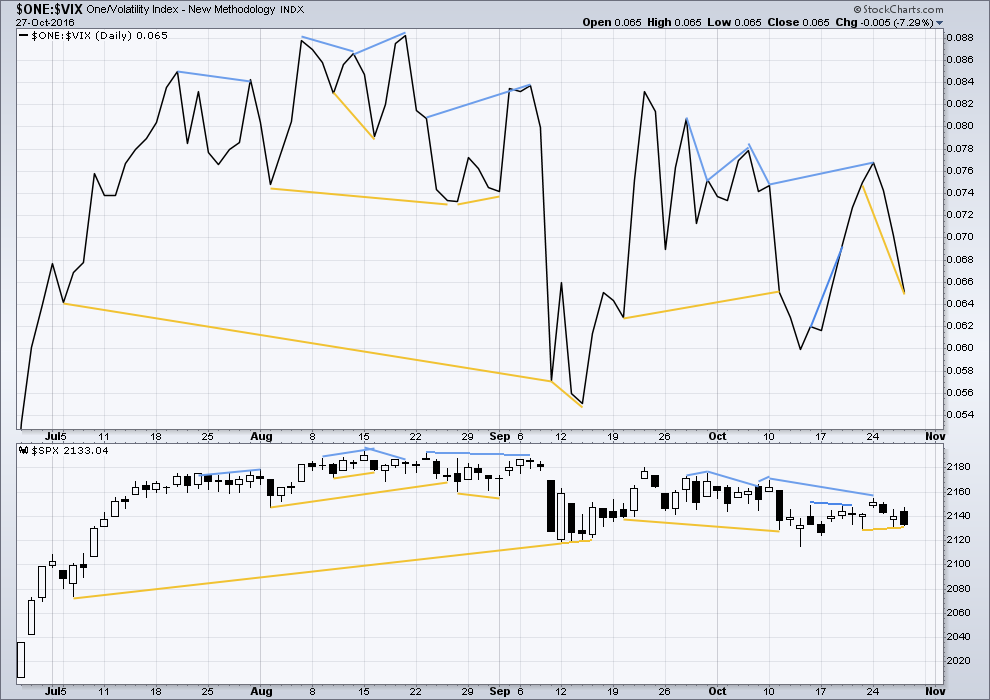
There are a few instances of multi day divergence between price and inverted VIX noted here. Bearish divergence is blue. Bullish divergence is yellow. It appears so far that divergence between inverted VIX and price is again working to indicate short term movements spanning one or two days.
The last bearish divergence noted two days ago has now been followed by two downwards days, so it should be assumed to now be resolved.
The bullish divergence noted yesterday between price and inverted VIX has continued today, so it now runs for two days: inverted VIX made a new low below the prior low of the 21st of October, but price has failed to make a corresponding new low. This is hidden bullish divergence and indicates weakness in price. It may be followed by one or two upwards days.
BREADTH – AD LINE
Click chart to enlarge. Chart courtesy of StockCharts.com.
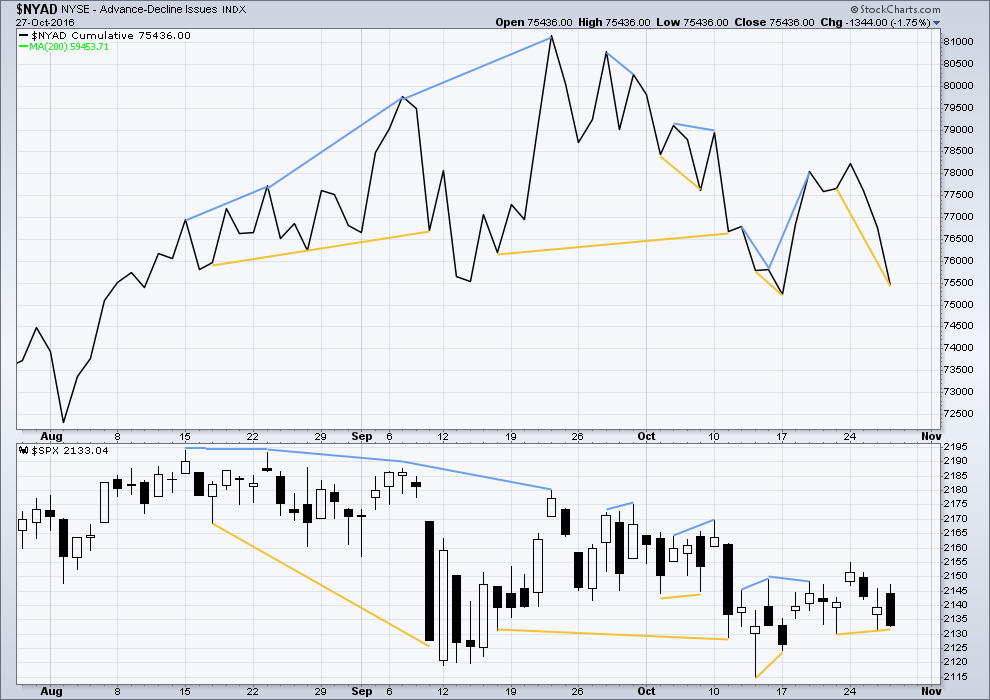
Short term bullish and bearish divergence is again working between price and the AD line to show the direction for the following one or two days.
The same hidden bullish divergence seen for inverted VIX is also seen with the AD line today, so it also now runs for two days: the AD line has made a substantial new low below the prior low of the 21st of October, but price has failed to make a corresponding low. This hidden bullish divergence indicates weakness in price. It may be expected to be followed by one or two days of upwards movement.
DOW THEORY
Major lows within the old bull market:
DJIA: 15,855.12 (15th October, 2014) – closed below on 25th August, 2015.
DJT: 7,700.49 (12th October, 2014) – closed below on 24th August, 2015.
S&P500: 1,821.61 (15th October, 2014) – has not closed below this point yet.
Nasdaq: 4,117.84 (15th October, 2014) – has not closed below this point yet.
Major highs within the bear market from November 2014:
DJIA: 17,977.85 (4th November, 2015) – closed above on 18th April, 2016.
DJT: 8,358.20 (20th November, 2015) – has not closed above this point yet.
S&P500: 2,116.48 (3rd November, 2015) – closed above this point on 8th June, 2016.
Nasdaq: 5,176.77 (2nd December, 2015) – closed above this point on 1st August, 2016.
Dow Theory Conclusion: Original Dow Theory still sees price in a bear market because the transportations have failed to confirm an end to that bear market. Modified Dow Theory (adding S&P and Nasdaq) has failed still to confirm an end to the old bull market, modified Dow Theory sees price still in a bull market.
This analysis is published @ 11:45 p.m. EST.
Those of you who have been on the forum awhile are quite familiar with my long standing contention that the ultimate threat to this contrived market climb of the last several years will be the bond market. The recent explosion of big corporate mergers may be the bond market equivalent of a blow-off equity market top. Here are a few interesting facts:
US companies have made an amazing 250.00 B in merger deals this month, the most in any one month in history!
Moody’s and S&P have both been rating companies formerly with risky BBB- higher so as to allow them to load themselves up with even greater amounts of debt at lower interest rates to finance these mergers (sounds familiar?)
Every 1% rise in interest rates is going to cost global bond holders some 2 Trillion in losses, in some cases wiping out the bond issuers.
A 1% yearly yield swing is not that unusual an event. The benchmark 10YR Treaury yield has climbed by that amount ten times in the last forty years, twice as often as SPX has declined by 10% or more.
I think this thing is closer to an end than most people think, and that market slide yesterday, although it was quickly re-bought by the banksters, is just the kind of exogenous jolt (in this case the FBI announcement about madam Hillary) that will take many by surprise. The final shock will cause a slide that cannot be bought back into the green by all the capital of all the banksters in the universe.
I have to say I am more than a little surprised at how little skepticism has greeted the recently reported US GDP number. We have in the US, an executive branch notorious for its flagrant mendacity, and this reminds me of the ridiculous GDP number they reported in the Fall of 2012 just ahead of the election. I fully understand that the so-called mainstream media is woefully corrupt and entirely useless when it comes to any kind of objective reporting of fact. The recent Wikileaks revelations exposing them as useless lapdogs of politicians is no surprise. It reminds me of the joke of the mafia don letting one of his underlings know that when he wanted his opinion “he would give it to him”!
Needless to say, I consider the growth number suspect, as I do any information coming out of the Obama administration. I have been absolutely stunned at how all the talking heads have been mindlessly repeating the number as if it were indeed fact, with nary a reference to a host other indicators that would suggest more sluggish growth. Am I missing something, or people becoming that gullible (or comlicit)??!!
When I am watching the mainline news channels, I see them as directed by the Clinton campaign. When it comes to politics in the US, the mainline news channels are nothing more than an Obama-Clinton propaganda outlet.
If we are in a primary degree second wave correction I suspect we may have to lower the wave count for minor C one degree with just minute one down almost complete. This could get a bit interesting as a deep second wave correction next week could make it appear the decline was over. If VIX BBs exapnd to contain a rising VIX that could signal a deeper correction unfolding.
Another possibility along the same line as your thought is that Minuette iii of Minute iii is extending. This could take the completion of Minute iii to the 2100 level. Then a Minute IV bounce to about 2114 with the final Minute V drop to 2085 to complete Minor 2, Intermediate Y and Primary 2.
This could be completed by election day with the kickoff of Primary 3 of Cycle V starting the day after the election. Of course the news would be that Wall Street loves the victor whoever that may be.
Excellent point Rodney and I did not think of that. The third wave, or even the fifth could extend to protract the decline by quite a bit…
The main hourly is invalidated. The new alternate is going to be the main wave count; intermediate (2) ending with one more low.
So far minute iv has remained just below minute i price territory. I’ve adjusted the labelling of minute ii; it’s now seen as a sideways combination (zigzag – X – expanded flat).
As soon as minute v reaches below the end of iii at 2,119.36 then it could be over and a third wave up could be ready.
OR…
The alternate is correct and price may continue lower for a few weeks to complete primary 2 towards 2,089.
The final line in the sand between the main and alternate wave counts is 2,111.05.
A new low below that point and primary 2 is continuing lower. While price remains above that point we should assume that this correction is one degree higher, intermediate, and that a third wave up is waiting in the wings.
Assume the trend remains the same… until proven otherwise.
I’ll also be carefully reading Lowry’s analysis today to see how the underlying strength of this market is holding up, or not.
SPX 2119 was the low set on Sept. 12th. Today we tagged that point which is also the breakout point set back in June and taken out in July. I believe this is a significant line for the bulls to hold. We have now seen three back tests of this breakout point to 2119.
We have a descending triangle off the top developed since the Aug high. The bulls are losing steam and exhausted. My experience is that descending triangles break to the downside.
The SPX 13, 34 and 50 day moving averages are all pointing down.
RUT / IWM appears to be leading to the downside.
All that being said, Lara is correct, the larger trend is still upwards and it is risky to go against the larger trend. Even though we have essentially gone sideways for two or three months (or longer), it appears we are very near a resolving break. Trick is: is the first break a false break, a fake out? Or will it last?
Either could be correct. I do think we need another low and UVXY should also probably hit the upper BB for an intermediate two low.
As I mentioned yesterday, if 2135 did not hold we were going to test 2114. If that does not hold, we go below 2100. Lara’s alternate wave count states on the hourly chart a target of 2089. I think we will see it soon.
If this pans out and the alternate wave count becomes the primary, it has an upside target of 2500 SPX before we see the next lasting and severe bear market.
SPX 2089 is very much possible. The daily indicators have not reached the oversold territory yet. Possibly later today or a gap down on Monday…
Anybody snoring? Wake ’em! 🙂
Very strange disconnect between VIX and UVXY, the former in the red, the latter in the green. They cannot both be correct. I know the latter supposedly tracks futures but the divergence is still very strange…
We have not seen more that two or three days of consecutive decline for SVXY so if the pattern holds a market bounce could be ahead…
A casual glance would suggest there is absolutely nothing going on in the equities markets. We have been trading in a narrow range now for months with neither bulls nor bears apparently able to engineer a decisive break-out. This stand-off has been maddening for many traders following DJI and SPX as good trading set-ups have been few and far between. Looking at other venues might perhaps provide some hint as to what might be developing behind the scenes. I did have to chuckle at the 2.9 number reported for US GDP growth this morning, good election news for the gullible I suppose.
Take a look at IWM, the idex that tracks the Russell 2000. It finally broke a long- held support shelf yesterday. Could small caps be telling us not to start snoring…at least not just yet? : D
IBB broke out of its 4w today on the 4hr chart. 5w should come in around the 250 area. Love selling those 4w’s.
Hi, just learning Elliott Wave and find this site very informative. Although not Elliott Wave, I thought this graphic of a pitchfork overlayed on a weekly of the S&P may be of interest. The index is hitting resistance at the top line. Adding reinforcement was the index meeting resistance on the middle line in November/December of last year. Although the index is idling at the moment and price can go either way, the lower weekly tops does show the index is vulnerable, especially going into the US election.
A continuing intermediate two does indeed sound reasonable. The series of new 52 week lows in volatility (UVXY) did strongly suggest wave action at higher than minor degree. We should definitely see an upper BB penetration to conclude a correction at intermediate degree with the so very typical long upper wick (VIX) that signals capitulation at an interim bottom and the set-up for a rally.
That’s exactly what I’m seeing so far for this session Verne…. upper BBs penetrated for VIX, today’s green candlestick has a long upper wick. It also has a long lower wick.
Looks like we will get a final low during Monday’s session.
Have a great weekend all!