
Last Elliott wave analysis expected Wednesday’s session to begin with a little downwards movement to end close to 2,140. Thereafter, it was expected that price would turn upwards.
The low for the session was 2,131.59. The session closed green although it made a lower low and lower high, so overall price moved downwards.
Summary: Upwards movement for a green daily candlestick is expected for tomorrow. Overall, price should now begin to move strongly higher towards a short term target at 2,172, which may be met in two or three sessions. Hidden bullish divergence between price and inverted VIX and the AD line supports this view, but a strong bearish signal from On Balance Volume today contradicts it. It is my judgement that despite OBV price is still likely to move higher tomorrow.
Last monthly chart for the main wave count is here.
New updates to this analysis are in bold.
MAIN WAVE COUNT
WEEKLY CHART
Click chart to enlarge.
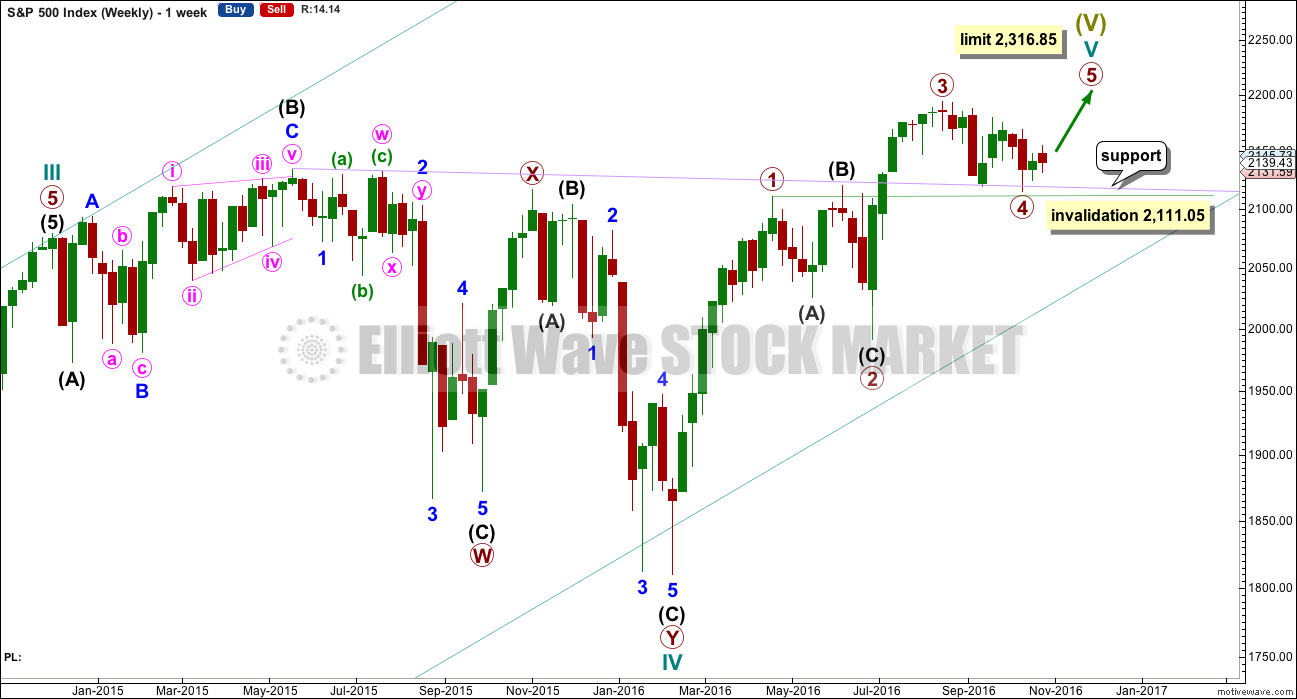
Cycle wave V must subdivide as a five wave structure. I have two wave counts for upwards movement of cycle wave V. This main wave count is presented first only because we should assume the trend remains the same until proven otherwise. Assume that downwards movement is a correction within the upwards trend, until proven it is not.
Primary wave 3 is shorter than primary wave 1, but shows stronger momentum and volume as a third wave normally does. Because primary wave 3 is shorter than primary wave 1 this will limit primary wave 5 to no longer than equality in length with primary wave 3, so that the core Elliott wave rule stating a third wave may not be the shortest is met. Primary wave 5 has a limit at 2,316.85.
Primary wave 2 was a shallow 0.40 expanded flat correction. Primary wave 4 may have ended as a shallow 0.39 double zigzag. There is no alternation in depth, but there is good alternation in structure.
Primary wave 4 may not move into primary wave 1 price territory below 2,111.05.
It is also possible to move the degree of labelling within cycle wave V all down one degree. It may be only primary wave 1 unfolding. The invalidation point for this idea is at 1,810.10. That chart will not be published at this time in order to keep the number of charts manageable. The probability that this upwards impulse is only primary wave 1 is even with the probability that it is cycle wave V in its entirety.
When the five wave structure upwards labelled primary wave 5 is complete, then my main wave count will move the labelling within cycle wave V all down one degree and expect that only primary wave 1 may be complete. The labelling as it is here will become an alternate wave count. This is because we should always assume the trend remains the same until proven otherwise. We should always assume that a counter trend movement is a correction, until price tells us it’s not.
DAILY CHART
Click chart to enlarge.
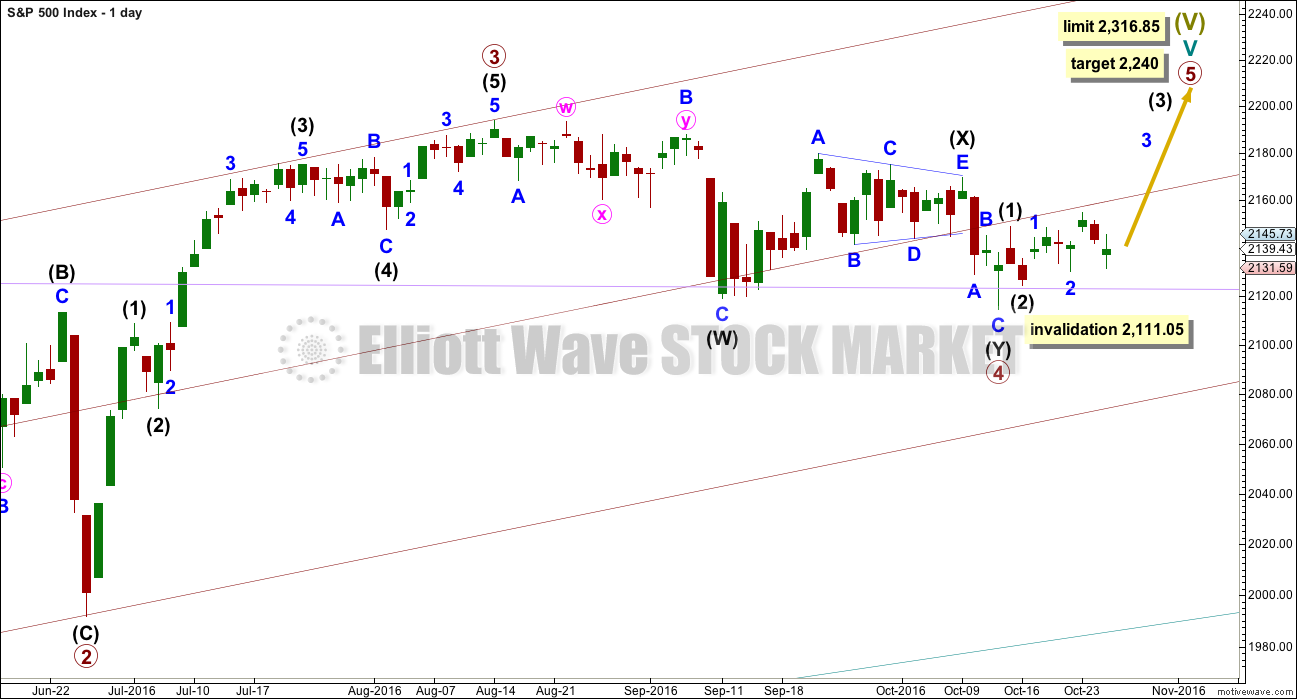
Primary wave 3 is 16.14 points longer than 0.618 the length of primary wave 1. This is a reasonable difference. But as it is less than 10% the length of primary wave 3, it is my judgement that it is close enough to say these waves exhibit a Fibonacci ratio to each other.
If this pattern continues, then about 2,240 primary wave 5 would reach 0.618 the length of primary wave 3. If this target is wrong, it may be too high. When intermediate waves (1) through to (4) are complete, then the target may be changed as it may be calculated at a second degree.
Within cycle wave V, so far primary wave 3 is shorter than primary wave 1 in length. So that the rule stating a third wave may not be the shortest is met, this limits primary wave 5 to no longer than equality in length with primary wave 3 at 2,316.85.
There is good proportion for this wave count. Primary wave 1 lasted 46 days, primary wave 2 lasted 47 days, primary wave 3 lasted a Fibonacci 34 days, and primary wave 4 lasted 42 days. So far primary wave 5 has lasted nine days. With the very slow pace of primary wave 5 so far, if it exhibits a Fibonacci duration when complete, that may now be a Fibonacci 21 days and that would see it end on the 10th of November (give or take one day either side).
Primary wave 4 fits perfectly as a double zigzag. The second zigzag in the double should have ended with a small overshoot of the lilac trend line. This line should provide very strong support. There is almost no room left for primary wave 4 to move into.
If primary wave 4 continues any further, it may not move into primary wave 1 price territory below 2,111.05.
Primary wave 5 must be a five wave structure, so it is most likely to be a simple impulse. It would be very likely to make at least a slight new high above the end of primary wave 3 at 2,193.81 to avoid a truncation. So far it looks like it is unfolding as an impulse rather than an ending diagonal. Within the impulse of intermediate wave (3), the correction of minor wave 2 is now clear. This is typical for third waves of the S&P, so now at the daily chart level this part of the wave count has the right look.
Because primary wave 5 must be shorter in length than primary wave 3, each of its sub-waves should be shorter in length and duration. For this reason intermediate waves (1) and (2) are labelled as complete within primary wave 5. Intermediate wave (2) may have ended when price came to almost again touch the lilac trend line.
HOURLY CHART
Click chart to enlarge.
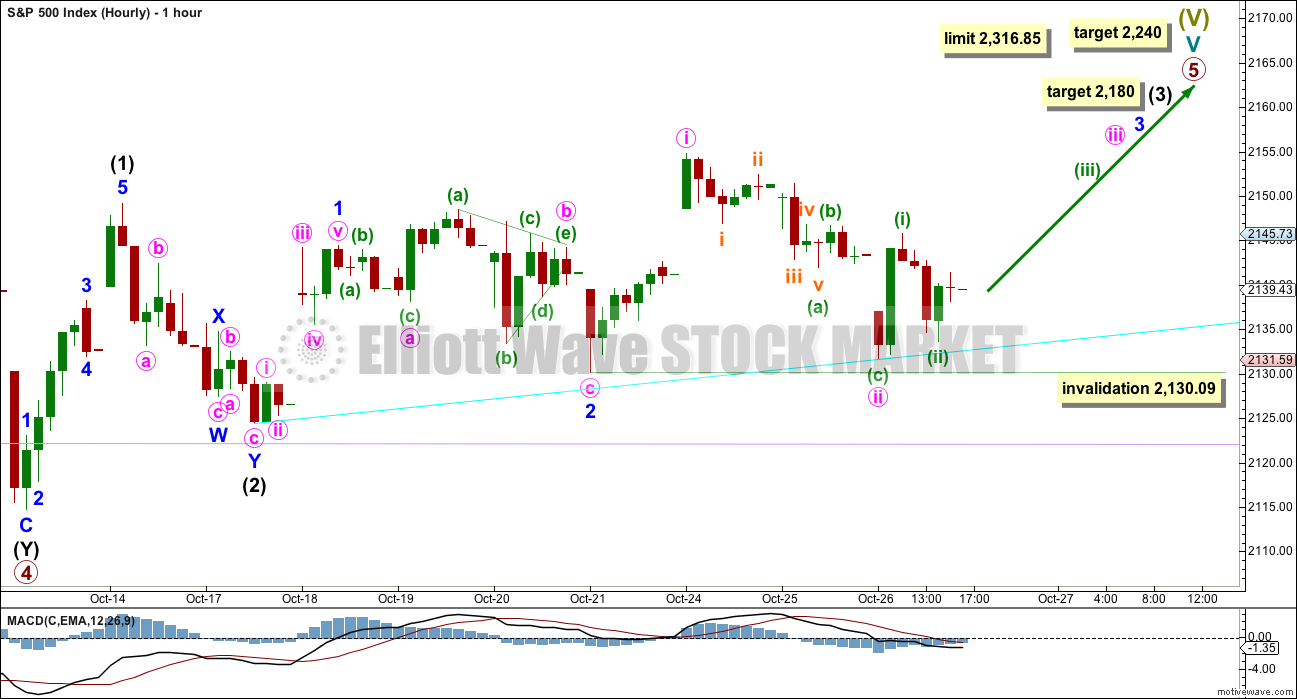
This wave count now has four overlapping first and second waves. Tomorrow and the day after should see upwards movement show an increase in upwards momentum, and it should have support from volume.
The cyan trend line is redrawn. This may provide some support.
If minute wave ii moves lower tomorrow, it may not move beyond the start of minute wave i at 2,130.09.
The mid term target for intermediate wave (3) remains the same. At 2,180 it would reach 1.618 the length of intermediate wave (1). This is also an area of strong resistance, so this target looks likely.
Within intermediate wave (3), so far the corrections of minor waves 2 and minute wave ii are now showing clearly on the daily chart. When minute wave iv and minor wave 4 arrive, they too may show on the daily chart, so that the wave count at the daily chart level has the right look with the middle of the third wave being a clear five wave impulse.
At 2,172 minute wave iii would reach 1.618 the length of minute wave i. This target may be met in two or three sessions.
Subdivisions for the alternate hourly wave count published up to yesterday no longer make sense. I cannot see that idea fitting current movement, so today it will not be published. If any members would like to see that chart with its problems let me know in comments and I will publish it in comments for you.
ALTERNATE WAVE COUNT
WEEKLY CHART
Click chart to enlarge.
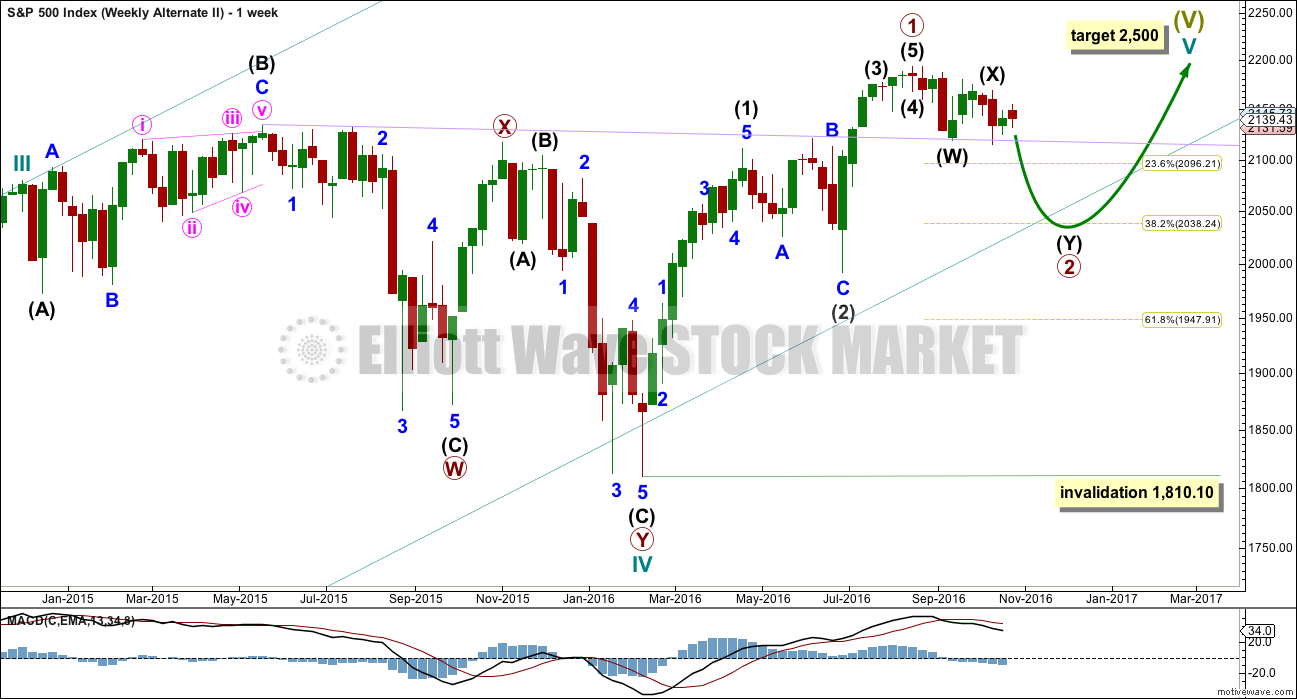
What if an impulse upwards is complete? The implications are important. If this is possible, then primary wave 1 within cycle wave V may be complete.
With downwards movement from the high of primary wave 1 now clearly a three and not a five, the possibility that cycle wave V and Super Cycle wave (V) are over has substantially reduced. This possibility would be eliminated if price can make a new all time high above 2,193.81.
If an impulse upwards is complete, then a second wave correction may be unfolding for primary wave 2. Expectations on how deep primary wave 2 is likely to be are now adjusted. It may be expected now to more likely only reach the 0.382 Fibonacci ratio about 2,038.
At this stage, it looks like price has found strong support at the lilac trend line.
Primary wave 2 may not move beyond the start of primary wave 1 below 1,810.10.
DAILY CHART
Click chart to enlarge.
If an impulse upwards is complete, then how may it subdivide and are proportions good?
Intermediate wave (1) was an impulse lasting 47 days. Intermediate wave (2) was an expanded flat lasting 47 days. Intermediate wave (3) fits as an impulse lasting 16 days, and it is 2.04 points short of 0.618 the length of intermediate wave (1). So far this alternate wave count is identical to the main wave count (with the exception of the degree of labelling, but here it may also be moved up one degree).
Intermediate wave (4) may have been a running contracting triangle lasting 22 days and very shallow at only 0.0027 the depth of intermediate wave (3). At its end it effected only a 0.5 point retracement. There is perfect alternation between the deeper expanded flat of intermediate wave (2) and the very shallow triangle of intermediate wave (4). All subdivisions fit and the proportion is good.
Intermediate wave (5) would be very brief at only 18.29 points. Intermediate wave (5) is 1.43 points longer than 0.056 the length of intermediate wave (1).
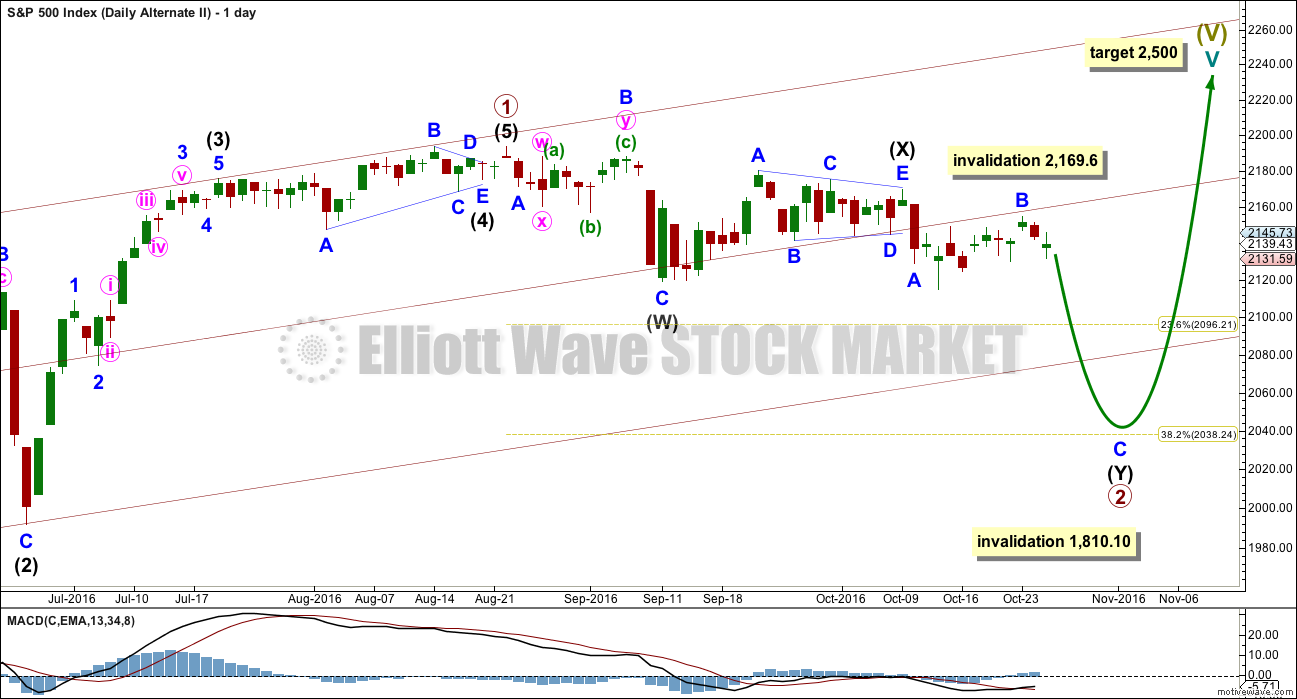
At this stage, primary wave 2 now has a completed zigzag downwards that did not reach the 0.236 Fibonacci ratio. It is very unlikely for this wave count that primary wave 2 is over there; the correction is too brief and shallow. Upwards movement labelled intermediate wave (X) is so far less than 0.9 the length of the prior wave down labelled intermediate wave (W). The minimum for a flat correction has not been met. Primary wave 2 may continue lower as a double zigzag. A second zigzag in the double may be required to deepen the correction closer to the 0.382 Fibonacci ratio.
Intermediate wave (W) lasted a Fibonacci 13 sessions. Intermediate wave (X) is a complete triangle. X waves may subdivide as any corrective structure (including multiples), and a triangle is possible here.
If minor wave B within the second zigzag of intermediate wave (Y) moves any higher, it may not move beyond the start of minor wave A above 2,169.60.
Primary wave 2 may not move beyond the start of primary wave 1 below 1,810.10. A new low below this point would see the degree of labelling within cycle wave V moved up one degree. At that stage, a trend change at Super Cycle degree would be expected and a new bear market to span several years would be confirmed.
HOURLY CHART
Click chart to enlarge.
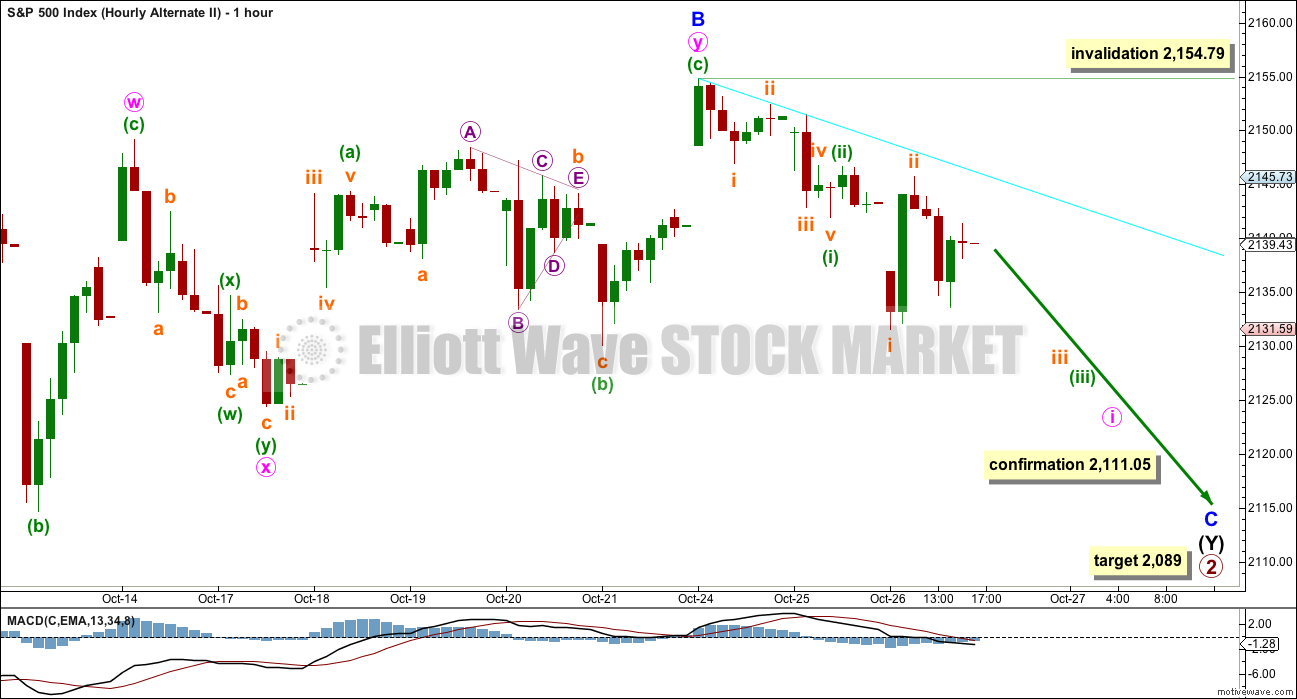
Intermediate wave (Y) should subdivide as a zigzag to deepen the correction.
Minor wave B may have completed as a double combination: flat – X – zigzag.
While the subwaves of W, Y and Z within combinations may be only simple corrective structures, X waves may be any type of corrective structure including a multiple. The maximum number of corrections within a multiple is three, so this rule applies to W, Y and Z and not to the X waves which move in the opposite direction and join the corrective structures within a multiple.
Minute wave x subdivides as a double zigzag in this case, and the rule is met: there are only two corrective structures in this multiple with one X wave joining them.
At 2,089 minor wave C would reach 1.618 the length of minor wave A. This would take intermediate wave (Y) somewhat below the end of intermediate wave (W), achieving its purpose of deepening the correction.
This wave count requires confirmation with a new low below 2,111.05 before it should be used.
Within minor wave C, the correction to come for minute wave ii may not move beyond the start of minute wave i above 2,154.79.
TECHNICAL ANALYSIS
WEEKLY CHART
Click chart to enlarge. Chart courtesy of StockCharts.com.
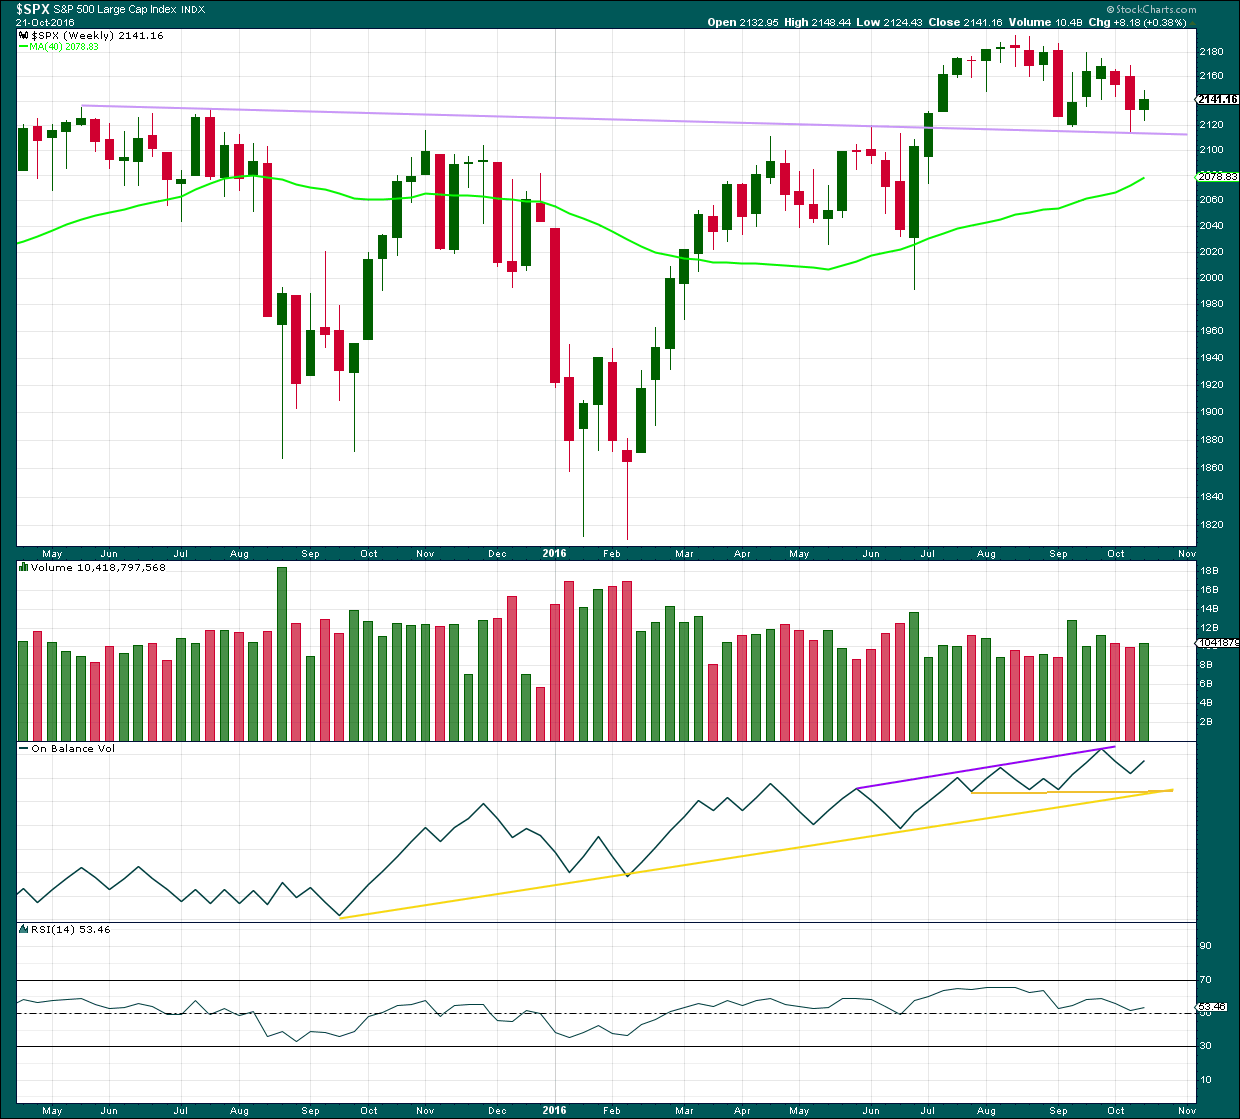
The lilac trend line has strong technical significance. Price broke through resistance, turned down to test support for the first time, and then moved up and away from this line. It was reasonable to conclude that a new all time high is a likely consequence of this typical behaviour.
Now price has come back down for a second test of the lilac trend line. This line is expected to continue to provide support because support at this line is so strong. A break below this line would be a highly significant bearish signal.
A small inside week closes green. Overall, price last week moved upwards. This comes with some increase in volume to support a small rise in price, so this is bullish.
On Balance Volume has some distance to go before it finds any resistance at trend lines.
RSI is still close to neutral. There is plenty of room for price to rise further.
DAILY CHART
Click chart to enlarge. Chart courtesy of StockCharts.com.
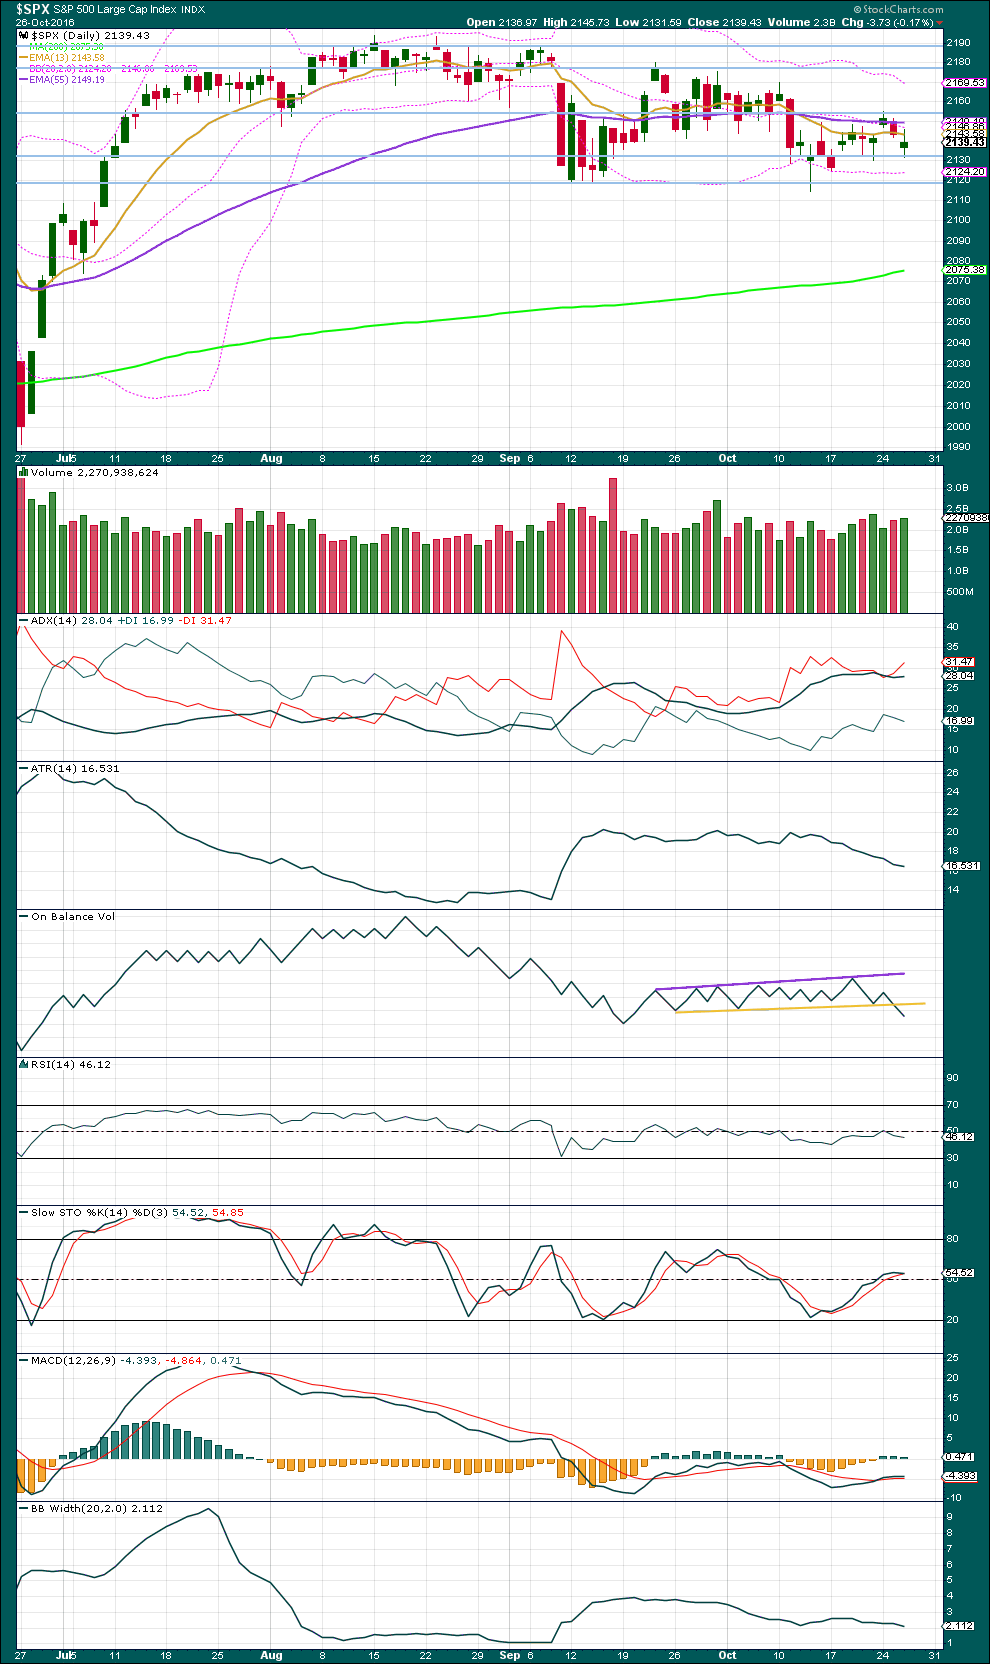
On Balance Volume moved lower today and price made a lower low and lower high. Overall, price moved down and there is support for this from volume. Although the day closed green, I will interpret the increase in volume as offering more support for downwards movement than upwards.
Volume for two days in a row shows support for downwards movement, but it is still lighter than the prior upwards day of the 21st of October.
ADX today has slightly increased. The -DX line is above the +DX line, so a downwards trend is indicated.
ATR disagrees though as it declined further today. Bollinger Bands also disagree as they contracted further. With two of these three indicates pointing to a consolidating market, the conclusion will be that a new downwards trend is unlikely at this stage.
Overall, for the last nine sessions price has made three small higher swing highs and three small higher swing lows. Overall, price is moving upwards.
Stochastics is now just about neutral. More upwards movement may be expected as an upwards swing within this consolidating market continues, until Stochastics is close to overbought and price reaches resistance. Resistance may be about 2,180 or 2,190.
MACD gave a weak buy signal three days ago with the MACD line crossing above the signal line. However, with both lines below zero this signal is weak.
On Balance Volume today gives a strong bearish signal. Normally, I would give this a lot of weight. But today there is a conflict here with OBV pointing to lower prices and divergence with price and VIX and price and the AD line pointing to higher prices. It is my judgement that divergence between price and VIX and the AD line has currently been more reliable, so will be considered to be of more weight..
VOLATILITY – INVERTED VIX CHART
Click chart to enlarge. Chart courtesy of StockCharts.com.
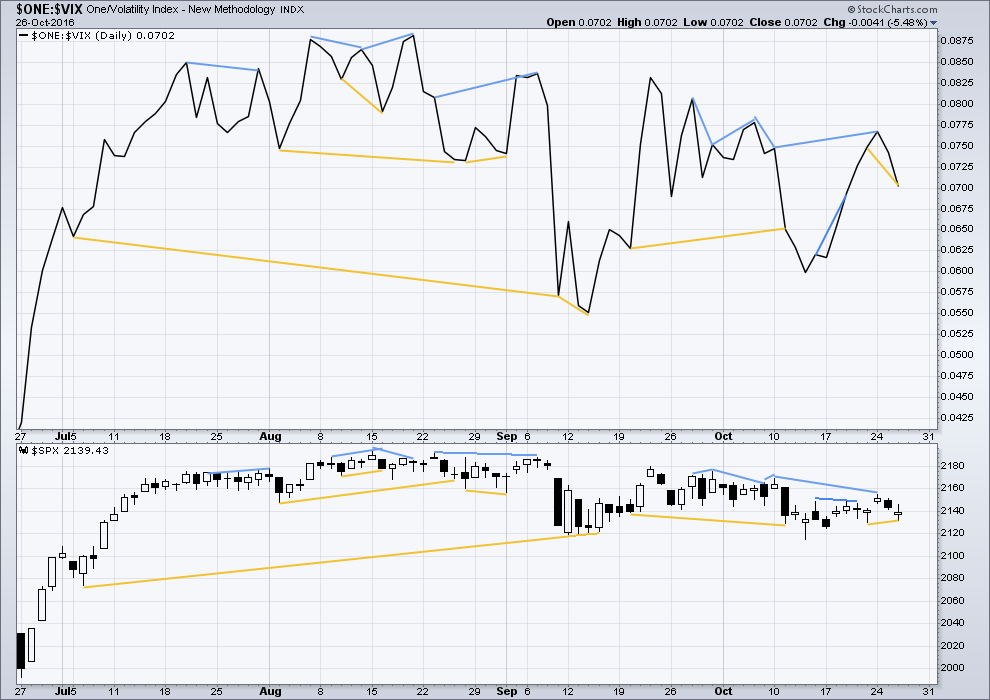
There are a few instances of multi day divergence between price and inverted VIX noted here. Bearish divergence is blue. Bullish divergence is yellow. It appears so far that divergence between inverted VIX and price is again working to indicate short term movements spanning one or two days.
The last bearish divergence noted two days ago has now been followed by two downwards days, so it should be assumed to now be resolved.
New bullish divergence is noted today: inverted VIX made a new low below the prior low of the 21st of October, but price has failed to make a corresponding new low. This is hidden bullish divergence and indicates weakness in price. It may be followed by one or two upwards days.
BREADTH – AD LINE
Click chart to enlarge. Chart courtesy of StockCharts.com.
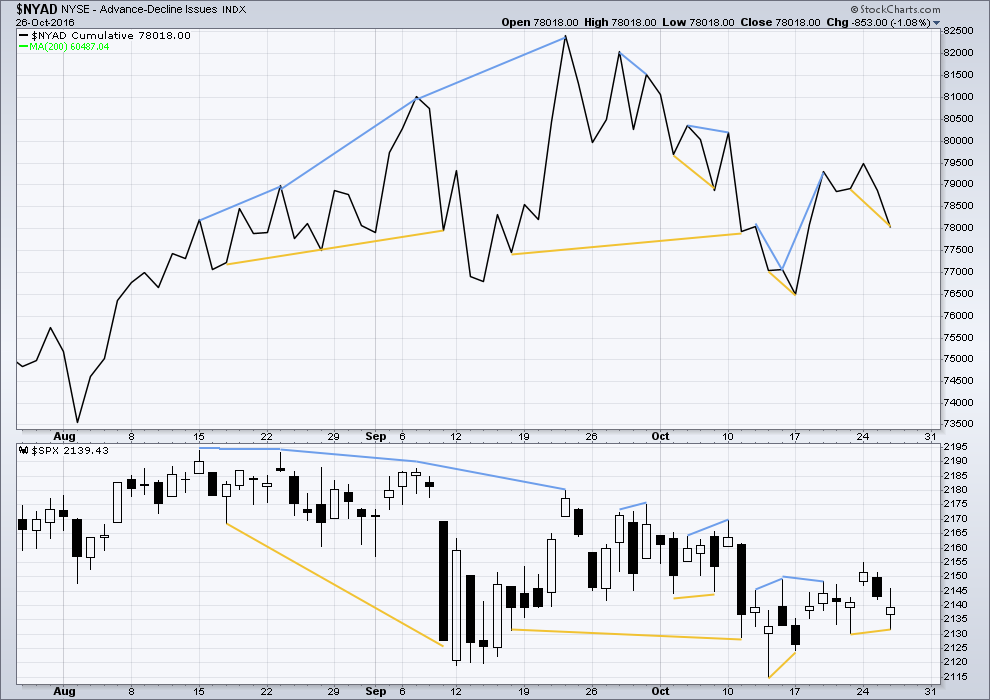
Short term bullish and bearish divergence is again working between price and the AD line to show the direction for the following one or two days.
The same hidden bullish divergence seen for inverted VIX is also seen with the AD line today: the AD line has made a substantial new low below the prior low of the 21st of October, but price has failed to make a corresponding low. This hidden bullish divergence indicates weakness in price. It may be expected to be followed by one or two days of upwards movement.
DOW THEORY
Major lows within the old bull market:
DJIA: 15,855.12 (15th October, 2014) – closed below on 25th August, 2015.
DJT: 7,700.49 (12th October, 2014) – closed below on 24th August, 2015.
S&P500: 1,821.61 (15th October, 2014) – has not closed below this point yet.
Nasdaq: 4,117.84 (15th October, 2014) – has not closed below this point yet.
Major highs within the bear market from November 2014:
DJIA: 17,977.85 (4th November, 2015) – closed above on 18th April, 2016.
DJT: 8,358.20 (20th November, 2015) – has not closed above this point yet.
S&P500: 2,116.48 (3rd November, 2015) – closed above this point on 8th June, 2016.
Nasdaq: 5,176.77 (2nd December, 2015) – closed above this point on 1st August, 2016.
Dow Theory Conclusion: Original Dow Theory still sees price in a bear market because the transportations have failed to confirm an end to that bear market. Modified Dow Theory (adding S&P and Nasdaq) has failed still to confirm an end to the old bull market, modified Dow Theory sees price still in a bull market.
This analysis is published @ 12:05 a.m. EST on 27th October, 2016.
Thanks for the update Rodney.
I suspect we are going to see some activity from Mr. Market prior to the election outcome. The banksters are clearly trying to do their best to keep the market aloft, but as we all know very well, Mr. Market does what he wills, banksters or not. FWIW, a second close below the upper BB has generally been a reliable trigger for a bearish trade on UVXY. One would imaging the same would be true for its opposite cousin SVXY (which did so today) but I personally have not traded that animal very much and it seems to march to the tune of a somewhat different drummer.
When it jumped above its upper BB back in August, it hung around that elevated area for quite some time before executing a second penetration in September prior to starting a decline, something UVXY does rarely. I am not sure why they should behave differently since they are supposed to be the opposite sides of the same coin. I suspect it may have something to do with the unrelenting bid we have seen under equities of late that is distorting the usual and customary rythm of the market.
It is also quite strange how volatility continued to shrink even when the market went absolutely nowhere…
I am certainly not a doctor. But I am not sure the market will be resuscitated until after the US Presidential election. The big money is waiting on the sidelines to place their bets and try to catch the move early. My guess is that if Clinton wins, the market will break up because we get more funny money and debt to drive it. If Trump wins, the market will break down fearing the game is over. Just my thoughts on a rainy day.
Oh yeah, I forgot to mention. I came back from the mountains earlier than anticipated because of weather. I had a blast and great freedom of the mind. As far as bears or bulls, I continued to see and hear bull elk. No bears or even signs. I did have a coyote walk right into my camp. I camp stealthily. Hunter chased it off quickly even though the coyote was bigger and I am sure a lot meaner. So the RMBBI is still pointing up.
Thanks for the extra charts Lara.
Have a great evening.
EURUSD monthly chart. Cycle C needs to be a five wave structure. So far that’s incomplete. The upper edge of the maroon channel is working reasonably well, with some small overshoots on the daily chart.
I’m going to start posting a chart every one or two days of other markets which are trending. We’ve got to start looking for trends to trade rather than focussing on this dead market of S&P.
EURUSD has breached an important trend line. Go short. This market is a Dead Man Walking. Target 0.59022 is for primary 3 to reach 1.618 X primary 1.
This is the daily chart. I’ll be using the more steeply sloped lilac trend line in the first instance to find points to add to my position; each time price comes up to touch the line I’ll enter another short. If that line is breached though I’ll hold off… something else may be happening mid term, a deeper correction, and I don’t want to ride out a negative position for too long.
The trend is down.
The shopping in Europe ought to be fantastic at the end of P3!!! 🙂
Darn… a good point. I guess I’ll have to be off to Italy 🙂
This market is about as dead as this forum.
The market will revive one day. It will start trending again, of that we may be 100% certain. It’s just not certain when or what direction. I expect down is when it’s going to really move fast.
But for now it’s a nightmare to analyse and trade 🙁 And TBH I’m not having much fun doing it.
Today we have a higher high and a higher low. That’s by definition upwards movement. Price bounced off support at the cyan trend line on the hourly chart so that line is strengthened, keep using it.
Minuette (ii) completes as an expanded flat correction. There are now five overlapping first and second waves. This thing should get moving soon!
If there is a Doctor in the house please could you resuscitate Mr Market. He’s looking pretty dead.
Mr. Market does indeed appear moribund does he not?
Personally, I don’t think Mr. Market is sleeping.
I think he is smoldering.
VIX is undertaking a sneaky but persistent march to the upside that suggests the level of market complacency we are seeing (94% of market participants see no downside risk in the market presently) is entirely at variance with the risk that actually exists. It may be that we will see some exogenous catalyst ignite the pile.
Opened up and reached a high around 2147. Since then we have dropped 15 SPX points to 2132. If the bulls do not turn this around soon, I suspect we will test 2114. If that does not hold we move toward 2095. We are at a critical juncture.
The bulls pushed it off right at the cyan support line. A good bounce.
We still have a series of small swing lows that are slowly stepping higher… and a higher (minute i) that was higher…. overall a choppy mess that is slightly trending upwards.
Which is not what we want to see. Those bulls sure are weak.
Morning!!
Good evening 🙂