
A green daily candlestick was expected for Monday, which is what happened.
The short term triangle on the Elliott wave count remains valid.
Summary: A red daily candlestick may unfold tomorrow within the sideways triangle, which continues. When sideways movement is done this week, a short sharp downwards thrust may be a false breakout, which should be followed quickly by a reversal and overall movement towards new all time highs.
Last monthly chart for the main wave count is here.
New updates to this analysis are in bold.
MAIN WAVE COUNT
WEEKLY CHART
Click chart to enlarge.
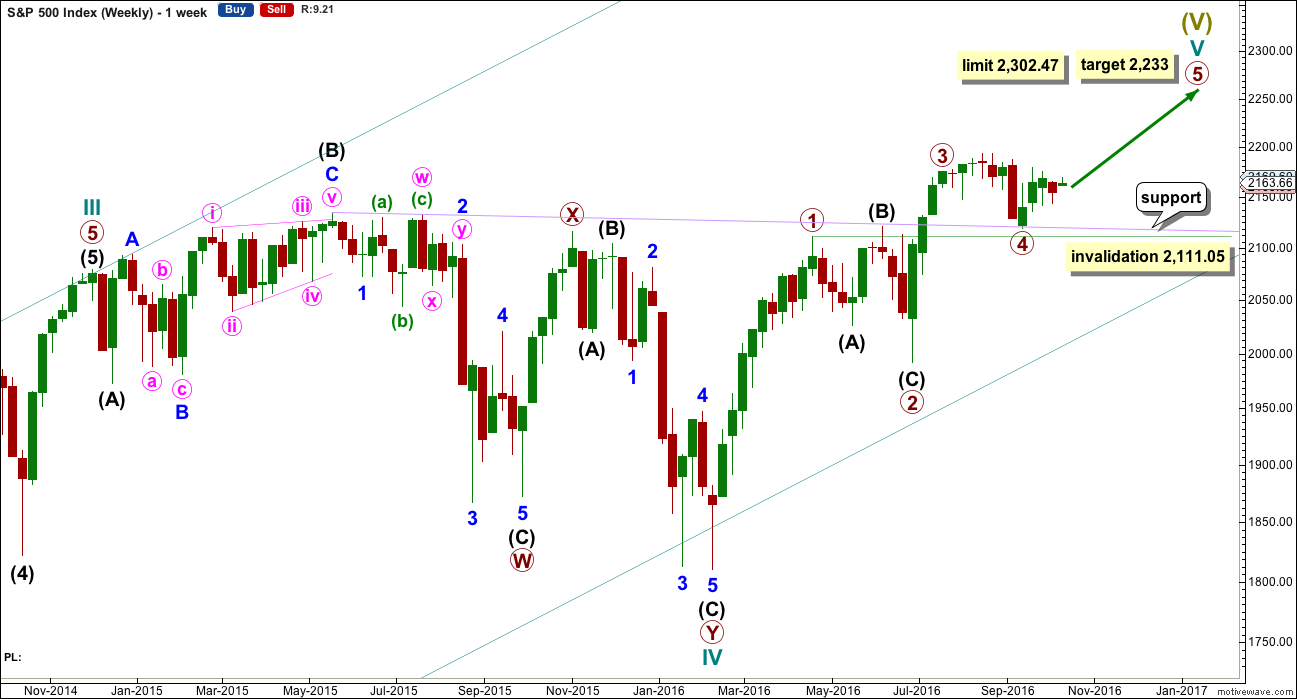
Cycle wave V must subdivide as a five wave structure. I have two wave counts for upwards movement of cycle wave V. This main wave count is presented first only because we should assume the trend remains the same until proven otherwise. Assume that downwards movement is a correction within the upwards trend, until proven it is not.
Primary wave 3 is shorter than primary wave 1, but shows stronger momentum and volume as a third wave normally does. Because primary wave 3 is shorter than primary wave 1 this will limit primary wave 5 to no longer than equality in length with primary wave 3, so that the core Elliott wave rule stating a third wave may not be the shortest is met. Primary wave 5 has a limit at 2,302.47.
Primary wave 2 was a shallow 0.40 expanded flat correction. Primary wave 4 may be exhibiting alternation as a more shallow combination.
Primary wave 4 may not move into primary wave 1 price territory below 2,111.05.
It is also possible to move the degree of labelling within cycle wave V all down one degree. It may be only primary wave 1 unfolding. The invalidation point for this idea is at 1,810.10. That chart will not be published at this time in order to keep the number of charts manageable. The probability that this upwards impulse is only primary wave 1 is even with the probability that it is cycle wave V in its entirety.
When the five wave structure upwards labelled primary wave 5 is complete, then my main wave count will move the labelling within cycle wave V all down one degree and expect that only primary wave 1 may be complete. The labelling as it is here will become an alternate wave count. This is because we should always assume the trend remains the same until proven otherwise. We should always assume that a counter trend movement is a correction, until price tells us it’s not.
DAILY CHART
Click chart to enlarge.
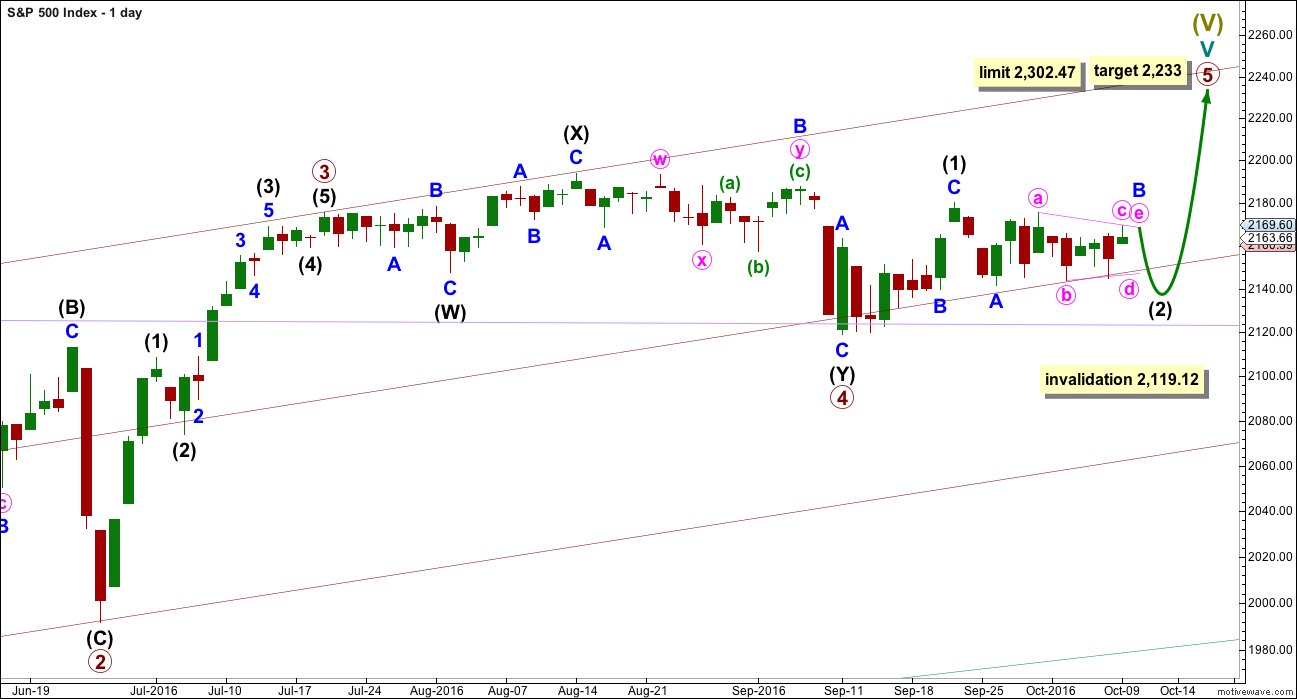
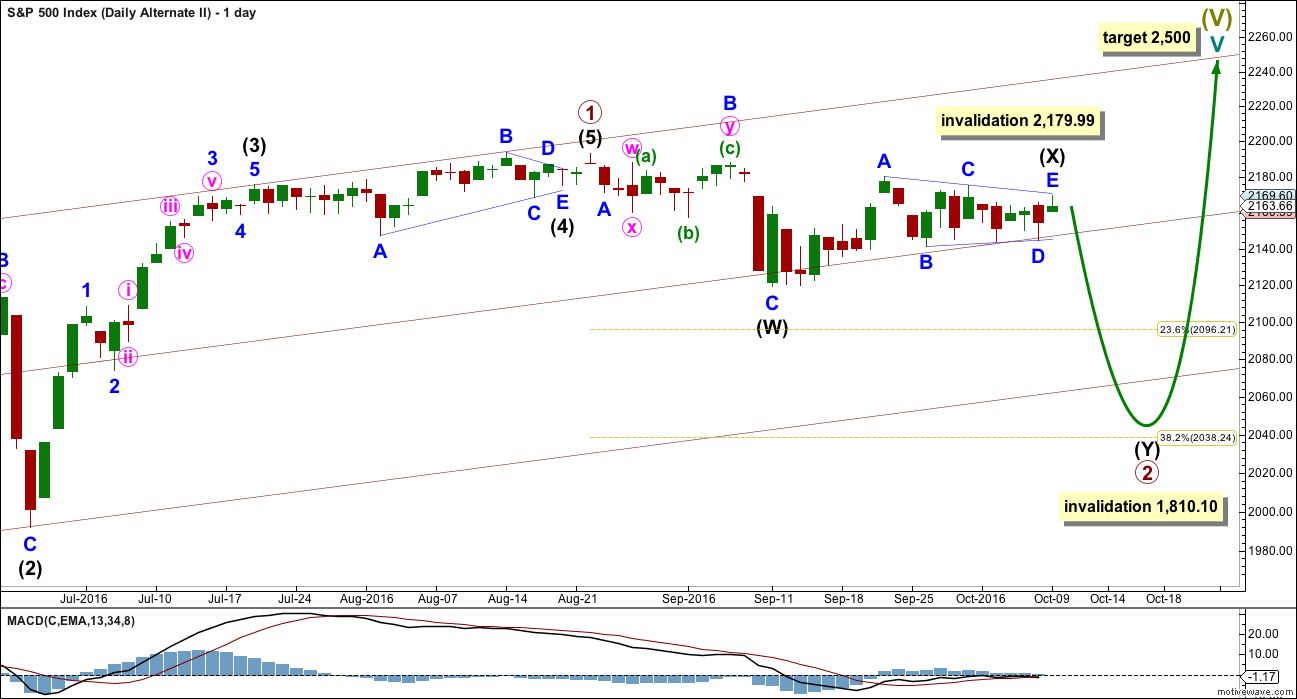
Primary wave 4 may be now complete as a double combination.
It is possible now that primary wave 4 could continue further as a triple, but because triples are very rare the probability of this is very low. If it is over here, then the proportion with primary wave 2 looks right. Within primary wave 5, no second wave correction may move beyond the start of its first wave below 2,119.12.
Primary wave 1 lasted 47 days, primary wave 2 was even in duration at 47 days, primary wave 3 lasted 16 days, and primary wave 4 has lasted 37 days. The proportions between these waves are acceptable.
If primary wave 5 has begun here, then at 2,233 it would reach 0.618 the length of primary wave 1.
At this stage, an impulse for primary wave 5 looks unlikely with invalidation of that idea at the hourly chart level. An ending diagonal now looks more likely for primary wave 5. Ending diagonals are choppy overlapping structures. The classic technical analysis equivalent is a rising wedge. They are terminal structures, doomed to full retracement at their end.
Ending diagonals require all sub-waves to subdivide as zigzags. Intermediate wave (1) fits as a zigzag and looks like a zigzag. Intermediate wave (2) will not fit as a completed zigzag, so the conclusion must be it will move lower. At this stage, it looks like a triangle is unfolding sideways, which may be minor wave B within a zigzag.
If primary wave 5 comes up to touch the upper edge of the maroon channel, it may end there.
HOURLY CHART
Click chart to enlarge.
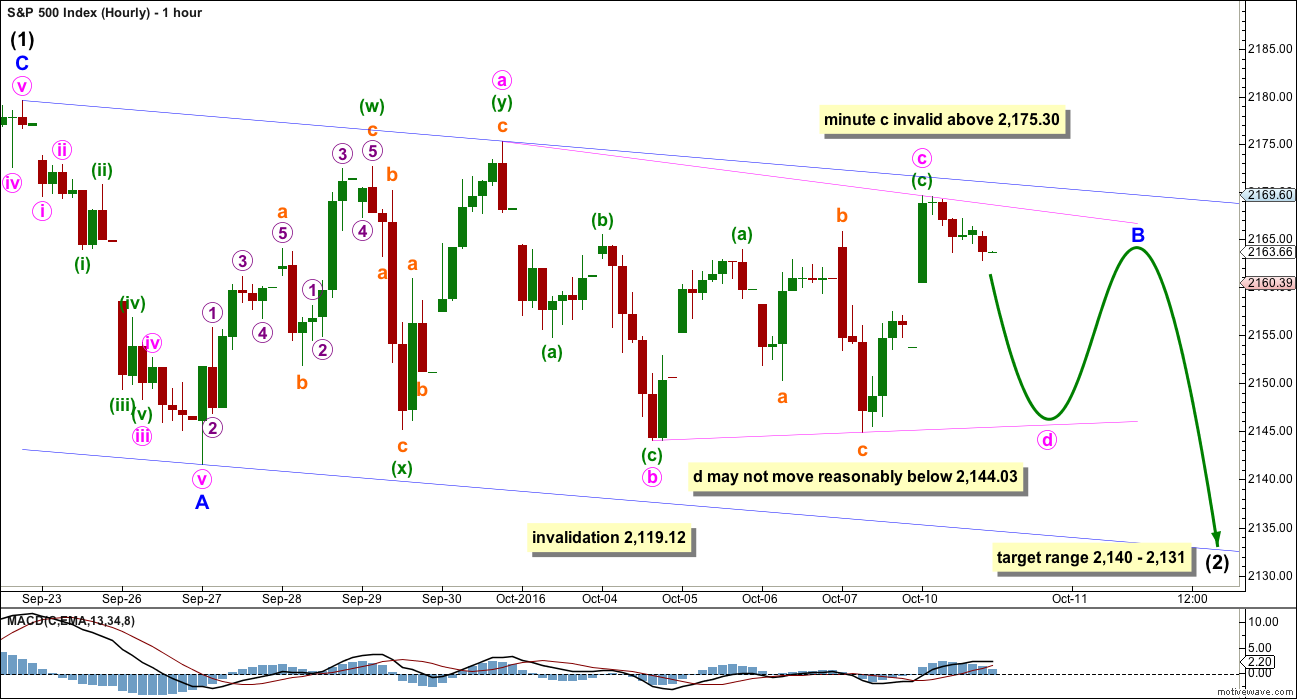
Second and fourth waves within diagonals have a normal depth of from 0.66 to 0.81 the prior wave. This gives a target range for intermediate wave (2) from 2,140 to 2,131.
Intermediate wave (2) must subdivide as a zigzag. It may not move beyond the start of intermediate wave (1) below 2,119.12.
Intermediate wave (1) lasted a Fibonacci eight days. Intermediate wave (2) has so far lasted twelve days. The next Fibonacci number in the sequence would see it continue for one more day to total a Fibonacci thirteen. At this stage, with the triangle still incomplete, it looks like intermediate wave (2) may not end in just one more day and may not exhibit a Fibonacci duration.
At this stage, price is moving sideways and MACD is hovering close to the zero line. It looks like a triangle is forming. The direction of entry into the triangle was down for minor wave A, so the breakout should be downwards in the same direction.
Minute wave c moved higher today within the triangle. If minute wave c continues any further, it may not move beyond the end of minute wave a above 2,175.30.
Minute wave d may not move reasonably below the end of minute wave b at 2,144.03. There are now two price points to draw the lower b-d trend line across, so minute wave d may end when price comes to find support at the lower triangle trend line.
The final wave for minute wave e is likely to fall short of the a-c trend line and may not move beyond the end of minute wave d.
Minor wave C downwards should be a short brief movement ending at least below the end of minor wave A at 2,141.55, so that a truncation is avoided.
ALTERNATE WAVE COUNT
WEEKLY CHART
Click chart to enlarge.
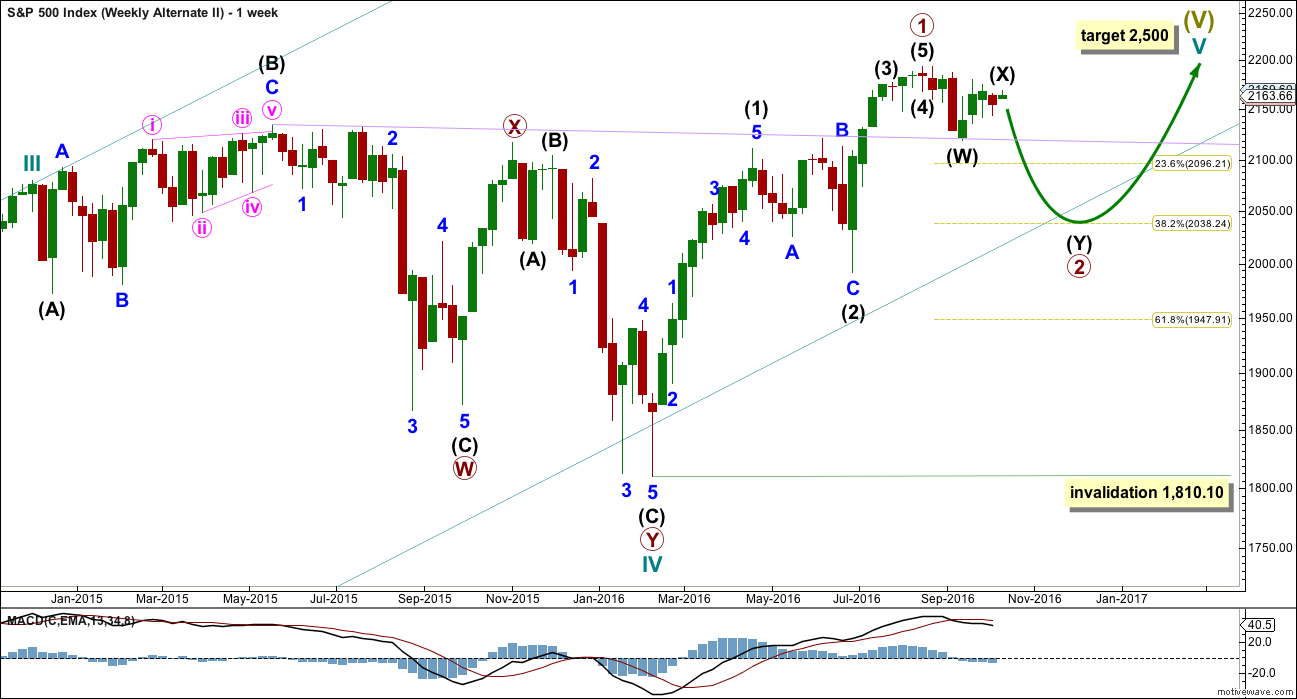
What if an impulse upwards is complete? The implications are important. If this is possible, then primary wave 1 within cycle wave V may be complete.
With downwards movement from the high of primary wave 1 now clearly a three and not a five, the possibility that cycle wave V and Super Cycle wave (V) are over has substantially reduced. This possibility would be eliminated if price can make a new all time high above 2,193.81.
If an impulse upwards is complete, then a second wave correction may be unfolding for primary wave 2. Expectations on how deep primary wave 2 is likely to be are now adjusted. It may be expected now to more likely only reach the 0.382 Fibonacci ratio about 2,038.
At this stage, it looks like price has found strong support at the lilac trend line.
Primary wave 2 may not move beyond the start of primary wave 1 below 1,810.10.
DAILY CHART
Click chart to enlarge.
If an impulse upwards is complete, then how may it subdivide and are proportions good?
Intermediate wave (1) was an impulse lasting 47 days. Intermediate wave (2) was an expanded flat lasting 47 days. Intermediate wave (3) fits as an impulse lasting 16 days, and it is 2.04 points short of 0.618 the length of intermediate wave (1). So far this alternate wave count is identical to the main wave count (with the exception of the degree of labelling, but here it may also be moved up one degree).
Intermediate wave (4) may have been a running contracting triangle lasting 22 days and very shallow at only 0.0027 the depth of intermediate wave (3). At its end it effected only a 0.5 point retracement. There is perfect alternation between the deeper expanded flat of intermediate wave (2) and the very shallow triangle of intermediate wave (4). All subdivisions fit and the proportion is good.
Intermediate wave (5) would be very brief at only 18.29 points. Intermediate wave (5) is 1.43 points longer than 0.056 the length of intermediate wave (1).
At this stage, primary wave 2 now has a completed zigzag downwards that did not reach the 0.236 Fibonacci ratio. It is very unlikely for this wave count that primary wave 2 is over there; the correction is too brief and shallow. Upwards movement labelled intermediate wave (X) is so far less than 0.9 the length of the prior wave down labelled intermediate wave (W). The minimum for a flat correction has not been met. Primary wave 2 may continue lower as a double zigzag. A second zigzag in the double may be required to deepen the correction closer to the 0.382 Fibonacci ratio.
Intermediate wave (W) lasted a Fibonacci 13 sessions. Intermediate wave (X) is now changed today to see a triangle unfolding sideways. X waves may subdivide as any corrective structure (including multiples), and a triangle is possible here.
If minor wave C within the triangle for intermediate wave (X) moves any higher, then it may not move beyond the end of minor wave A above 2,179.99. It is possible today that the triangle for intermediate wave (X) is over and the breakout downwards may come quickly.
Primary wave 2 may not move beyond the start of primary wave 1 below 1,810.10. A new low below this point would see the degree of labelling within cycle wave V moved up one degree. At that stage, a trend change at Super Cycle degree would be expected and a new bear market to span several years would be confirmed.
I will not publish an hourly chart for this alternate. The double zigzag of primary wave 2 is not looking right, so I do not have reasonable confidence in this wave count. Publication of an hourly chart for it would give it too much weight.
TECHNICAL ANALYSIS
WEEKLY CHART
Click chart to enlarge. Chart courtesy of StockCharts.com.
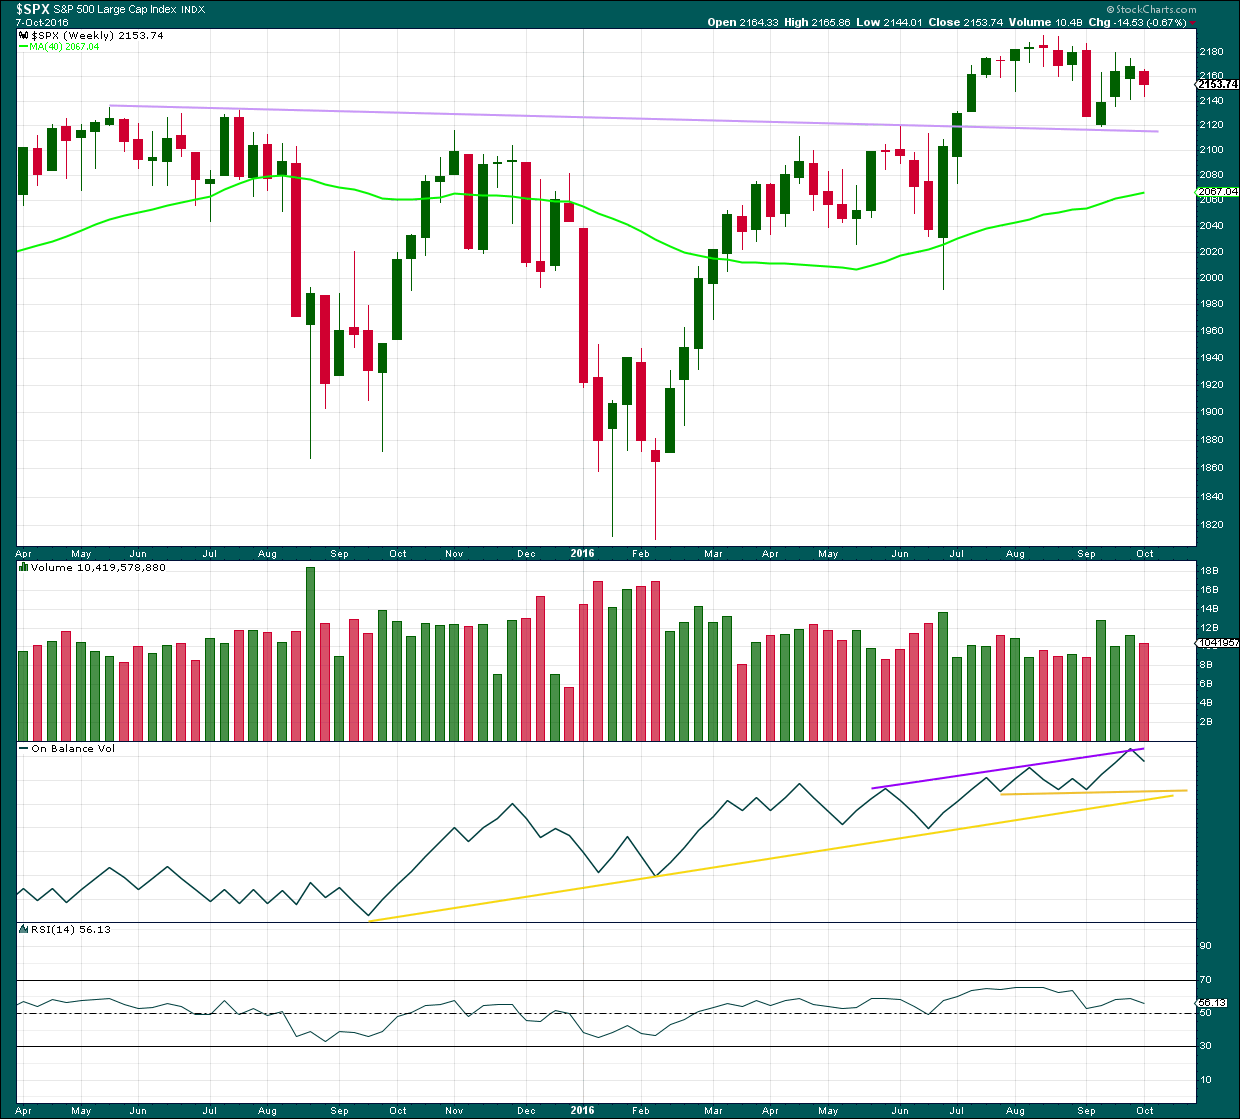
The lilac trend line has strong technical significance. Price has broken through resistance, turned down to test support, and is now moving up and away from this line. It is reasonable to conclude that a new all time high is a likely consequence of this typical behaviour.
The week before last closed green and has some support from volume. A further rise in price overall would be expected to follow. Last week is an inside week and closes red on lighter volume. The decline in price was not as well supported as the prior rise in price. This supports a bullish outlook for the mid term at least.
On Balance Volume the week before last came up to touch the purple trend line. It has found resistance and moved down from there. A break above the purple line would be a reasonably strong bullish signal. If OBV moves lower, it should find support at the yellow lines.
RSI is not extreme and exhibits no divergence at the weekly chart level to indicate weakness in price. There is room for price to rise further.
DAILY CHART
Click chart to enlarge. Chart courtesy of StockCharts.com.
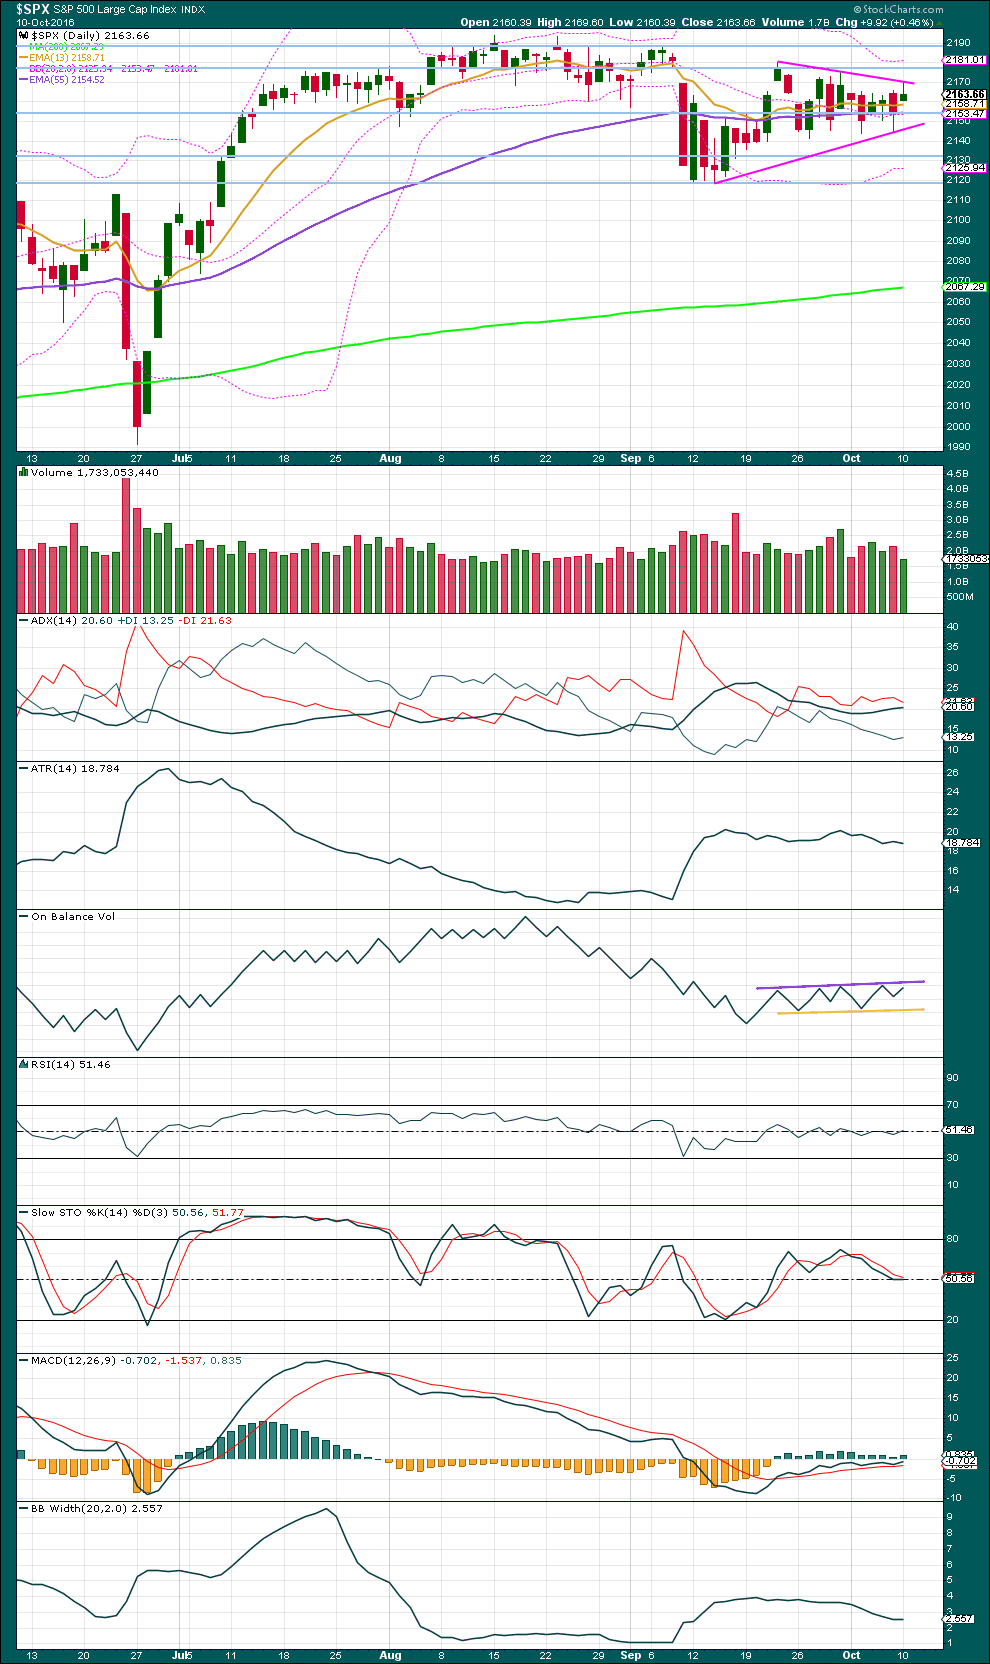
A triangle pattern is forming, delineated by pink lines. A break above or below the borders of the triangle on a day with an increase in volume would indicate a potential trend returning finally to this market.
An upwards day for Monday comes with lighter volume. Recent days have seen more support for downwards movement than upwards, a small suggestion that the breakout from the triangle may more likely be downwards than upwards. Overall, volume is now declining as price moves sideways.
ADX is above 15 and increasing, indicating a downwards trend is in place. The -DX line is above the +DX line. ATR and Bollinger Bands strongly disagree that this market is trending though, so ADX should be approached with skepticism today. ATR is declining and Bollinger Bands are contracting. With declining range and volatility, the idea of a triangle consolidating is more likely.
On Balance Volume now has a small sideways range reasonably clear, so the trend lines about it are redrawn at the end of this week. A break above the purple line would be bullish and may precede a movement from price. A break below the yellow line would be bearish and may precede a movement from price. OBV tends to work well with trend lines.
RSI is neutral. There is plenty of room for price to rise or fall.
Stochastics is rolling over before reaching overbought. It has not been able to reach extremes lately; expectations for it may currently be narrowed. It may be now indicating a small downwards swing.
VOLATILITY – INVERTED VIX CHART
Click chart to enlarge. Chart courtesy of StockCharts.com.
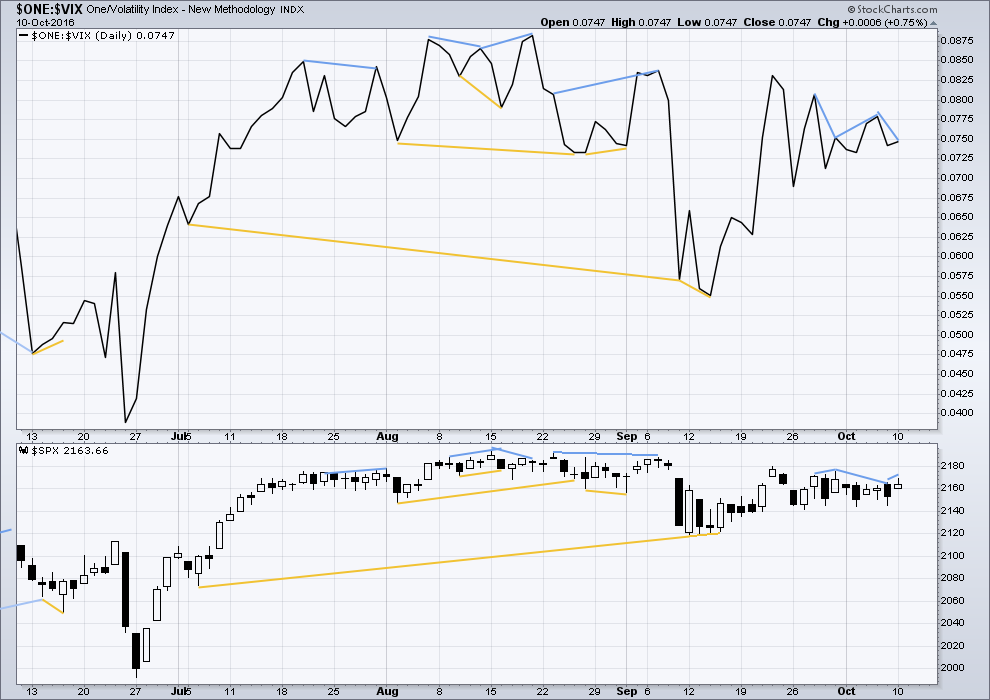
There are a few instances of multi day divergence between price and inverted VIX noted here. Bearish divergence is blue. Bullish divergence is yellow. It appears so far that divergence between inverted VIX and price is again working to indicate short term movements spanning one or two days.
There is new very short term divergence today between price and inverted VIX: price has made a new high today beyond the prior session, but inverted VIX has failed to make a corresponding new high. This is regular bearish divergence and indicates weakness for bulls. This may be followed by one or two days of downwards movement.
BREADTH – AD LINE
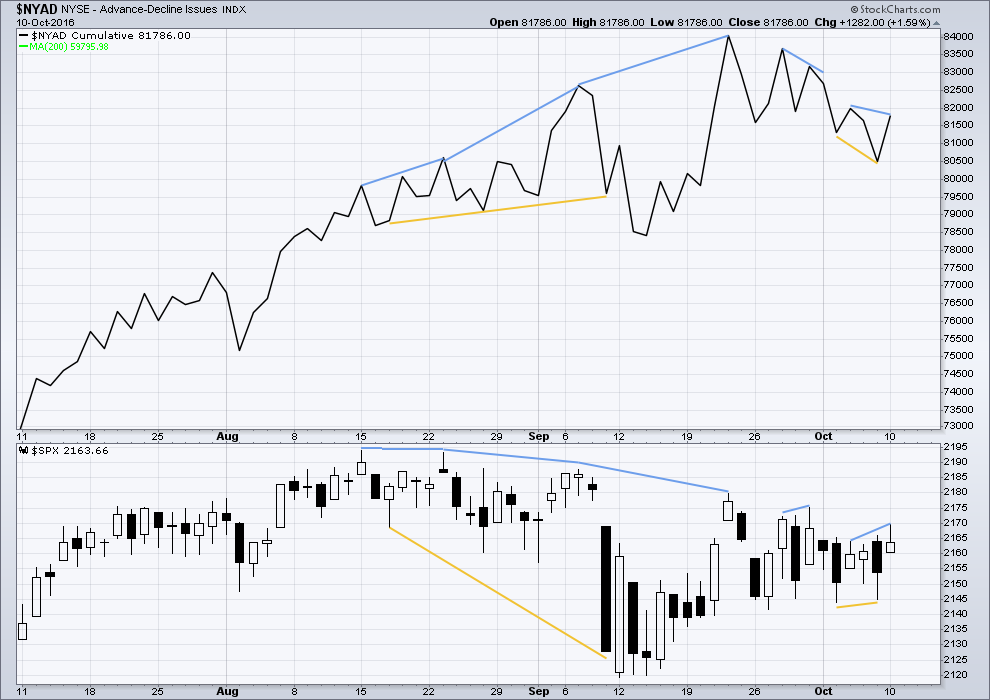
Click chart to enlarge. Chart courtesy of StockCharts.com.
There is support from market breadth as price is rising.
Short term bullish and bearish divergence is again working between price and the AD line to show the direction for the following one or two days.
There is new short term divergence between price and the AD line: price has made a new high above the prior high three days ago, but the AD line has made a lower high. This divergence is regular bearish divergence and indicates weakness in bulls.
DOW THEORY
Major lows within the old bull market:
DJIA: 15,855.12 (15th October, 2014) – closed below on 25th August, 2015.
DJT: 7,700.49 (12th October, 2014) – closed below on 24th August, 2015.
S&P500: 1,821.61 (15th October, 2014) – has not closed below this point yet.
Nasdaq: 4,117.84 (15th October, 2014) – has not closed below this point yet.
Major highs within the bear market from November 2014:
DJIA: 17,977.85 (4th November, 2015) – closed above on 18th April, 2016.
DJT: 8,358.20 (20th November, 2015) – has not closed above this point yet.
S&P500: 2,116.48 (3rd November, 2015) – closed above this point on 8th June, 2016.
Nasdaq: 5,176.77 (2nd December, 2015) – closed above this point on 1st August, 2016.
Dow Theory Conclusion: Original Dow Theory still sees price in a bear market because the transportations have failed to confirm an end to that bear market. Modified Dow Theory (adding S&P and Nasdaq) has failed still to confirm an end to the old bull market, modified Dow Theory sees price still in a bull market.
This analysis is published @ 08:50 p.m. EST.
While VIX has printed a long upper wick, it has not penetrated the upper BB; in fact it has not even tagged it so this is a bit strange after so long a consolidation period in the triangle. I really would have expected a capitulation spike on the C wave down – it has not happened, so that means folk are still quite bullish. I am currently a market agnostic. Have a great evening everyone, and see ya in the trenches! 🙂
Personally, I like to see a bit more fear and loathing at the end of corrective C wave out of a B triangle that lasted this long. There is still a remarkable amount of complacency in this market, a stunning witness to the prowess of the banksters in maintaining fear of the bankster permanent put and confidence that BTFD will prevail. On the sidelines for the time being…
I can see a completed structure up for Nasdaq. But every time I try to see the structure complete for the S&P I keep coming across the problem that downwards waves from the last ATH subdivide as threes, not fives.
So I am struggling so far to see a high in place for S&P at Super Cycle degree. But I would expect it to happen this month.
I agree. For that reason it is hard to go full-bore bearish for the short term. Scalping the moves continues to presently be the smartest trading approach imho…
If C is over, we should see a rapid ramp up towards the close and VIX should head South…..
Here’s the alternate on the hourly chart. Only if price makes a new low below 2,119.12 should this be considered seriously.
Thanks for the updates Lara. Much appreciated.
FWIW, all the moves off the lows today looking corrective…unless the bulls can muster some muscle, this thing could get ugly and I mean in a big hurry. VIX shows no sign of re-treating and until it does, it means more pain for the bulls….
I had minor wave B wrong 🙁 It was completed as a combination: zigzag – x – regular flat.
Now minor C down is also likely complete. It has hit the channel, it is equal in length with minor A, and its structure is complete. Now intermediate (2) has lasted a Fibonacci 13 days.
Intermediate (3) up should begin exactly from here.
As much as I like watching he exploding green in my volatility positions, I am staying disciplined and taking profits. If the primary second wave scenario is playing out, we’ve got a ways down to go and there will be ample time to get re-positioned. If the market reverses from here, then we will take action accordingly…. 🙂
We will know that if 2119 doesn’t hold, correct?
Yep! 2111.05 also important…
The bulls appear to be in a panic about surrendering 2140. They just don’t seem to want to let it go. I am not sure why they are so worried. 2100 is more critical imo…looks like they lost that fight.
2100 the next critical pivot
Thanks for the response V. I will wait.
Most welcome….!
87 soon!
Move down today taking place with relatively low volume and that is not a good sign for the bears. Unless it picks up considerably prior to the close, the main count will probably play out with this move down completing a C wave in just one day. Let’s see if 2140 holds – quite a dog fight underway….
So should we be going with the alternate counts, or should we wait?
I would definitely wait for the reversal. VIX should lead the way in a spike down if the wave is going to complete today.
O.K .folks, the bots and banksters have arrived to buy the 2140 SPX support. If they can hold it today, I expect we will head back up into the boring trading range of the last few months. Not sure what that means for the EW count but this market is for all intents (trading anyway) and purposes, as moribund as they come…
The 30 YR bond ETF TLT is putting in a temporary bottom today after a five wave impulse down. We should see a counter-trend three wave bounce to the upside over the next week or two. I am selling the October week 4 131/127 bull call spreads for a limit credit of 0.40 per contract while waiting for the down-trend to resume. Risk is of course 400 per contract if TLT trading beIow 127 at expiration and spreads held to expiration (which a’int gonna happen!) Closed out my bearish spreads two days ago.
No charge!! 🙂 🙂
At the time I made the post about defending trades, there was actually an on-going battle in a short position I had in CBI. I think the guys on the other side of the trade got a few of their friends to apply some serious pressure to my position and bid the thing up way past where it should have gone in an effort to shake me out of the position. I almost talked about it on the forum but was afraid I might jinx it! Price was starting to approach the upper BB so I knew something would have to give. I just kept rolling the position and adding to my short stake as I knew exactly what was going on. Looks to me like they are headed for the exits so you can kick ’em while they are down! 🙂
Looks to me like the triangle was invalidated. Looks like wave b was a w-x-y combination. Now in wave c that looks to me to be almost complete (in wave 4). anyone else have a different interpretation?
The wave structure for both triangle counts may have simply been complete. Lara in fact showed the alternate as being done. SPX 2140 is a key level to watch. I expect we will break it to the downside.
Exactly. B was complete.
Prechter just fired off an interim report on the NASDAQ 100, that it completed a diagonal at its new ATH yesterday. He also thinks SPX completed its triangle yesterday per Lara’s alternate count…
A break below 2040 would to me suggest that the triangle is complete and a downward break-out is underway. The durations of the triangle may result in a deeper move than our expected targets imo…
Nice pop on all long volatility positions. Will be holding through the month of October as I think we are just getting started…
TODAY is an earnings and revenue story…
Alcoa… Both earnings and revenue bad!
Chipotle… Chipotle shares fall, report shows chain still struggling to win customers back
A sign of things (Earnings Reports) to come and I am certain of that for this Quarter!
Nothing new. Top and bottom line revenues have been declining for six straight quarters. Stock re-purchases (plus dividends) are now at a whopping 128% of revenues for the period. Go figure!
Taking profits on diamond bear spread. Waiting for break of Friday’s lows to reload.
Very blatant pumping after hours yesterday. If I am reading right, after hours SPX traded down to vicinity of 2140 just before being goosed. Do these after hours numbers mean anything to Elliott Wave counts?
no,,, you are welcome
What the Doc said. After hours mean nothing to the EW count. I’m only analysing the NY session for the cash market.