
Upwards movement breached the invalidation point on the hourly chart, which was very close by at 2,154.77. The short term structure is changed.
Summary: Sideways movement for another few days may complete a triangle, which should break out downwards for a short sharp thrust to end in a range from 2,140 to 2,131. Thereafter, price should turn up to make a new high above 2,179.58.
Last monthly chart for the main wave count is here.
New updates to this analysis are in bold.
MAIN WAVE COUNT
WEEKLY CHART
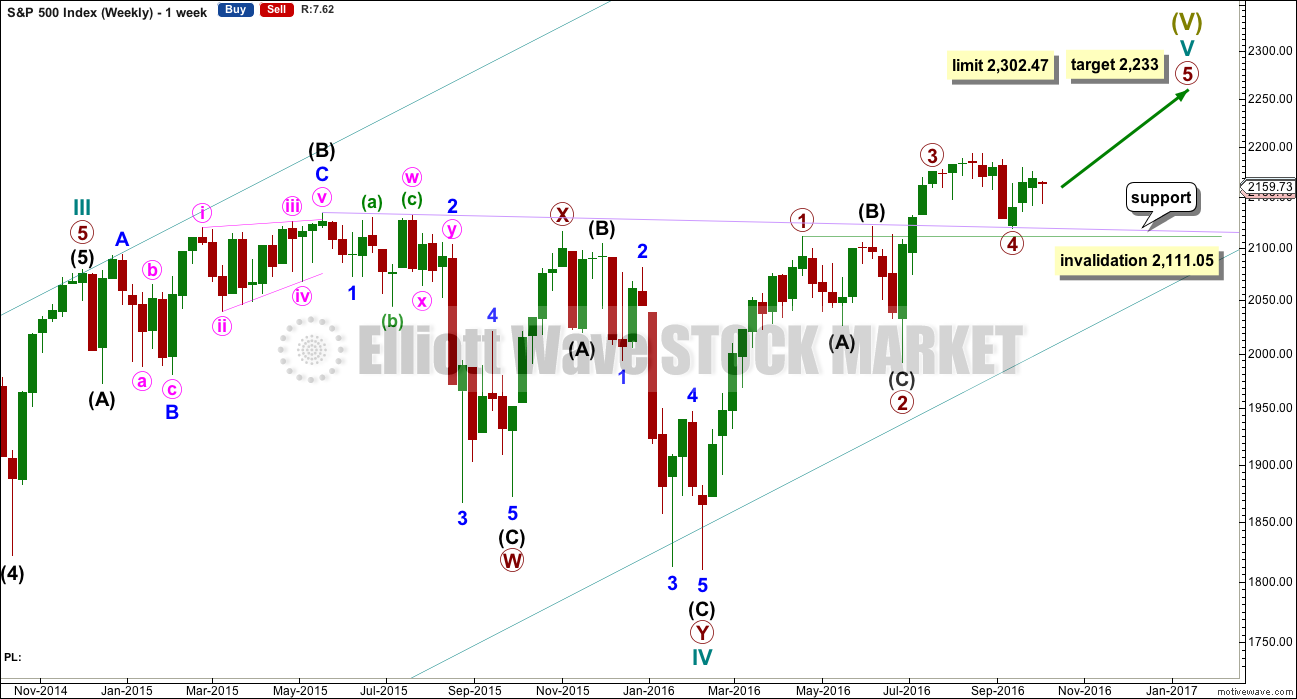
Click chart to enlarge.
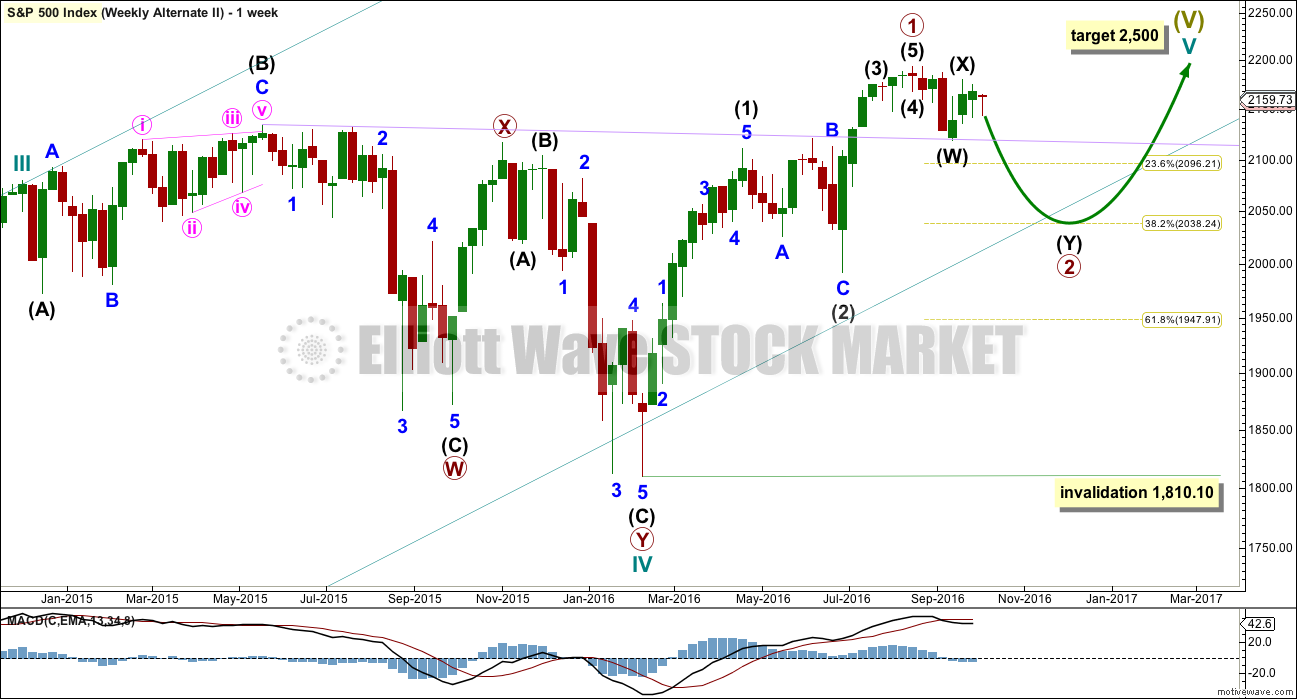
Cycle wave V must subdivide as a five wave structure. I have two wave counts for upwards movement of cycle wave V. This main wave count is presented first only because we should assume the trend remains the same until proven otherwise. Assume that downwards movement is a correction within the upwards trend, until proven it is not.
Primary wave 3 is shorter than primary wave 1, but shows stronger momentum and volume as a third wave normally does. Because primary wave 3 is shorter than primary wave 1 this will limit primary wave 5 to no longer than equality in length with primary wave 3, so that the core Elliott wave rule stating a third wave may not be the shortest is met. Primary wave 5 has a limit at 2,302.47.
Primary wave 2 was a shallow 0.40 expanded flat correction. Primary wave 4 may be exhibiting alternation as a more shallow combination.
Primary wave 4 may not move into primary wave 1 price territory below 2,111.05.
It is also possible to move the degree of labelling within cycle wave V all down one degree. It may be only primary wave 1 unfolding. The invalidation point for this idea is at 1,810.10. That chart will not be published at this time in order to keep the number of charts manageable. The probability that this upwards impulse is only primary wave 1 is even with the probability that it is cycle wave V in its entirety.
When the five wave structure upwards labelled primary wave 5 is complete, then my main wave count will move the labelling within cycle wave V all down one degree and expect that only primary wave 1 may be complete. The labelling as it is here will become an alternate wave count. This is because we should always assume the trend remains the same until proven otherwise. We should always assume that a counter trend movement is a correction, until price tells us it’s not.
DAILY CHART
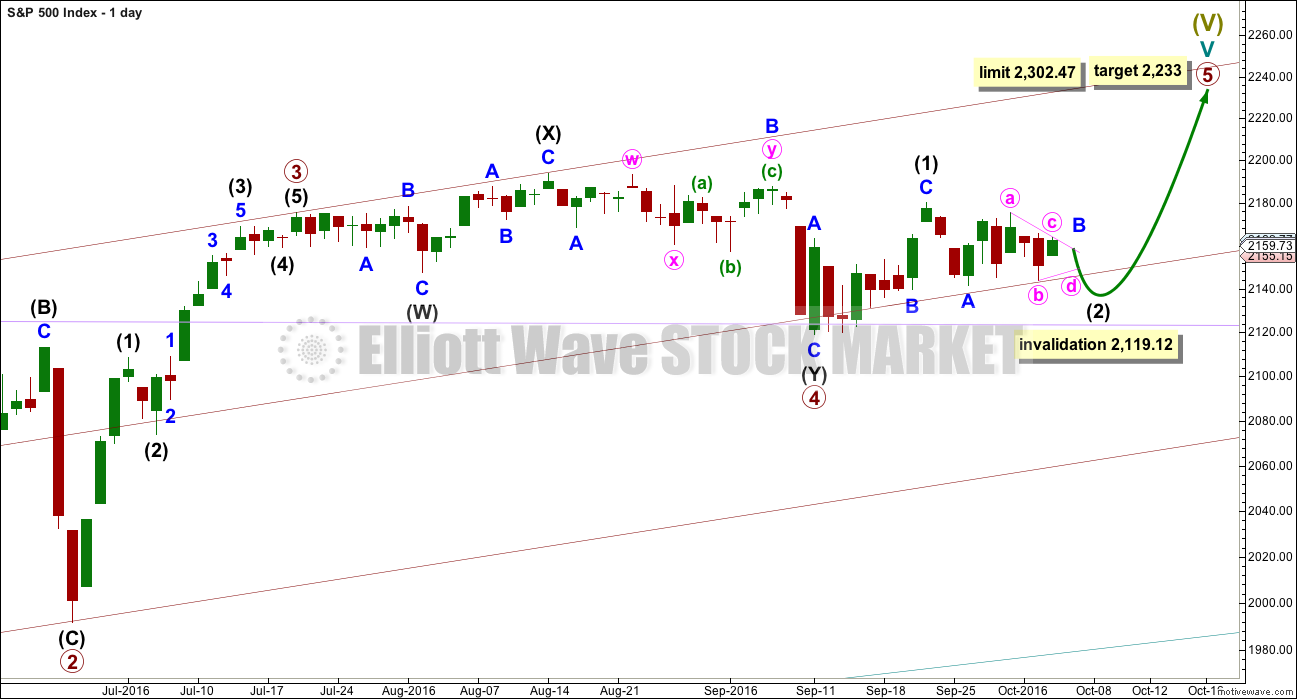
Click chart to enlarge.
Primary wave 4 may be now complete as a double combination.
It is possible now that primary wave 4 could continue further as a triple, but because triples are very rare the probability of this is very low. If it is over here, then the proportion with primary wave 2 looks right. Within primary wave 5, no second wave correction may move beyond the start of its first wave below 2,119.12.
Primary wave 1 lasted 47 days, primary wave 2 was even in duration at 47 days, primary wave 3 lasted 16 days, and primary wave 4 has lasted 37 days. The proportions between these waves are acceptable.
If primary wave 5 has begun here, then at 2,233 it would reach 0.618 the length of primary wave 1.
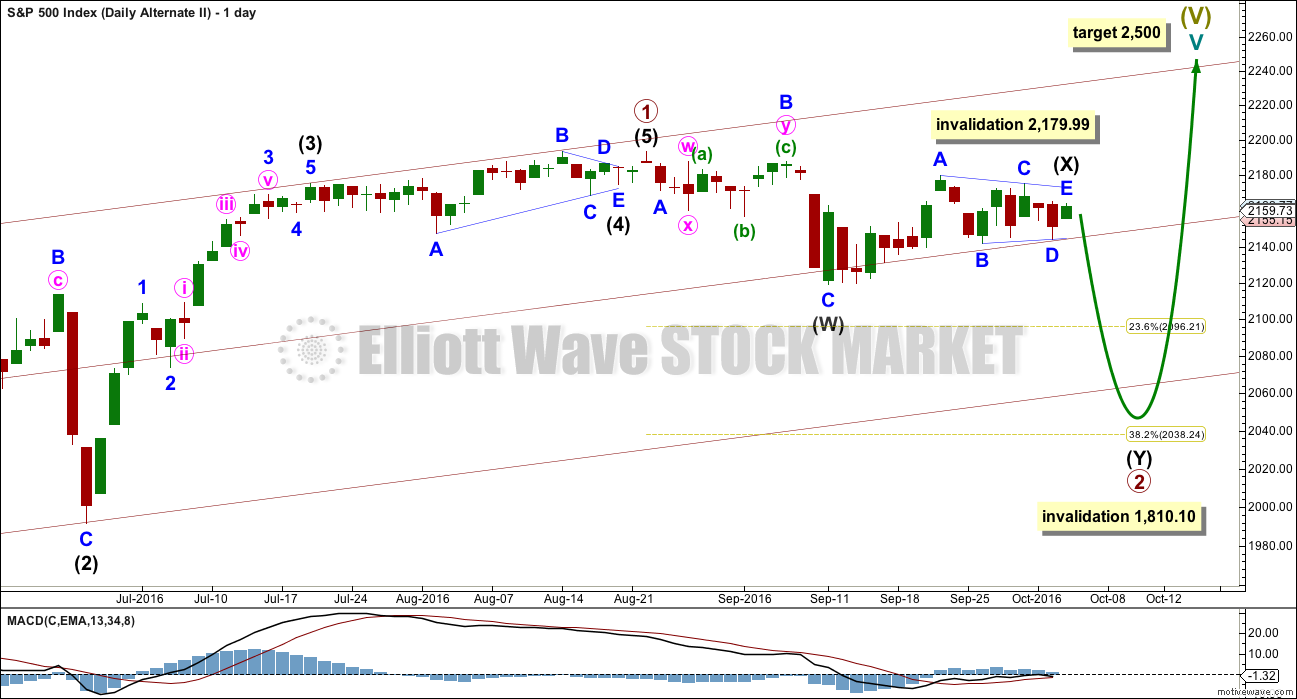
At this stage, an impulse for primary wave 5 looks unlikely with invalidation of that idea at the hourly chart level. An ending diagonal now looks more likely for primary wave 5. Ending diagonals are choppy overlapping structures. The classic technical analysis equivalent is a rising wedge. They are terminal structures, doomed to full retracement at their end.
Ending diagonals require all sub-waves to subdivide as zigzags. Intermediate wave (1) fits as a zigzag and looks like a zigzag. Intermediate wave (2) will not fit as a completed zigzag, so the conclusion must be it will move lower. At this stage, it looks like a triangle is unfolding sideways, which may be minor wave B within a zigzag.
If primary wave 5 comes up to touch the upper edge of the maroon channel, it may end there.
HOURLY CHART
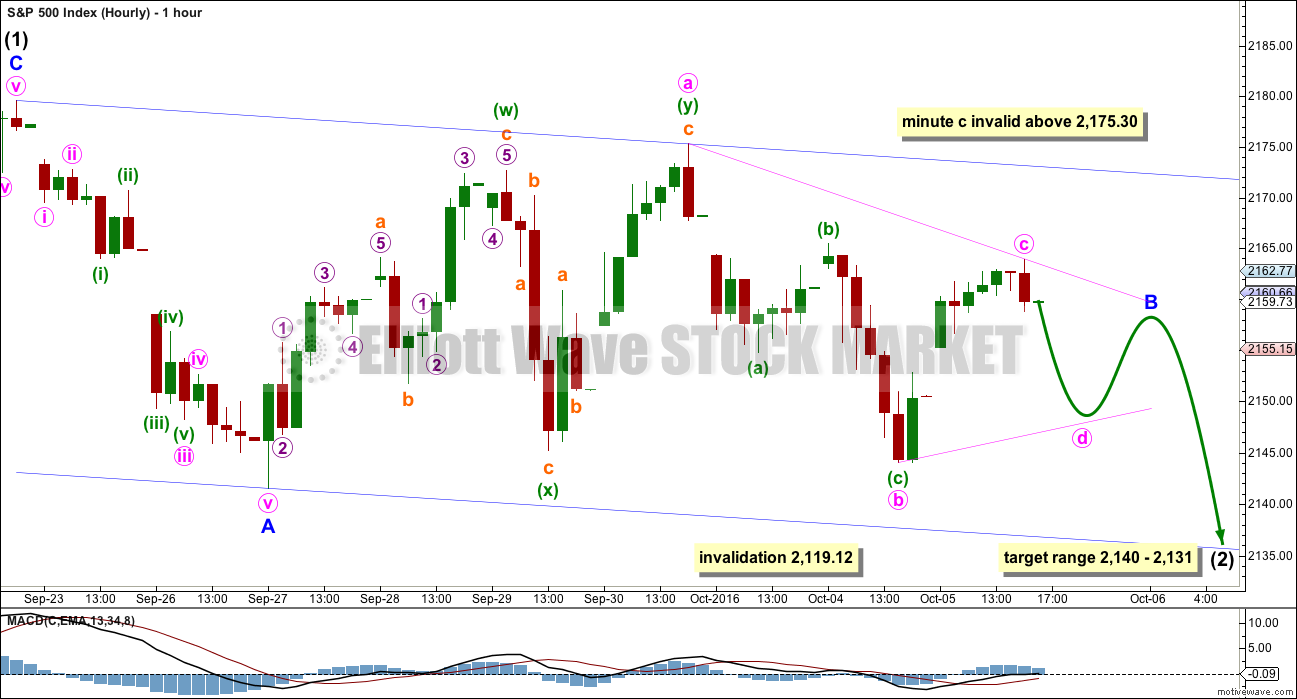
Click chart to enlarge.
Second and fourth waves within diagonals have a normal depth of from 0.66 to 0.81 the prior wave. This gives a target range for intermediate wave (2) from 2,140 to 2,131.
Intermediate wave (2) must subdivide as a zigzag. It may not move beyond the start of intermediate wave (1) below 2,119.12.
Intermediate wave (1) lasted a Fibonacci eight days.
At this stage, price is moving sideways and MACD is hovering close to the zero line. It looks like a triangle is forming. The direction of entry into the triangle was down for minor wave A, so the breakout should be downwards in the same direction.
Within the triangle of minor wave B, if minute wave c moves higher tomorrow, which has a reasonable probability, then it may not move beyond the end of minute wave a above 2,175.30. When minute wave c is complete, then minute wave d may not move reasonably below the end of minute wave b at 2,144.03. The final wave for minute wave e is likely to fall short of the a-c trend line and may not move beyond the end of minute wave d.
When the triangle is complete, then minor wave C downwards should be a short brief movement ending at least below the end of minor wave A at 2,141.55, so that a truncation is avoided.
Overall, this whole structure may now take a few more days. Intermediate wave (2) may total a Fibonacci thirteen days if it continues now for another four.
I have spent some time today to see if it is possible that intermediate wave (2) is already over, and at this stage I have not been able to find a wave count which fits that idea. The conclusion for now is that it is most likely intermediate wave (2) is incomplete.
ALTERNATE HOURLY CHART
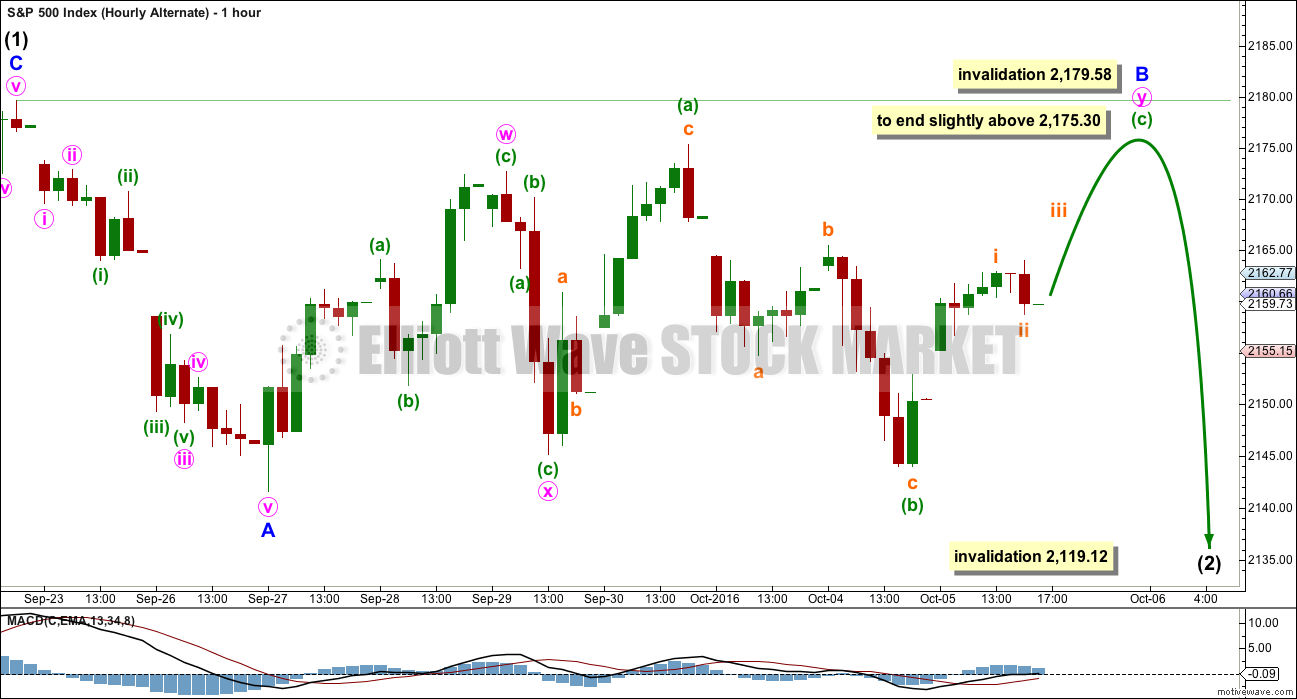
Click chart to enlarge.
It is important when a triangle looks like it is unfolding to always consider alternates. At this stage, this is the best alternate I can see.
Minor wave B may not be a triangle. It may be moving further sideways as a double combination. The first structure in the combination may be a zigzag labelled minute wave w. The double may be joined by a quick deep zigzag in the opposite direction labelled minute wave x. The second structure in the double combination may be a regular flat labelled minute wave y, which would be incomplete.
Within minute wave y, the correction for minuette wave (b) is a 1.04 length of minuette wave (a). Minute wave y would be classified as a regular flat correction. These normally have C waves which move only slightly beyond the end of the A wave. Minuette wave (c) should end slightly above the end of minuette wave (a) at 2,175.30 to avoid a truncation, but minor wave B may not move beyond the start of minor wave A above 2,179.58.
In the unlikely event that price invalidates both these hourly wave counts with a move very soon above 2,179.58, then my analysis for both hourly charts would be wrong and intermediate wave (3) upwards would be underway.
ALTERNATE WAVE COUNT
WEEKLY CHART
Click chart to enlarge.
What if an impulse upwards is complete? The implications are important. If this is possible, then primary wave 1 within cycle wave V may be complete.
With downwards movement from the high of primary wave 1 now clearly a three and not a five, the possibility that cycle wave V and Super Cycle wave (V) are over has substantially reduced. This possibility would be eliminated if price can make a new all time high above 2,193.81.
If an impulse upwards is complete, then a second wave correction may be unfolding for primary wave 2. Expectations on how deep primary wave 2 is likely to be are now adjusted. It may be expected now to more likely only reach the 0.382 Fibonacci ratio about 2,038.
At this stage, it looks like price has found strong support at the lilac trend line.
Primary wave 2 may not move beyond the start of primary wave 1 below 1,810.10.
DAILY CHART
Click chart to enlarge.
If an impulse upwards is complete, then how may it subdivide and are proportions good?
Intermediate wave (1) was an impulse lasting 47 days. Intermediate wave (2) was an expanded flat lasting 47 days. Intermediate wave (3) fits as an impulse lasting 16 days, and it is 2.04 points short of 0.618 the length of intermediate wave (1). So far this alternate wave count is identical to the main wave count (with the exception of the degree of labelling, but here it may also be moved up one degree).
Intermediate wave (4) may have been a running contracting triangle lasting 22 days and very shallow at only 0.0027 the depth of intermediate wave (3). At its end it effected only a 0.5 point retracement. There is perfect alternation between the deeper expanded flat of intermediate wave (2) and the very shallow triangle of intermediate wave (4). All subdivisions fit and the proportion is good.
Intermediate wave (5) would be very brief at only 18.29 points. Intermediate wave (5) is 1.43 points longer than 0.056 the length of intermediate wave (1).
At this stage, primary wave 2 now has a completed zigzag downwards that did not reach the 0.236 Fibonacci ratio. It is very unlikely for this wave count that primary wave 2 is over there; the correction is too brief and shallow. Upwards movement labelled intermediate wave (X) is so far less than 0.9 the length of the prior wave down labelled intermediate wave (W). The minimum for a flat correction has not been met. Primary wave 2 may continue lower as a double zigzag. A second zigzag in the double may be required to deepen the correction closer to the 0.382 Fibonacci ratio.
Intermediate wave (W) lasted a Fibonacci 13 sessions. Intermediate wave (X) is now changed today to see a triangle unfolding sideways. X waves may subdivide as any corrective structure (including multiples), and a triangle is possible here.
If minor wave C within the triangle for intermediate wave (X) moves any higher, then it may not move beyond the end of minor wave A above 2,179.99. It is possible today that the triangle for intermediate wave (X) is over and the breakout downwards may come quickly.
Primary wave 2 may not move beyond the start of primary wave 1 below 1,810.10. A new low below this point would see the degree of labelling within cycle wave V moved up one degree. At that stage, a trend change at Super Cycle degree would be expected and a new bear market to span several years would be confirmed.
I will not publish an hourly chart for this alternate. The double zigzag of primary wave 2 is not looking right, so I do not have reasonable confidence in this wave count. Publication of an hourly chart for it would give it too much weight.
TECHNICAL ANALYSIS
WEEKLY CHART
Click chart to enlarge. Chart courtesy of StockCharts.com.
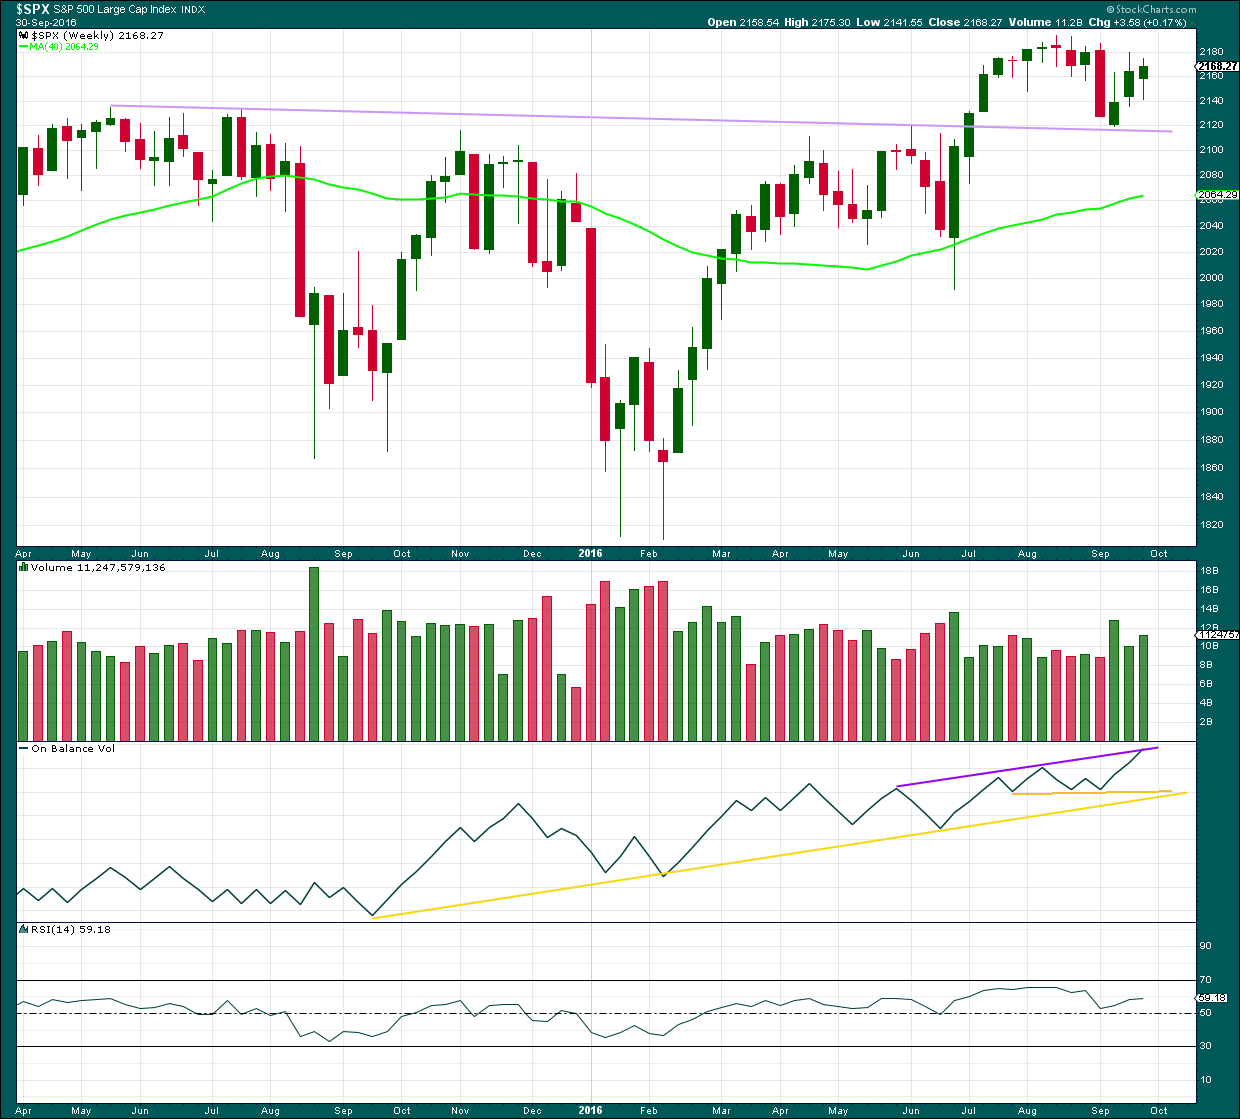
The lilac trend line has strong technical significance. Price has broken through resistance, turned down to test support, and is now moving up and away from this line. It is reasonable to conclude that a new all time high is a likely consequence of this typical behaviour.
Last week closed green and has some support from volume. A further rise in price overall would be expected to follow.
On Balance Volume last week came up to touch the purple trend line. It may find some resistance there. A break above this line would be a weak bullish signal. There is divergence with the high last week and the prior high seven weeks ago: OBV has made a higher high but price has made a lower high. This divergence is bearish and indicates weakness in price. This old bull market continues to show internal weakness.
RSI is not extreme and exhibits no divergence at the weekly chart level to indicate weakness in price. There is room for price to rise further.
DAILY CHART
Click chart to enlarge. Chart courtesy of StockCharts.com.
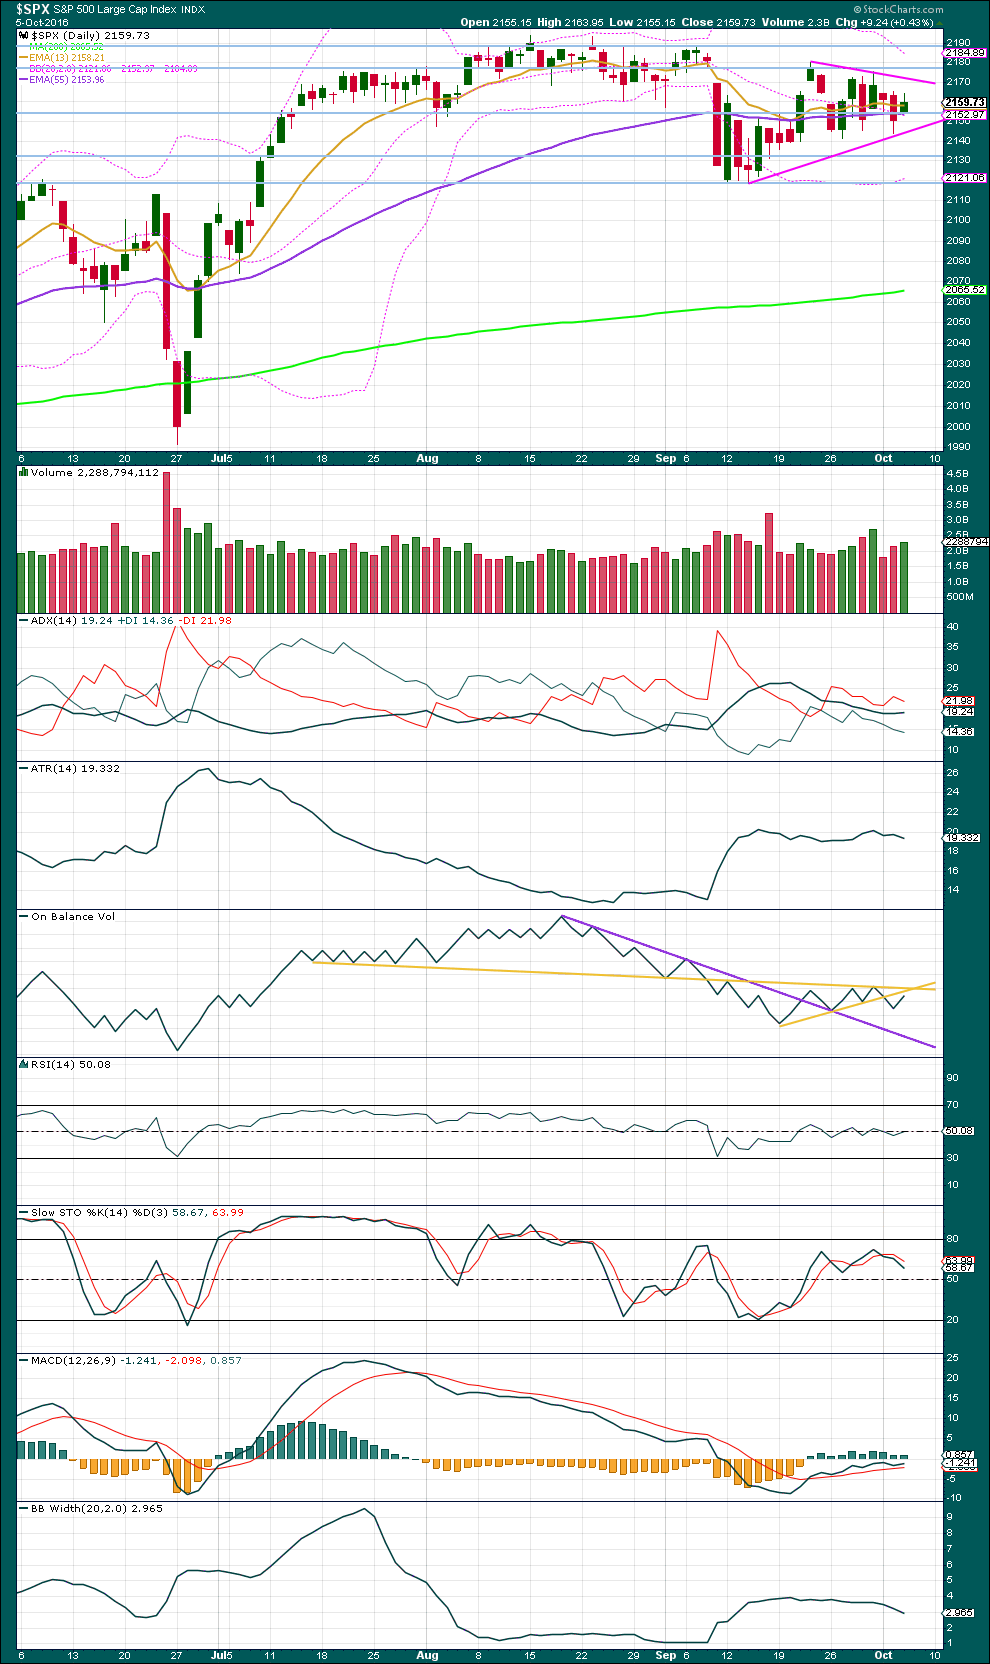
A small upwards inside day today has some support from volume. Price remains within a triangle pattern delineated by pink lines. The lower line is today adjusted. When price breaks out of the triangle (either up or down), then it may be expected to move about 60 points using the measure rule. The breakout should come on a day with an increase in volume for reliability.
ADX today increased and is above 15. ADX indicates a downwards trend is in place. ATR and Bollinger Bands both disagree though: they are both declining. With price range bound, it does not look like there is a trend today.
On Balance Volume gave a weak bearish signal as it broke below the short yellow line. OBV today has come up towards that line, which is now also were the longer yellow line sits. OBV may find resistance here, this may force price to move lower tomorrow.
RSI remains almost right on neutral. There is plenty of room for price to move either up or down when it finally breaks out.
It is a downwards day that has strongest volume during this consolidation. This suggests a downwards breakout may be more likely than upwards. This technique often works, but often is not the same as always.
The longer term trend is still up because the 200 day moving average is still pointing up. The mid term Fibonacci 55 day moving average is today slightly declining but remains above the long term average.
VOLATILITY – INVERTED VIX CHART
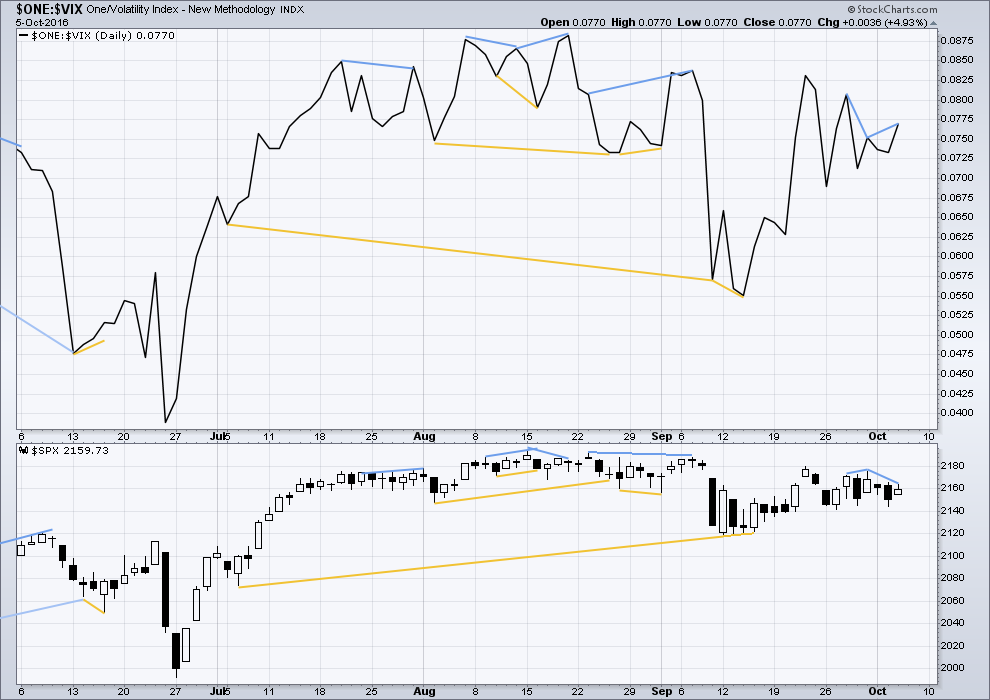
Click chart to enlarge. Chart courtesy of StockCharts.com.
There are a few instances of multi day divergence between price and inverted VIX noted here. Bearish divergence is blue. Bullish divergence is yellow. It appears so far that divergence between inverted VIX and price is again working to indicate short term movements spanning one or two days.
There is again some short term divergence today between price and VIX. The divergence is clear and not slight. Inverted VIX moved higher today, above the point it reached three days ago. Price has not made a corresponding new high. This divergence is bearish and indicates weakness today for upwards movement from price. It may be followed by one or two downwards days from price.
BREADTH – AD LINE
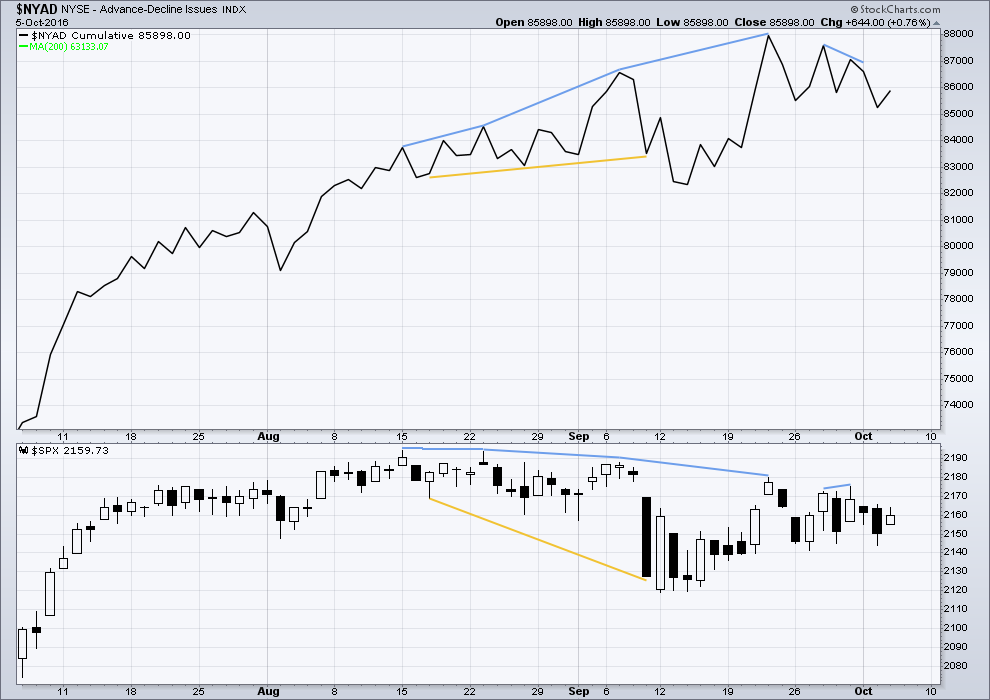
Click chart to enlarge. Chart courtesy of StockCharts.com.
There is support from market breadth as price is rising.
Short term bullish and bearish divergence is again working between price and the AD line to show the direction for the following one or two days.
There is no new short term divergence today between price and the AD line to indicate weakness.
DOW THEORY
Major lows within the old bull market:
DJIA: 15,855.12 (15th October, 2014) – closed below on 25th August, 2015.
DJT: 7,700.49 (12th October, 2014) – closed below on 24th August, 2015.
S&P500: 1,821.61 (15th October, 2014) – has not closed below this point yet.
Nasdaq: 4,117.84 (15th October, 2014) – has not closed below this point yet.
Major highs within the bear market from November 2014:
DJIA: 17,977.85 (4th November, 2015) – closed above on 18th April, 2016.
DJT: 8,358.20 (20th November, 2015) – has not closed above this point yet.
S&P500: 2,116.48 (3rd November, 2015) – closed above this point on 8th June, 2016.
Nasdaq: 5,176.77 (2nd December, 2015) – closed above this point on 1st August, 2016.
Dow Theory Conclusion: Original Dow Theory still sees price in a bear market because the transportations have failed to confirm an end to that bear market. Modified Dow Theory (adding S&P and Nasdaq) has failed still to confirm an end to the old bull market, modified Dow Theory sees price still in a bull market.
This analysis is published @ 08:26 p.m. EST.
Vernacity,
Please fill in the blank for me: ED = ____
A. Environmental Design
B. Enveloping Darkness
C. Established Dogma
D. Mr. ED
Thank you from a little position typester in advance.
Definitely not you-know-what (not projectile but it rhymes!) Dysfunction.
Actually – Ending Diagonal… 🙂
The triangle continues. I don’t think minute c is actually over today. If it were, then minute d and e would also be over and I think the upwards wave during today’s session is too high to be minute wave e.
What is now looking like may happen is intermediate (2) may continue for another three days; two sideways days to complete the triangle for minor wave B, then a short sharp thrust down to complete minor C over in just one day.
Yep! I think you are right on the money Lara.
The second thing I have learned is no never enter your full position in one trade. Again, this is particularly important if you want to establish a large position. Big single trades attract unwanted attention and may make you a target. It is smarter to ladder into your position using several smaller trades. The extra commission is well worth it. This also important as it can involve a strategy to protect yourself from predatory market makers and brokerage houses. If you do it right, they can be made to pay a price for trying to ambush you and that is the last thing I will mention. I will describe what I did to send a message to brokers and market makers who I thought were trying to ambush my positions. Again, the caveat is one has to carefully distinguish between legitimate market moves against you, and a naked ambush….
The third important thing is to not leave profits sitting in the market. One would think this to be quite obvious but some traders love staring at the green in their accounts and too many watch winning trades become losers, especially in this whipsawed market. This was the hardest thing for me to overcome – if I had a dime for every winning trade that went South…well you get my drift. The reason this happens to traders is that while many of them understand the important of stop losses, many often enter trades without a specific profit target in mind.
I once took a class with Steve Nison and he told the story of how his bosses at Merril Lynch marvelled at the fact that although he had many more losses in his accounts than his peers, his trading account grew twice as fast as his peers. The reason was that he was as disciplined about his profit targets as he was about his stop losses. Don’t leave profits in the market!
If we are in an ED, and it is looking more and more like this is the case, the unfolding zig zags is going to practically mandate a nimble approach. I realize this may not work for position traders so for folk who are patient waiting for the wave structure to complete is also a legitimate approach if you don’t have to worry about time decay, as is the case for those of us trading options. It is not a profit until you take it!!
“The third important thing is to not leave profits sitting in the market. One would think this to be quite obvious but some traders love staring at the green in their accounts and too many watch winning trades become losers, especially in this whipsawed market.”
OMG – do you have access to my trading account Verne? Are you watching?
This is me. I can manage risk, I’m disciplined about that. But profit taking is my own very personal block. I am really bad at it. It’s a skill I’m still learning, and the learning is painful. Particularly in this market.
Currencies are different. Perhaps I should have stuck to them 🙁
I’ve done it a thousand times m’lady. It’s virtually every trader’s story. Surprising how often we let it happen until we make it a point not to… 🙂
In response to Quang Vo’s query below here are a few thing I have learned. In this market environment you either adapt or die.
It is really quite surprising how many traders do not recognize that market makers not only fill their orders but they, and some brokerage houses actively trade against their client’s positions. Trading is a full-contact sport and the first rule is that you must protect yourself at all times. I was watching a fight between Floyd Mayweather and Canelo Alvarez where he kept hitting Floyd below the belt. The third time it happened and the referee stopped the fight to warn Canelo, he then signaled for them to continue and Canelo came forward with his gloves lowered as if he wanted to apologize to Floyd and immediately ate a vicious combination. It was perfectly legal, perhaps not sportsmanlike, but legal. The low strikes ended after that round. There are some things that market makers and brokerages do that are not fair but legal so here are four important rules.
First, never place your stops in the market. How often have you watched a familiar trade set-up and executed a trade only to have your stop run immediately or soon after? Some brokerages do this kind of thing routinely. IB is famous for doing this. If you keep getting hammered out your favorite trade set-ups, you could be a victim of this practice. If you trade large lots, market makers will even get their friends to gang-up on your position. Use mental stops whenever you can. This of course means you have to be able to recognize when price is legitimately moving against you as opposed to when you are being ambushed, and there are ways to do that. More to come…
Excellent advice Verne, particularly as you say for large positions.
It does require discipline. And you do need to be constantly watching the market. So for this market you need to be focussed during the NY session.
flag on the 5 min chart? which means odds favor an upside resolution.
I have seen several large orders for 216 Oct 7 Call options. Be prepare for short squeez which may come up soon.
They are probably trading the jobs report tomorrow – a very risky venture imo. I think any pop we get will be short-lived. Of course for nimble traders that is perfectly acceptable!
Hello all. Noticed I was remembered in a post earlier today by Vern. I’ve been out of town for a few days, under the weather for a few more and very busy in other pursuits.
I am still looking for a break above 2200 SPX. Trading URTY as I think small stocks will catch up to large caps. But I am ready to eject from all longs the moment the bear rears her ugly head.
Attached is a photo of my best friend Hunter with some incognito guy. Couldn’t get it right side up. You’ll have to rotate. Sorry.
LOL
I was sitting here Rodney, with my coffee, twisting my head around.
There. Fixed now 🙂
Your best friend sure looks fabulous!
Cute doggie! Thanks Lara! You saved me a trip to the chiropractor! 🙂
Awesome pic. Cute dog
Can anybody explain to me why VIX futures (VXX and UVXY) are printing red when DJI is down a hundred points? Jeez! I know we are still in a BTFD mentality but this is a bit ridiculous doncha think?
We could drop a bit farther than some folk appear to expect. Too much bull…!!! 🙂
Rebellion of the plebes.
People rebelling against Globalist blatantly manipulated US Presidential election. VXX rebelling against Globalist blatantly manipulated major indexes.
Taking short term profits on this move down for d of the triangle. Another great short opportunity on the way as we move up for wave E….and then swoosh for wave C down…..vix should head up toward 20 for C down…
Well, well well…!
In keeping with darkening social mood, they are now going after Cryan of DB. Apparently he was helping Monte Paschi hide their losses.
Does anybody really believe that the powers that be were not aware that central banks all cook their books? This the cartel that launders drug money, underwrites illegal arms dealers in the promotion of bloody conflicts, and assist politicians in stealing trillions from the public. I guess somebody has to be made to appear being held accountable. It’s just the tip of the iceberg people.
That’s why we call ’em banksters…!
I am wondering about symmetry and the possibility of an ED for the fifth wave. The movement out of the minor B triangle for minor C up to conclude intermediate one was sharp and lasted two days. Could we see the same kind of movement out of the repeating minor B triangle to complete C down for intermediate two?
I think so Verne. I suspect it may be quicker, maybe only one day.
But I don’t think the triangle is done yet, and I have a strong suspicion that minute c of the triangle isn’t done.
Richard Perry is one of the best in the business. He is closing his hedge fund, Perry Capital and returning money to investors. If you have been frustrated trying to trade this central bank contorted market, you are not alone. Some of the best in the business have closed shop and walked away in frustration. This is seismic. These guys are the ultimate canaries in the coal mine, and when the fly away, you know the air is bad. The central banksters have completely destroyed price discovery in the market, so intelligent trading and investing is all but impossible. I seriously doubt these global criminals are aware of the magnitude and enormity of what they have wrought. I am just at about the point where I refuse to maintain open positions in any market overnight. I think we are skating on very thin ice indeed….!
That reminds me of a story that Prechter tells of a major Wall St investment firm firing all it’s technical analysts just prior to the market peak in 2000.
Not quite the same thing of course, but to me they both look like warnings of a top.
Lowry’s continue to warn that the old bull market is slowly morphing into a bear market… but not yet. Not quite yet folks.
I’ve got my very own rather personal indicator.
Every time price goes up the membership declines or is stagnant. Every time price falls hard for a good wave down the membership surges. Cycle wave IV was good for the membership here at EWSM. Not sure why that is, maybe Ellioticians are perma bears?
Interesting! Someone did note how comments almost disappear during sideways and upwards movement and think they are right. That means Rodney should be posting more as he, we know is bullish in all time window! 🙂
Well, here I am. Still bullish because of main EW count.
I notice that posts come thick and thin in times of uncertainty. Most are seeking to understand the muddling situation ahead. Some want assurances, a word of encouragement, a likeminded outpouring of frustration. There are of course some who are really belligerent, venting their grief in a highly derogatory manner unbefitting that of civilised behaviour. In situations when the market trend is firmly in place, people strangely disappear. This mirrors everyday life. When the going’s good, you hardly meet people. But, when adverse circumstances arise, then you start to hear complaints, sometimes even gnashing of teeth.
So… do you think the market trend is clear? 🙂
Yes….clearly flat (sideways). Look at the daily SP since mid July. It hasn’t changed. Every time we sell off hard, a bid magically appears.
This is why I have started day trading using a 1 minute chart. Markets are fractal, so why the heck not? Adapt to what the market offers you.
“Every time we sell off hard, a bid magically appears.”
YES…
Clinton Cronies at work (Donors of the Clinton Foundation)… i.e. Wall Street bank Elites, the Fed, Central Banks, One World Society crew, etc. etc.
I would nonetheless point out dear friends, that the bankster ministrations appear to be loosing their potency. When was the last time you saw futures ramped up triple digits? (dji).
I noted with interest their failed furious attempts the last few sessions to fill some open gaps. One ascribed characteristic to the ED is fierce resistance to an impending trend change. If this is what is unfolding, we should continue to see these manic zig zags as the tug of war continues, followed by the characteristic shot past the 1-3 trend-line of the diagonal as this long emergecny comes to a merciful end. Are y’all ready???!! 🙂
You’re absolutely right Quang Vo. Sideways is a direction too 🙂
Indeed! Sideways , strangely enough, is what it does much, if not most of the time….
When the market is consolidating, for both websites, the membership declines. Every time. Even if I have a good week and get direction right 4 or 5 times out of 5, the membership still declines.
When that happens I’m like, what? What more could I possibly do people?
LOL
But when it starts trending people come back, so it’s all good.
Fair weather friends/traders!!! 🙂 🙂
Vern
I agree with your analysis, most of my close trading friends have ‘ thrown in the towel’ after continual losses as they believe the market is rigged and conventional analysis does not seem to work.
Cash yields nothing and bonds are grossly overvalued so stocks still seem to be the only alternative for gaining some yield.
So what is likely to cause the top to occur? Any Ideas?
I would have thought that in this type of situation GOLD would be rising given it is the one asset that banksters cannot create or print?
Still hanging in here.
Two days ago I posited on the Gold site that in a kind of counter-intuitive way, the precipitous drop in the price of Gold could be a signal of an impending fiat currency crisis. When “funny money” gets into trouble (no one wants to take it), those trying to survive in the marketplace are forced to unload real assets. There is no more funny money than derivatives. Then on Bloomberg yesterday I heard someone mention that DB was selling massive amounts of Gold!
I said that I hope that whoever they are selling to is taking delivery of the actual metal. Central banks have turned otherwise intelligent folk into complete financial morons (look at negative yielding bonds!) so I would not be surprised if there were actually people willing to take the other side of a paper Gold contract with DB- probably other insolvent banks.
Many of us are not selling a single ounce of our PMs, nor a single share of our miners. This current decline will result in the metal continuing to move from weak and/or highly leveraged hands to strong hands and my suspicion is that the time is coming when you will not be able to take delivery of the metal at any price. We know for a fact that the paper contracts ALREADY exceed the available metal by over 100 times. The top could indeed be caused by some insolvent bank’s failure to deliver a large order of the metal or something similar.
I guess nobody noticed the FED refused to give Germany theirs!
Hanging in there with ya Geoff… 🙂
On the matter of bonds, they put in a multi-decade top a few months’ back in a classic ED pattern and is probably one of the safest short plays out there – you can literally “set it and forget it” in a short bond trade as interest rates slowly but inexorably work their way higher, FED paralysis notwithstanding…
corporate bond failures are already far out-stripping what we saw in 2015…each 100 basis point rise results in one trillion, yes TRILLION, in losses for bond holders!
Don’t pin too much hope on gold. It is now wallowing in the doldrums. The people who made such a big hullabaloo about gold rising to infinity and beyond have been strangely reticent as of late.
I would not be surprised even if it trade back below 1000.00 In a deflationary environment, EVERYTHING declines, as people sell valuable assets, including Gold, to try and meet obligations.
so in essence…you have become a day trader too Verne?!
We have to do what we have to do my friend!
Back in the day, we used get moves that lasted 3-5 days…now, we’re luck if the move last 3-5 hours, with many of the moves completed within the hour.