
Last analysis expected upwards movement for Friday but this did not happen.
Price has been moving sideways now for five days.
Summary: Classic technical analysis supports the bearish alternate Elliott wave count. This still requires price confirmation below 2,111.05. If price moves below 2,111.05, then expect overall more downwards movement to at least 1,948. A new high above 2,187.87 would invalidate the alternate and confirm the main wave count, then expect overall upwards movement to 2,233.
Last monthly chart for the main wave count is here.
New updates to this analysis are in bold.
MAIN WAVE COUNT
WEEKLY CHART
Click chart to enlarge.
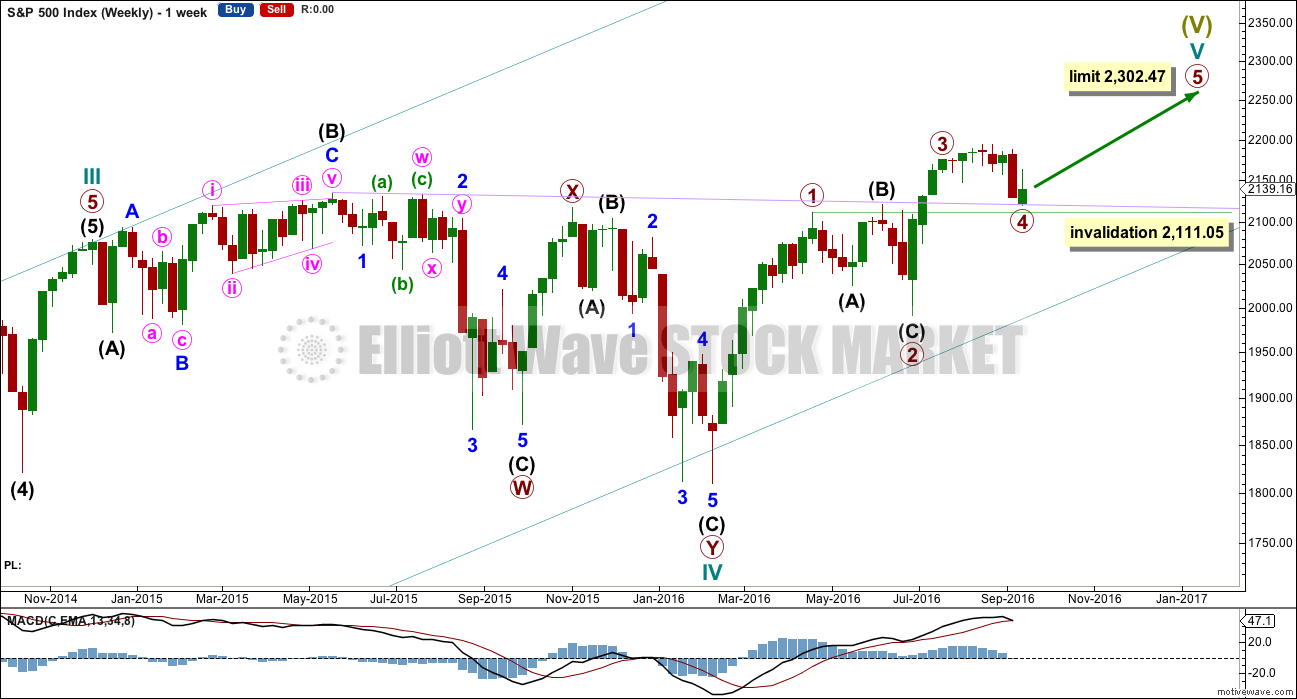
Cycle wave V must subdivide as a five wave structure. I have two wave counts for upwards movement of cycle wave V. This main wave count is presented first only because we should assume the trend remains the same until proven otherwise. Assume that downwards movement is a correction within the upwards trend, until proven it is not.
Primary wave 3 is shorter than primary wave 1, but shows stronger momentum and volume as a third wave normally does. Because primary wave 3 is shorter than primary wave 1 this will limit primary wave 5 to no longer than equality in length with primary wave 3, so that the core Elliott wave rule stating a third wave may not be the shortest is met. Primary wave 5 has a limit at 2,302.47.
Primary wave 2 was a shallow 0.40 expanded flat correction. Primary wave 4 may be exhibiting alternation as a more shallow triangle.
Primary wave 4 may not move into primary wave 1 price territory below 2,111.05.
It is also possible to move the degree of labelling within cycle wave V all down one degree. It may be that only primary wave 1 unfolding. The invalidation point for this idea is at 1,810.10. That chart will not be published at this time in order to keep the number of charts manageable. The probability that this upwards impulse is only primary wave 1 is even with the probability that it is cycle wave V in its entirety.
DAILY CHART
Click chart to enlarge.
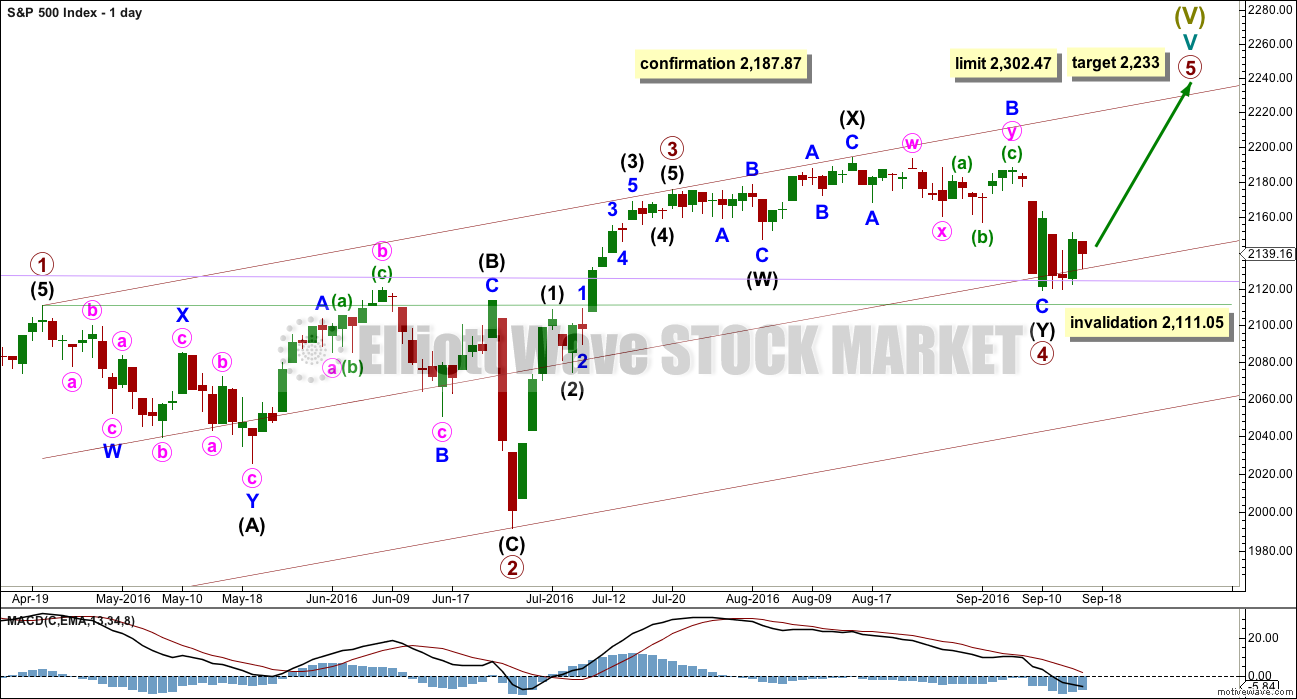
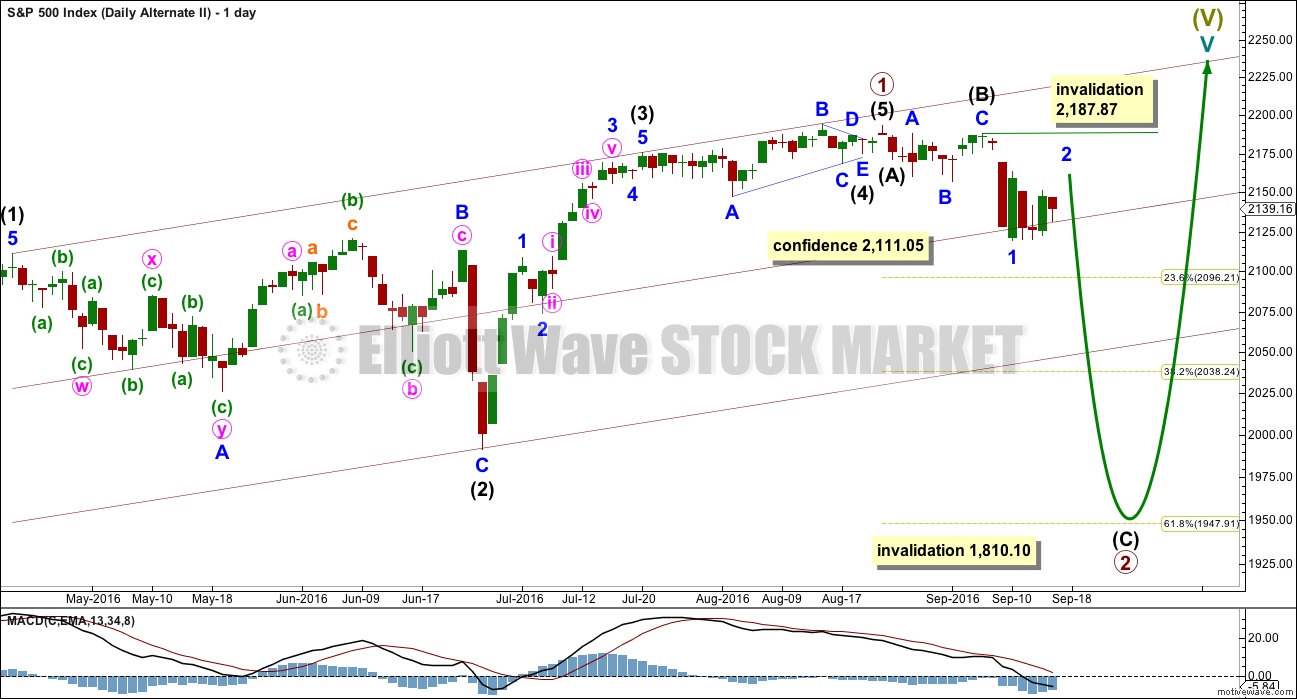
Primary wave 4 may be now complete as a double combination.
The first structure in the double is labelled intermediate wave (W) and is an expanded flat correction. The double is joined by a three in the opposite direction labelled intermediate wave (X). The second structure in the double is a zigzag labelled intermediate wave (Y).
The whole structure for primary wave 4 has a mostly sideways look, but the fact that intermediate wave (Y) has ended comfortably below the end of intermediate wave (W) must necessarily reduce the probability of this wave count. To achieve the purpose of taking up time and moving price sideways the second structure in a double should end close to the same level as the first and this one does not. This part of the wave count does not have the right look.
Primary wave 4 may not move into primary wave 1 price territory below 2,111.05.
Primary wave 1 lasted 47 days, primary wave 2 was even in duration at 47 days, primary wave 3 lasted 16 days, and so far primary wave 4 has lasted 39 days. The proportions between these waves are acceptable.
If primary wave 5 has begun here, then at 2,233 it would reach 0.618 the length of primary wave 1.
A new high above 2,187.87 would invalidate the alternate daily wave count below and provide some confirmation of this main wave count.
HOURLY CHART
Click chart to enlarge.
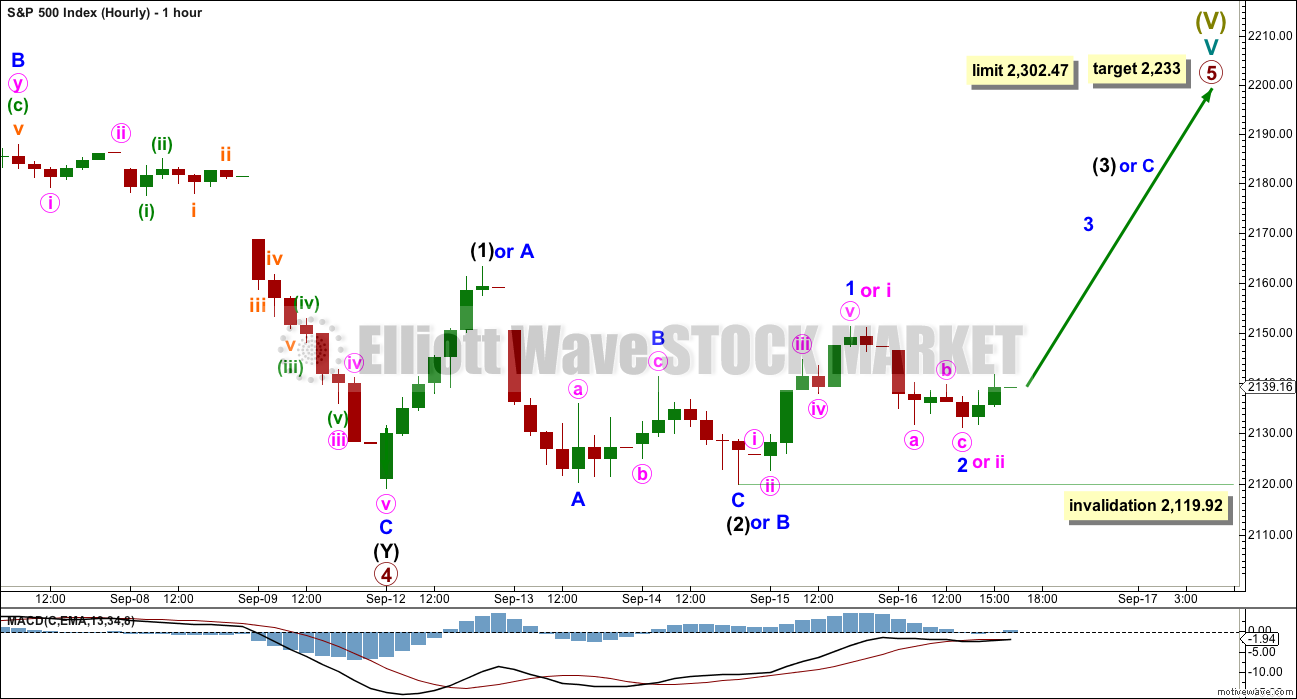
Primary wave 5 may unfold as either an impulse (more common) or an ending diagonal (slightly less common).
If an impulse upwards is unfolding for primary wave 5, then within it intermediate waves (1) and (2) would be complete. Intermediate wave (3) may only subdivide as a five wave impulse and must move above the end of intermediate wave (1) at 2,163.30. Within intermediate wave (3), minor wave 1 may be complete. Minor wave 2 may not move beyond the start of minor wave 1 below 2,119.92.
Alternate labelling: If an ending diagonal is unfolding for primary wave 5, then within it all the sub-waves may only subdivide as zigzags. So far a zigzag for intermediate wave (1) would be incomplete, so only minor waves A and most likely B would be complete. Minor wave C must move above the end of minor wave A at 2,163.30 to avoid a truncation. Within minor wave C, only minute wave i may be complete. Minute wave ii may not move beyond the start of minute wave i below 2,119.92.
Both an impulse or ending diagonal would now require a five wave structure upwards to move above 2,163.30. There is at this stage no divergence in expectations for direction.
Only when these two possibilities diverge in terms of expected direction or invalidation points will they be separated into two separate charts.
ALTERNATE WAVE COUNT
WEEKLY CHART
Click chart to enlarge.
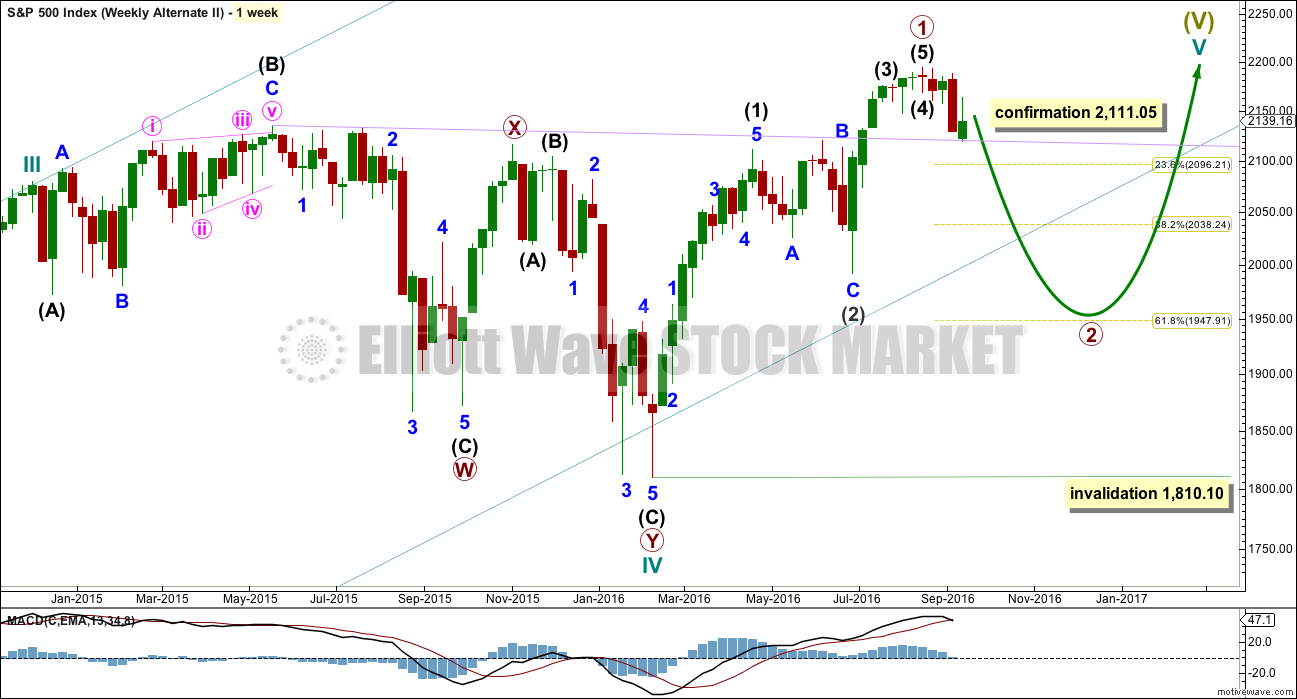
What if an impulse upwards is complete? The implications are important. If this is possible, then primary wave 1 within cycle wave V may be complete.
If the degree of labelling within cycle wave V is moved up one degree, then it is possible that recently Super Cycle wave (V) ended and the S&P has just begun a very large bear market to span several years. This scenario is possible, but absolutely requires price confirmation before it can be taken seriously. Only a new low below 1,810.10 would confirm this very bearish scenario.
If an impulse upwards is complete, then a deep second wave correction may be unfolding for primary wave 2. If primary wave 2 is to reach as low as the 0.618 Fibonacci ratio, then it would break below the larger teal channel about Super Cycle wave (V), which is copied over here from the monthly chart. This is possible: the S&P does tend to break out of its channels towards the end of a movement yet still continues in the prior direction before turning.
Primary wave 2 may not move beyond the start of primary wave 1 below 1,810.10.
DAILY CHART
Click chart to enlarge.
If an impulse upwards is complete, then how may it subdivide and are proportions good?
Intermediate wave (1) was an impulse lasting 47 days. Intermediate wave (2) was an expanded flat lasting 47 days. Intermediate wave (3) fits as an impulse lasting 16 days, and it is 2.04 points short of 0.618 the length of intermediate wave (1). So far this alternate wave count is identical to the main wave count (with the exception of the degree of labelling, but here it may also be moved up one degree).
Intermediate wave (4) may have been a running contracting triangle lasting 22 days and very shallow at only 0.0027 the depth of intermediate wave (3). At its end it effected only a 0.5 point retracement. There is perfect alternation between the deeper expanded flat of intermediate wave (2) and the very shallow triangle of intermediate wave (4). All subdivisions fit and the proportion is good.
Intermediate wave (5) would be very brief at only 18.29 points. Intermediate wave (5) is 1.43 points longer than 0.056 the length of intermediate wave (1).
So far primary wave 2 may be unfolding as a zigzag. The common depth for a second wave is the 0.618 Fibonacci ratio of the first wave it is correcting, so a reasonable expectation for primary wave 2 would be to end about 1,948.
Within intermediate wave (C), no second wave correction may move beyond the start of its first wave above 2,187.87.
Primary wave 2 may not move beyond the start of primary wave 1 below 1,810.10. A new low below this point would see the degree of labelling within cycle wave V moved up one degree. At that stage, a trend change at Super Cycle degree would be expected and a new bear market to span several years would be confirmed.
HOURLY CHART
Click chart to enlarge.
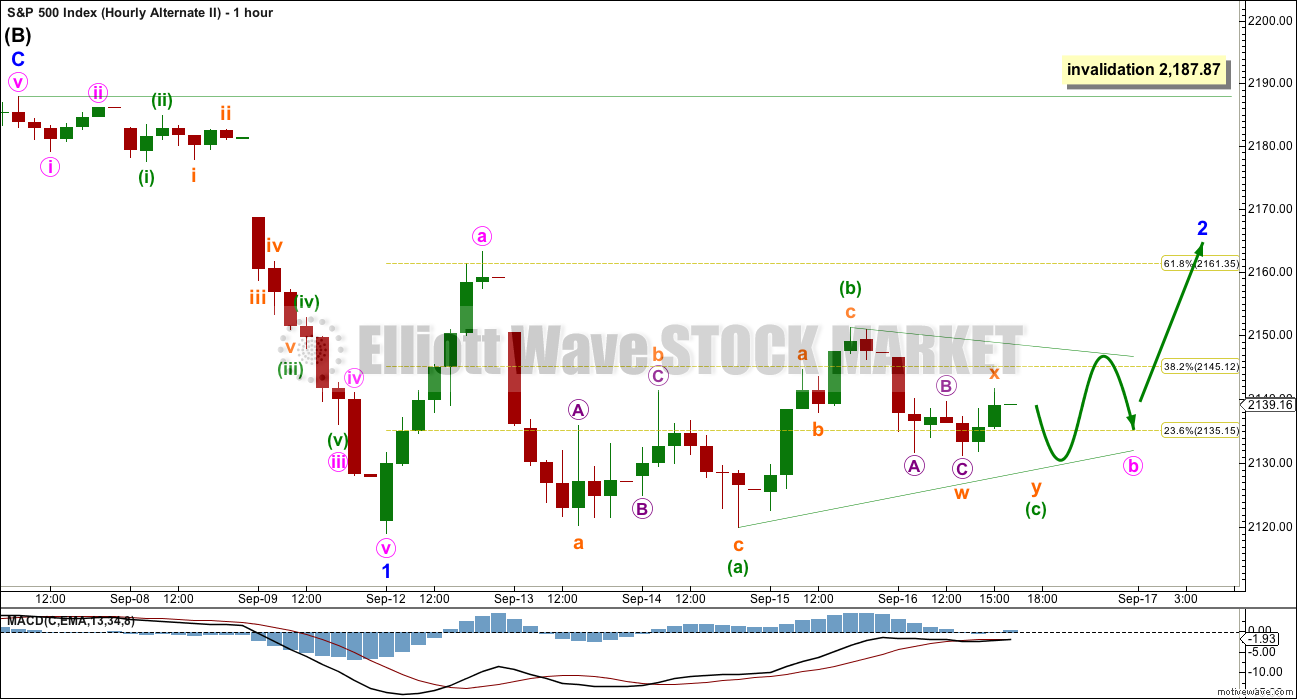
Minor wave 2 may be completing as a flat, as labelled yesterday, but it may also be a zigzag as labelled today. Within minor wave 2, minute wave b may be an incomplete regular contracting or barrier triangle.
MACD is hovering just below zero and is flat for Friday’s session. This suggests a triangle may be forming.
If this labelling is correct, then the triangle is incomplete. One of the five sub-waves may be a more complicated time consuming multiple and this may be minuette wave (c). Minuette wave (c) of a contracting or barrier triangle may not move beyond the end of minuette wave (a) below 2,119.92.
Minuette wave (d) of a contracting triangle may not move above the end of minuette wave (b) 2,151.31. Minuette wave (d) of a barrier triangle should end very close to the end of minuette wave (d), as long as the (b)-(d) trend line remains essentially flat the triangle will remain valid. In practice this means minuette wave (d) may end slightly above the end of minuette wave (b) at 2,151.31.
Minuette wave (e) of both a contracting or barrier triangle may not move beyond the end of minuette wave (c).
If price continues sideways in an ever decreasing range, then this idea may be correct. A short brief breakout upwards at the conclusion of the triangle for minute wave c would be very likely to make at least a slight new high above the end of minute wave a at 2,163.30 to avoid a truncation.
Minor wave 2 may not move beyond the start of minor wave 1 above 2,187.87.
TECHNICAL ANALYSIS
WEEKLY CHART
Click chart to enlarge. Chart courtesy of StockCharts.com.
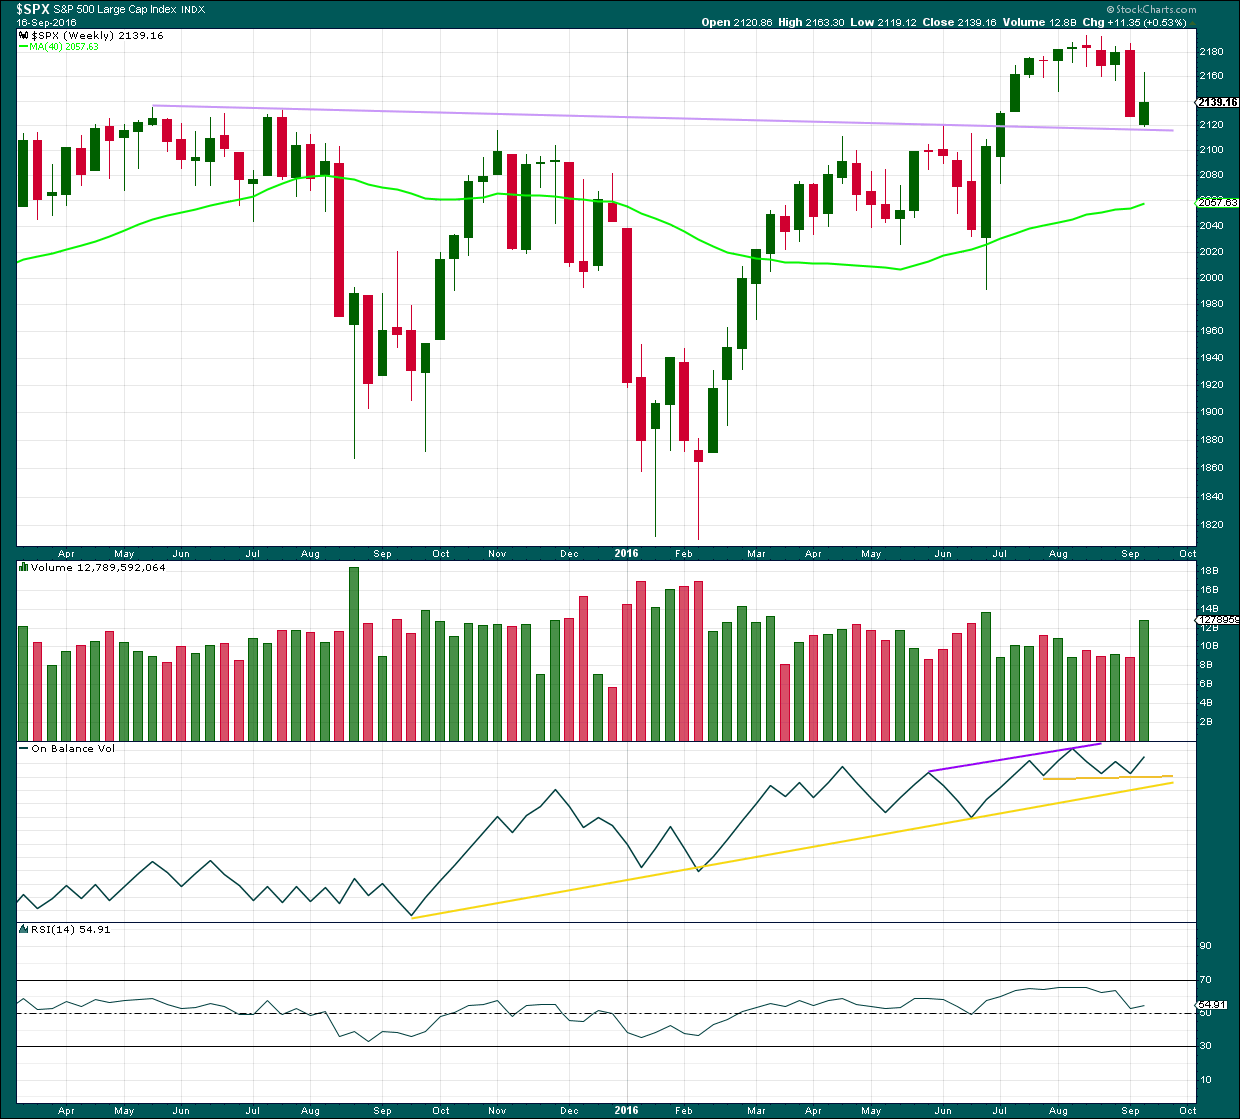
This week completes a green weekly candlestick which has found support at the lilac trend line. The long upper wick is bearish and the green colour is bullish. A strong increase in volume indicates support for overall upwards movement, but to understand more clearly what is happening this week in terms of volume we need to look inside this week at daily volume bars.
On Balance Volume is providing a bullish signal this week with a move up and away from the short yellow trend line. There is divergence between price and OBV this week: the high for this week from price is lower than the last green weekly candlestick but OBV has made a lower high. This indicates weakness in upwards movement from price this week and it is bearish.
RSI is still just above neutral. There is room for price to rise or fall.
DAILY CHART
Click chart to enlarge. Chart courtesy of StockCharts.com.
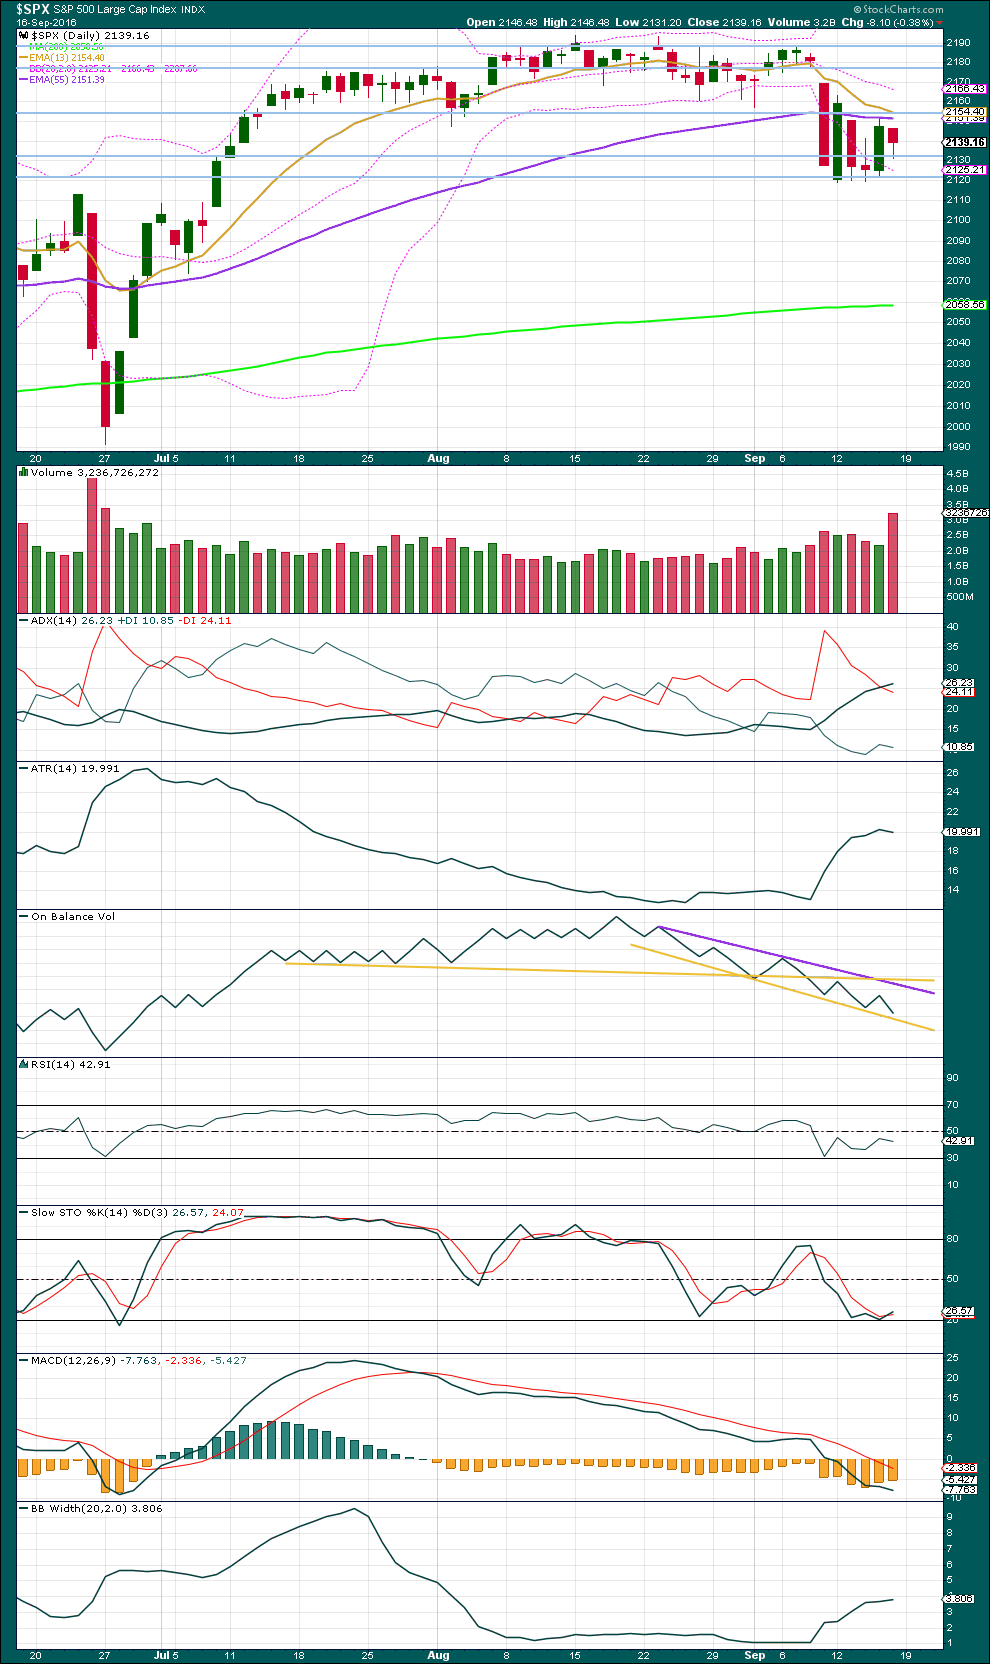
The overall downwards day for Friday comes with a strong volume spike. The fall in price has the strongest volume seen since 27th of June. There was strong support for the fall in price. This supports the alternate Elliott wave count.
ADX is still increasing and is not extreme. There is still a downwards trend in place.
For the last session ATR slightly decreased, but one day is not enough to indicate a change. Overall, last week ATR continues to increase indicating the market is now trending.
Bollinger Bands continue to expand, volatility has returned to the market. With all three of these indicators in agreement, it is reasonable to conclude that a downwards trend is in place. This favours the alternate Elliott wave count.
On Balance Volume trend lines are redrawn at the end of this week. A break below the yellow line would be a bearish signal. A break above the purple line would be a bullish signal. The bearish signals given by OBV with a break below the horizontal yellow line and then a retest to find resistance are still intact.
RSI is close to neutral. There is plenty of room for price to fall. There is no divergence between price and RSI to indicate weakness at this stage.
Stochastics is not extreme, but it may move into oversold and remain extreme for a reasonable period of time during a trending market.
MACD indicates an increase in downwards momentum.
VOLATILITY – INVERTED VIX CHART
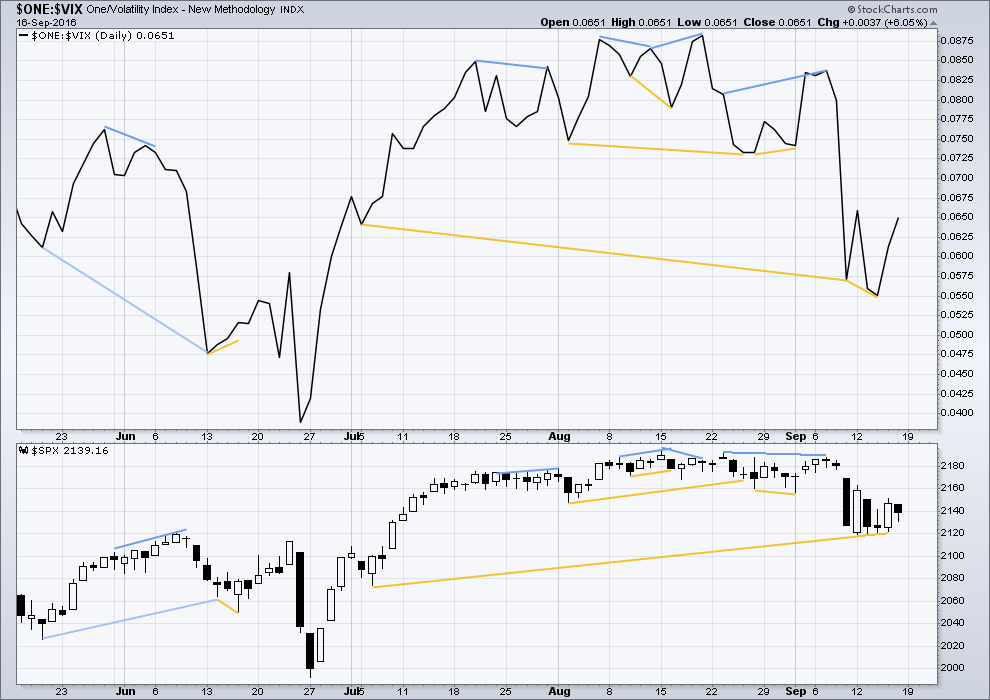
Click chart to enlarge. Chart courtesy of StockCharts.com.
Volatility is declining as price is rising. This is normal for an upwards trend.
There are a few instances of multi day divergence between price and inverted VIX noted here. Bearish divergence is blue. Bullish divergence is yellow. It appears so far that divergence between inverted VIX and price is again working to indicate short term movements spanning one or two days.
For Friday’s session, while price overall moved lower to complete a red daily candlestick, inverted VIX moved higher. Volatility declined as price moved lower. This single day divergence is bullish for the very short term. It supports the idea of upwards movement for Monday and possibly for Tuesday as well.
BREADTH – AD LINE
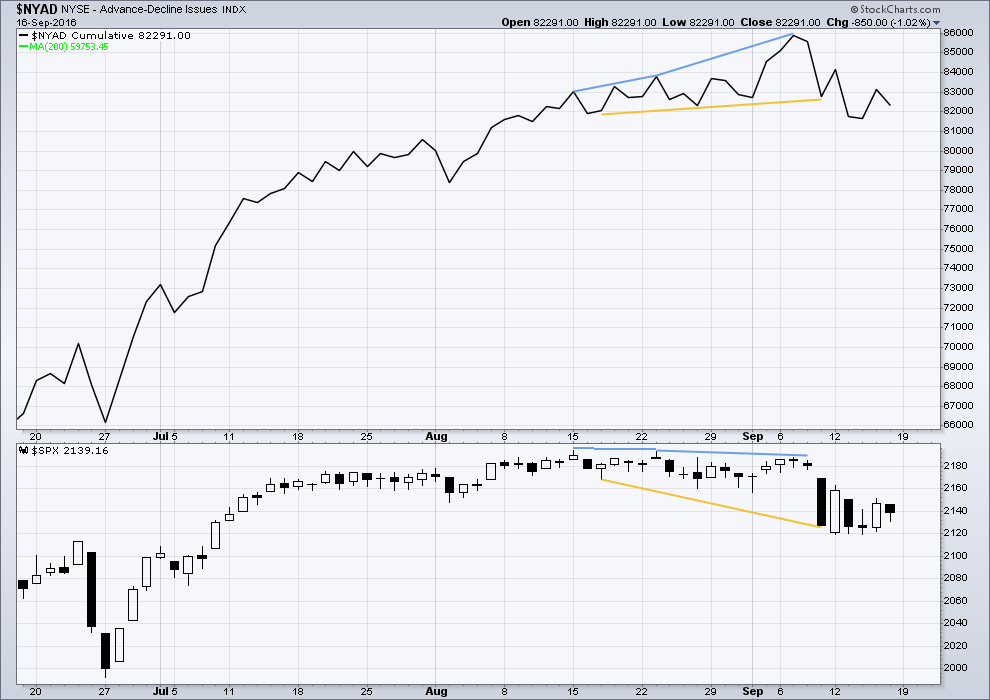
Click chart to enlarge. Chart courtesy of StockCharts.com.
There is support from market breadth as price is rising.
Short term bullish and bearish divergence is again working between price and the AD line to show the direction for the following one or two days.
For Friday’s session both price and the AD line moved lower. There is no short term divergence to indicate weakness.
DOW THEORY
Major lows within the old bull market:
DJIA: 15,855.12 (15th October, 2014) – closed below on 25th August, 2015.
DJT: 7,700.49 (12th October, 2014) – closed below on 24th August, 2015.
S&P500: 1,821.61 (15th October, 2014) – has not closed below this point yet.
Nasdaq: 4,117.84 (15th October, 2014) – has not closed below this point yet.
Major highs within the bear market from November 2014:
DJIA: 17,977.85 (4th November, 2015) – closed above on 18th April, 2016.
DJT: 8,358.20 (20th November, 2015) – has not closed above this point yet.
S&P500: 2,116.48 (3rd November, 2015) – closed above this point on 8th June, 2016.
Nasdaq: 5,176.77 (2nd December, 2015) – closed above this point on 1st August, 2016.
Dow Theory Conclusion: Original Dow Theory still sees price in a bear market because the transportations have failed to confirm an end to that bear market. Modified Dow Theory (adding S&P and Nasdaq) has failed still to confirm an end to the old bull market, modified Dow Theory sees price still in a bull market.
This analysis is published @ 02:52 a.m. EST on 16th September, 2016.
It’s occurred to me that with a triangle unfolding (so far that’s what it looks like) it may be a fourth wave. And so far it’s below what would be it’s counterpart first wave price territory.
This is what that idea would look like.
If this is correct then it may be within the first five down of a new bear market. It may also be a five down for an A wave of a deep zigzag, a primary wave 2 down.
This is what it would look like for a new bear market.
Bottom line: a triangle looks like it is forming. It may breakout up or down. Up if it’s a B wave within a smaller correction, and down if it’s a larger fourth wave triangle.
Keep it simple:
Markets are in kind of a bubble, due to the FED.
If it hikes, the FED can surprise the markets, and it might be afraid to do so.
If FED doesn’t move, its own-created bubble will go on , inflating more and more.
Question from the FED’s perspective is: when will I stop all of this? Now, and I upset markets, generating a tsunami-like reaction, but at the end of that day, Mr Market will regulate itself a bit more… or will I act later on and I just will see the market implode on its own weight…….
If FED doesn’t hike, they will cross the Rubicon, and whatever might be done later will have less or no impact at all…
Fed officials are divided before the monetary policy meeting on Tuesday and Wednesday. This division among FED members could give Yellen a decisive influence on the final decision. It is time for Mrs Yellen to stop worrying about market reactions and affirm her supremacy in this men-testosterone world!!!
A Reuters survey showed last week that the probability of a rate hike this week was around 25% and only 6% of the economists surveyed said they expect that the FED takes action Wednesday, the majority of them assuming a rate hike in December.
Hear ye, hear ye, all ye who pass by: Mrs Yellen will hike, then minor three down … perfect timing!
Boo, Boo, just sit back and let Mother Nature carry us toward her own.
I think the triangle for a continuing minor two is spot on. The pivots are not going to be breached until we get a sharp break upwards from it to complete wave minute C of minor two. If this is correct, we should see that move up early next week, with a decisive break of the pivots in minor three down to follow. Lara’s analysis does explain the price action very well and gives an outstanding trade set-up scenario. I have learned not to second-guess the action around these pivots. When they are not decisively taken out, it’s time to back off and be patient. As we have observed on numerous occasions, when third waves arrive, nobody looks around asking: “Are we there yet?” 🙂
I think we are headed up, with a probable sharp break…futures are 100 points up for the Dow. Then minor three down, and short , short , short…
By the way … a warning indicator for banking stress rose to a record in China in the first quarter, underscoring risks to the nation and the world from a rapid build-up of Chinese corporate debt. <- Uh Uh Uh Houston we have a problem… $$$-shortness of breath – help ! help!
When several different Elliotticians start mentioning the same structure as a possibility I like to pay very close attention. Quite a few are citing the possibility of this final wave up being an ending diagonal. The ED also has a certain philosophical appeal as its personality has sometimes been described as being that of an impending trend change that is being resisted. Can anyone think of a more precise description of the role our friendly banksters have been playing? This particular trend change has been a very long time coming…but, resistance is FUTILE!! 🙂
First, incredible as it seems.