
Both Elliott wave counts remain valid still.
Summary: Both Elliott wave counts expect upwards movement tomorrow to at least 2,164. A new high above 2,187.87 would invalidate the bear and confirm the bull, and the target would then be at 2,233. A new low below 2,111.05 would invalidate the bull and confirm the bear, and the target would at that stage be 1,948. Classic technical analysis still offers more support for a bearish outlook short term.
Last monthly chart for the main wave count is here.
New updates to this analysis are in bold.
MAIN WAVE COUNT
WEEKLY CHART
Click chart to enlarge.
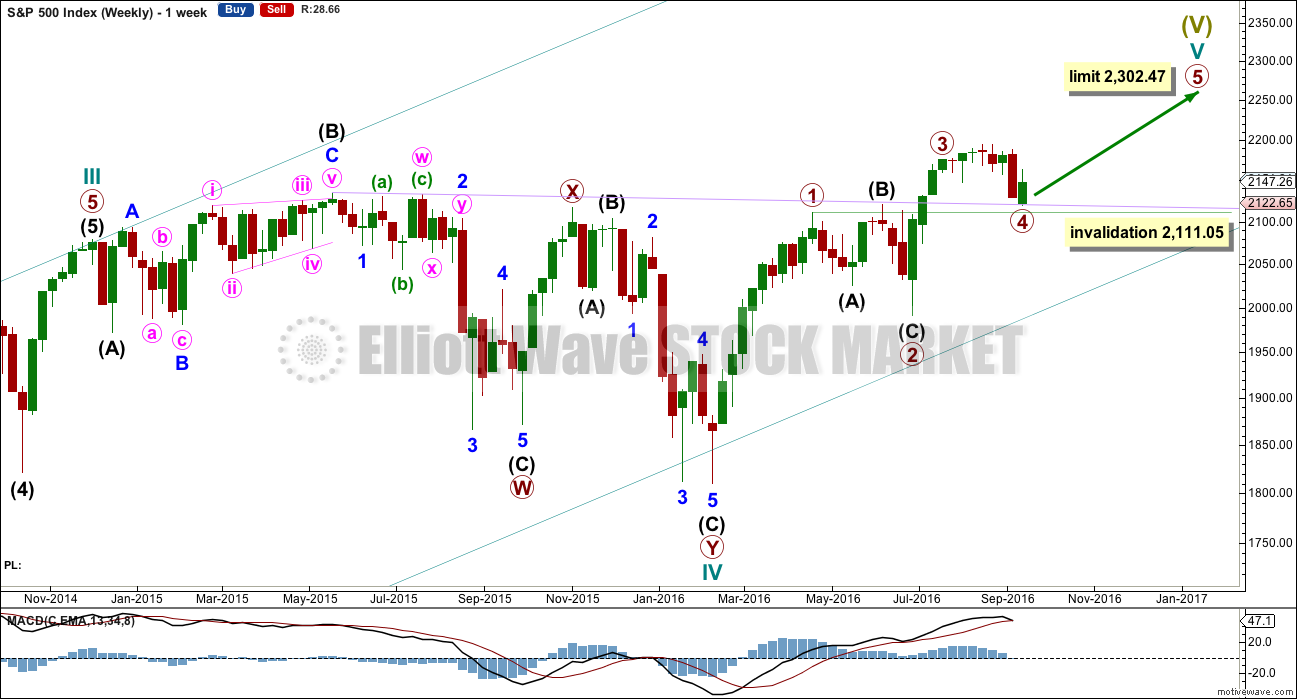
Cycle wave V must subdivide as a five wave structure. I have two wave counts for upwards movement of cycle wave V. This main wave count is presented first only because we should assume the trend remains the same until proven otherwise. Assume that downwards movement is a correction within the upwards trend, until proven it is not.
Primary wave 3 is shorter than primary wave 1, but shows stronger momentum and volume as a third wave normally does. Because primary wave 3 is shorter than primary wave 1 this will limit primary wave 5 to no longer than equality in length with primary wave 3, so that the core Elliott wave rule stating a third wave may not be the shortest is met. Primary wave 5 has a limit at 2,302.47.
Primary wave 2 was a shallow 0.40 expanded flat correction. Primary wave 4 may be exhibiting alternation as a more shallow triangle.
Primary wave 4 may not move into primary wave 1 price territory below 2,111.05.
It is also possible to move the degree of labelling within cycle wave V all down one degree. It may be that only primary wave 1 unfolding. The invalidation point for this idea is at 1,810.10. That chart will not be published at this time in order to keep the number of charts manageable. The probability that this upwards impulse is only primary wave 1 is even with the probability that it is cycle wave V in its entirety.
DAILY CHART
Click chart to enlarge.
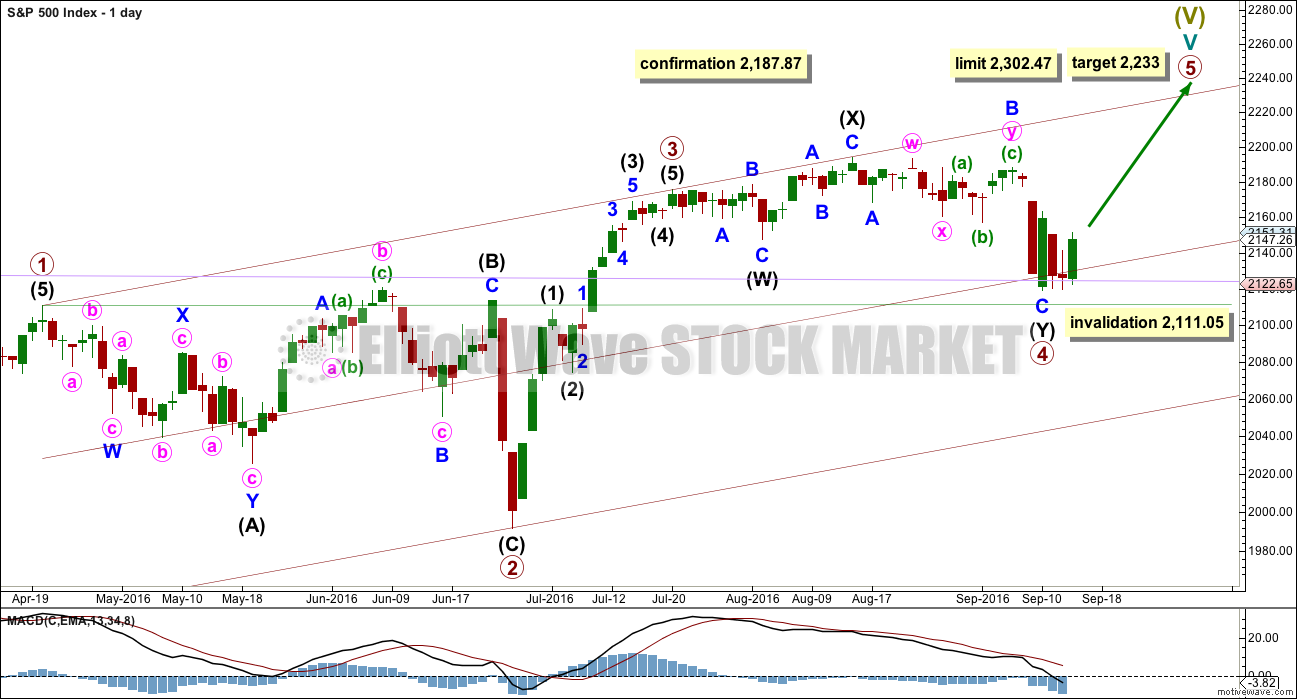
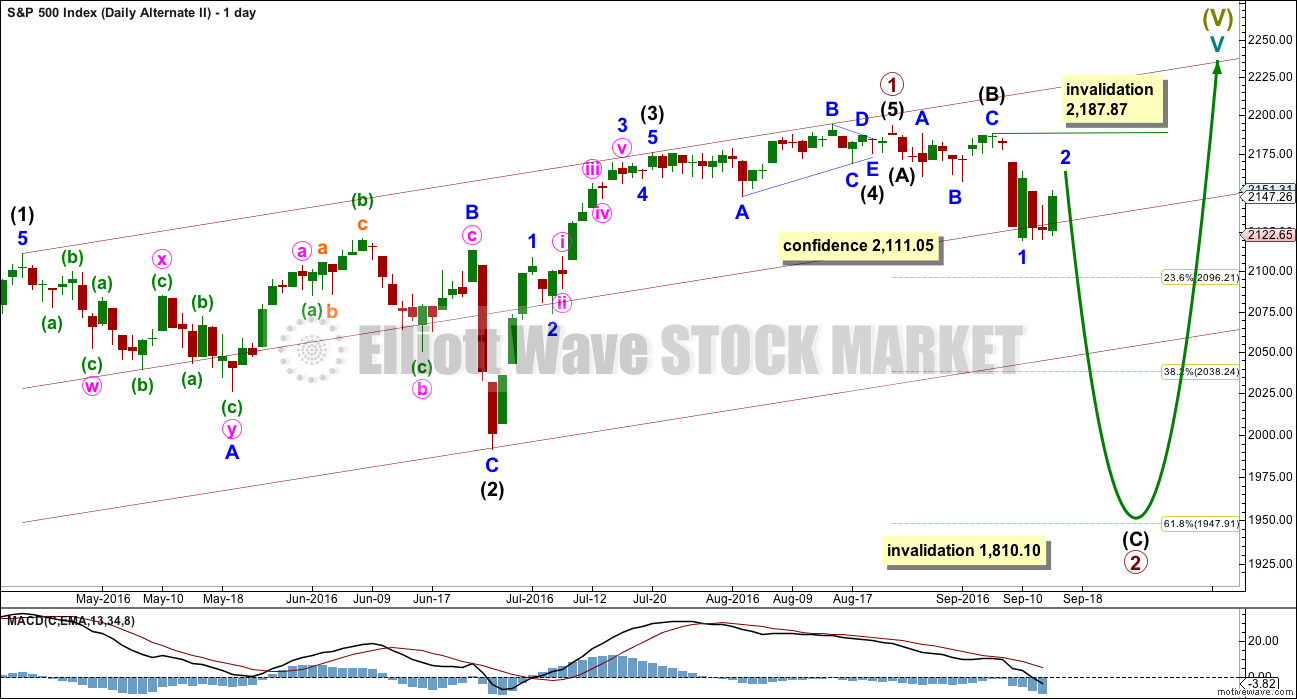
Primary wave 4 may be now complete as a double combination.
The first structure in the double is labelled intermediate wave (W) and is an expanded flat correction. The double is joined by a three in the opposite direction labelled intermediate wave (X). The second structure in the double is a zigzag labelled intermediate wave (Y).
The whole structure for primary wave 4 has a mostly sideways look, but the fact that intermediate wave (Y) has ended comfortably below the end of intermediate wave (W) must necessarily reduce the probability of this wave count. To achieve the purpose of taking up time and moving price sideways the second structure in a double should end close to the same level as the first and this one does not.
Primary wave 4 may not move into primary wave 1 price territory below 2,111.05.
Primary wave 1 lasted 47 days, primary wave 2 was even in duration at 47 days, primary wave 3 lasted 16 days, and so far primary wave 4 has lasted 39 days. The proportions between these waves are acceptable giving the wave count the right look.
If primary wave 5 has begun here, then at 2,233 it would reach 0.618 the length of primary wave 1.
A new high above 2,187.87 would invalidate the alternate daily wave count below and provide some confirmation of this main wave count.
HOURLY CHART
Click chart to enlarge.
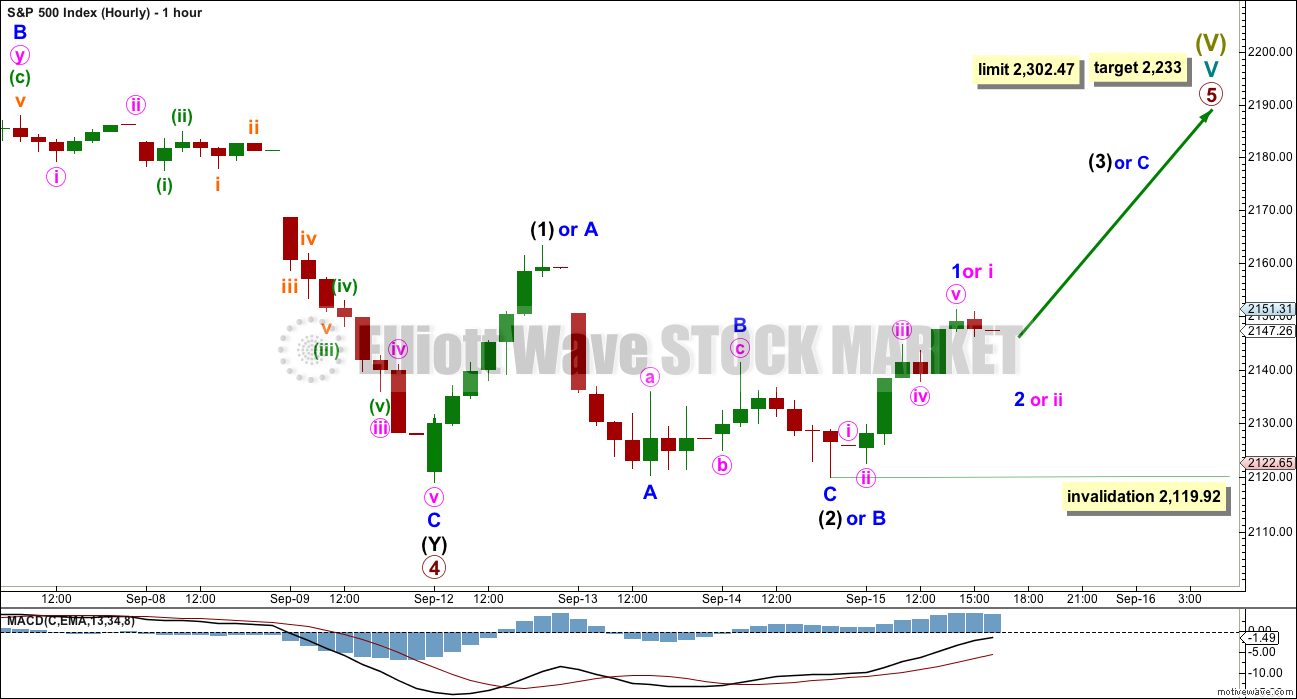
Primary wave 5 may unfold as either an impulse (more common) or an ending diagonal (slightly less common).
If an impulse upwards is unfolding for primary wave 5, then within it intermediate waves (1) and (2) would be complete. Intermediate wave (3) may only subdivide as a five wave impulse and must move above the end of intermediate wave (1) at 2,163.30. Within intermediate wave (3), today minor wave 1 may be complete. Minor wave 2 may not move beyond the start of minor wave 1 below 2,119.92.
If an ending diagonal is unfolding for primary wave 5, then within it all the sub-waves may only subdivide as zigzags. So far a zigzag for intermediate wave (1) would be incomplete, so only minor waves A and most likely B would be complete. Minor wave C must move above the end of minor wave A at 2,163.30 to avoid a truncation. This idea is outlined today with alternate labelling. Within minor wave C, only minute wave i may be complete. Minute wave ii may not move beyond the start of minute wave i below 2,119.92.
Both an impulse or ending diagonal would now require a five wave structure upwards to move above 2,163.30. There is at this stage no divergence in expectations for direction.
Only when these two possibilities diverge in terms of expected direction or invalidation points will they be separated into two separate charts.
ALTERNATE WAVE COUNT
WEEKLY CHART
Click chart to enlarge.
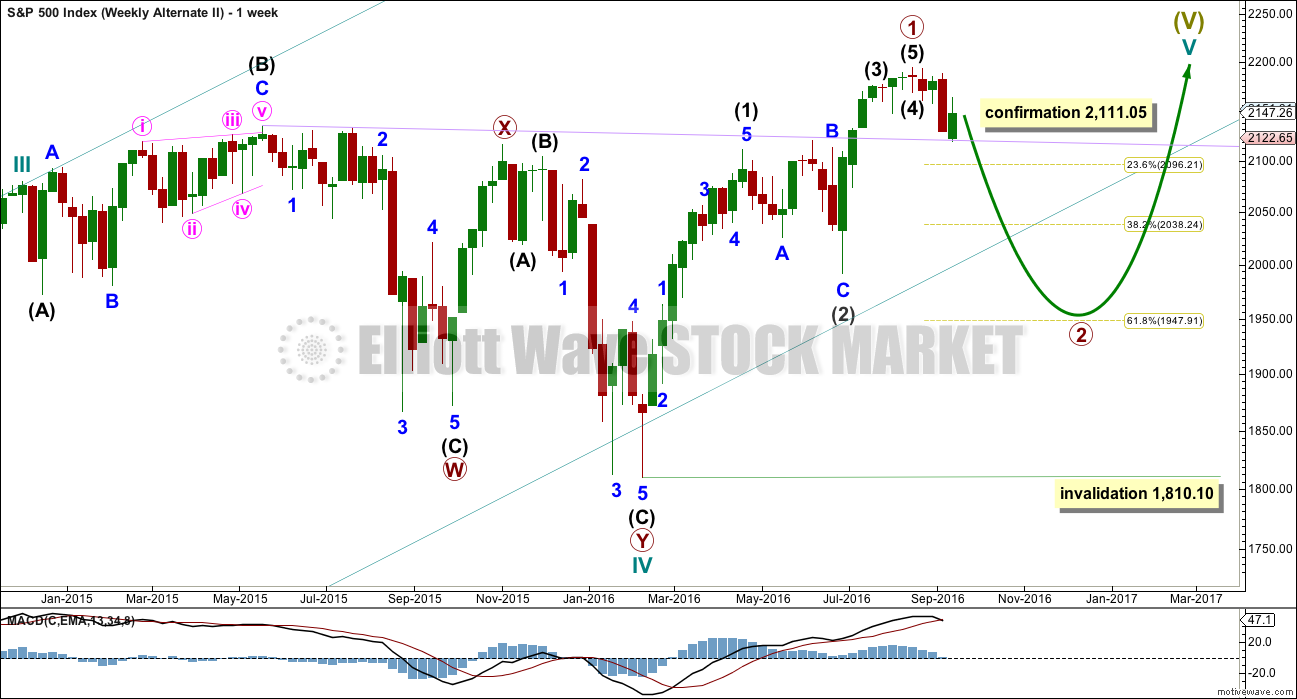
What if an impulse upwards is complete? The implications are important. If this is possible, then primary wave 1 within cycle wave V may be complete.
If the degree of labelling within cycle wave V is moved up one degree, then it is possible that recently Super Cycle wave (V) ended and the S&P has just begun a very large bear market to span several years. This scenario is possible, but absolutely requires price confirmation before it can be taken seriously. Only a new low below 1,810.10 would confirm this very bearish scenario.
If an impulse upwards is complete, then a deep second wave correction may be unfolding for primary wave 2. If primary wave 2 is to reach as low as the 0.618 Fibonacci ratio, then it would break below the larger teal channel about Super Cycle wave (V), which is copied over here from the monthly chart. This is possible: the S&P does tend to break out of its channels towards the end of a movement yet still continues in the prior direction before turning.
Primary wave 2 may not move beyond the start of primary wave 1 below 1,810.10.
DAILY CHART
Click chart to enlarge.
If an impulse upwards is complete, then how may it subdivide and are proportions good?
Intermediate wave (1) was an impulse lasting 47 days. Intermediate wave (2) was an expanded flat lasting 47 days. Intermediate wave (3) fits as an impulse lasting 16 days, and it is 2.04 points short of 0.618 the length of intermediate wave (1). So far this alternate wave count is identical to the main wave count (with the exception of the degree of labelling, but here it may also be moved up one degree).
Intermediate wave (4) may have been a running contracting triangle lasting 22 days and very shallow at only 0.0027 the depth of intermediate wave (3). At its end it effected only a 0.5 point retracement. There is perfect alternation between the deeper expanded flat of intermediate wave (2) and the very shallow triangle of intermediate wave (4). All subdivisions fit and the proportion is good.
Intermediate wave (5) would be very brief at only 18.29 points. Intermediate wave (5) is 1.43 points longer than 0.056 the length of intermediate wave (1).
So far primary wave 2 may be unfolding as a zigzag. The common depth for a second wave is the 0.618 Fibonacci ratio of the first wave it is correcting, so a reasonable expectation for primary wave 2 would be to end about 1,948.
Within intermediate wave (C), no second wave correction may move beyond the start of its first wave above 2,187.87.
Primary wave 2 may not move beyond the start of primary wave 1 below 1,810.10. A new low below this point would see the degree of labelling within cycle wave V moved up one degree. At that stage, a trend change at Super Cycle degree would be expected and a new bear market to span several years would be confirmed.
HOURLY CHART
Click chart to enlarge.
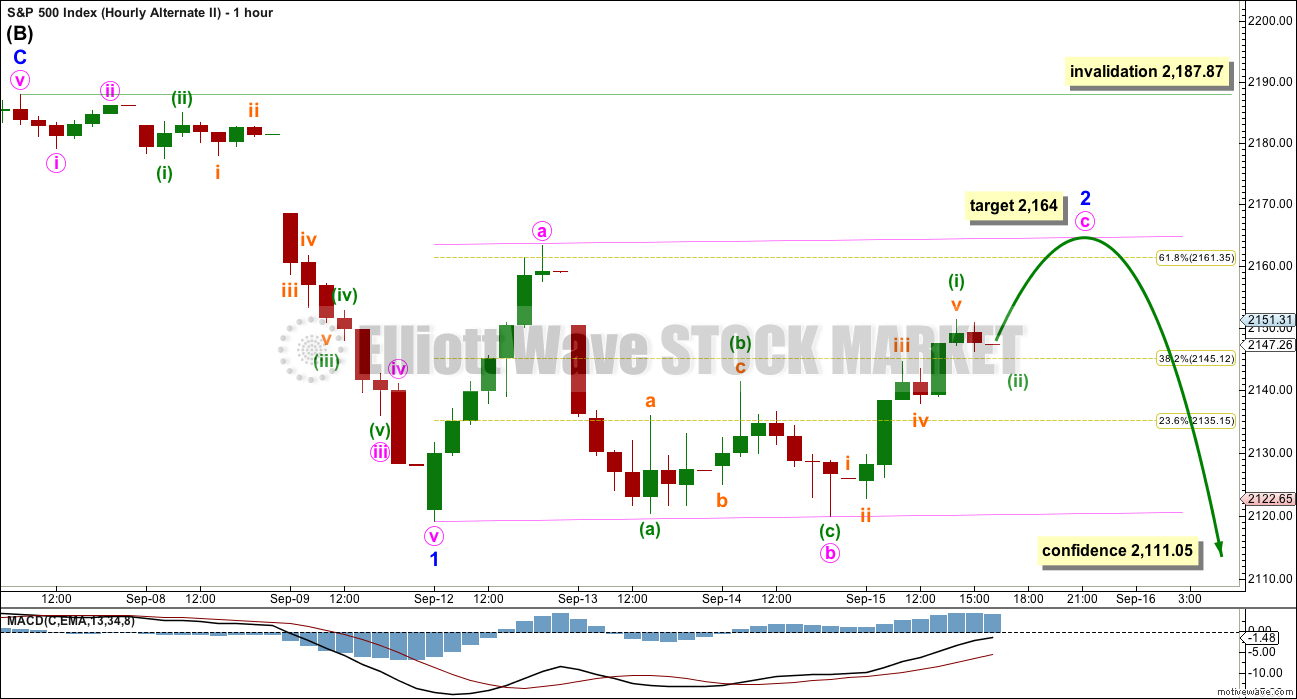
This alternate is today changed at the hourly chart level. With overall sideways movement of the last three days, it looks like minor wave 2 is not over and this movement does not look like the start of a third wave down.
Minor wave 2 may be continuing as a flat correction. Within minor wave 2, minute wave b is a completed three and is a 0.98 the length of minute wave a, indicating a regular flat. Regular flats normally have C waves which are close to even in length with their A waves. At 2,164 minute wave c would reach equality in length with minute wave a.
Draw a channel about minor wave 2 using Elliott’s technique as shown. Regular flats normally fit into channels. The upper edge of this pink channel should provide resistance tomorrow.
Minor wave 2 may not move beyond the start of minor wave 1 above 2,187.87.
If price makes a new low below 2,111.05, then this alternate wave count would be used. At that stage, several more days of overall downwards movement, if not weeks, would be expected.
TECHNICAL ANALYSIS
WEEKLY CHART
Click chart to enlarge. Chart courtesy of StockCharts.com.
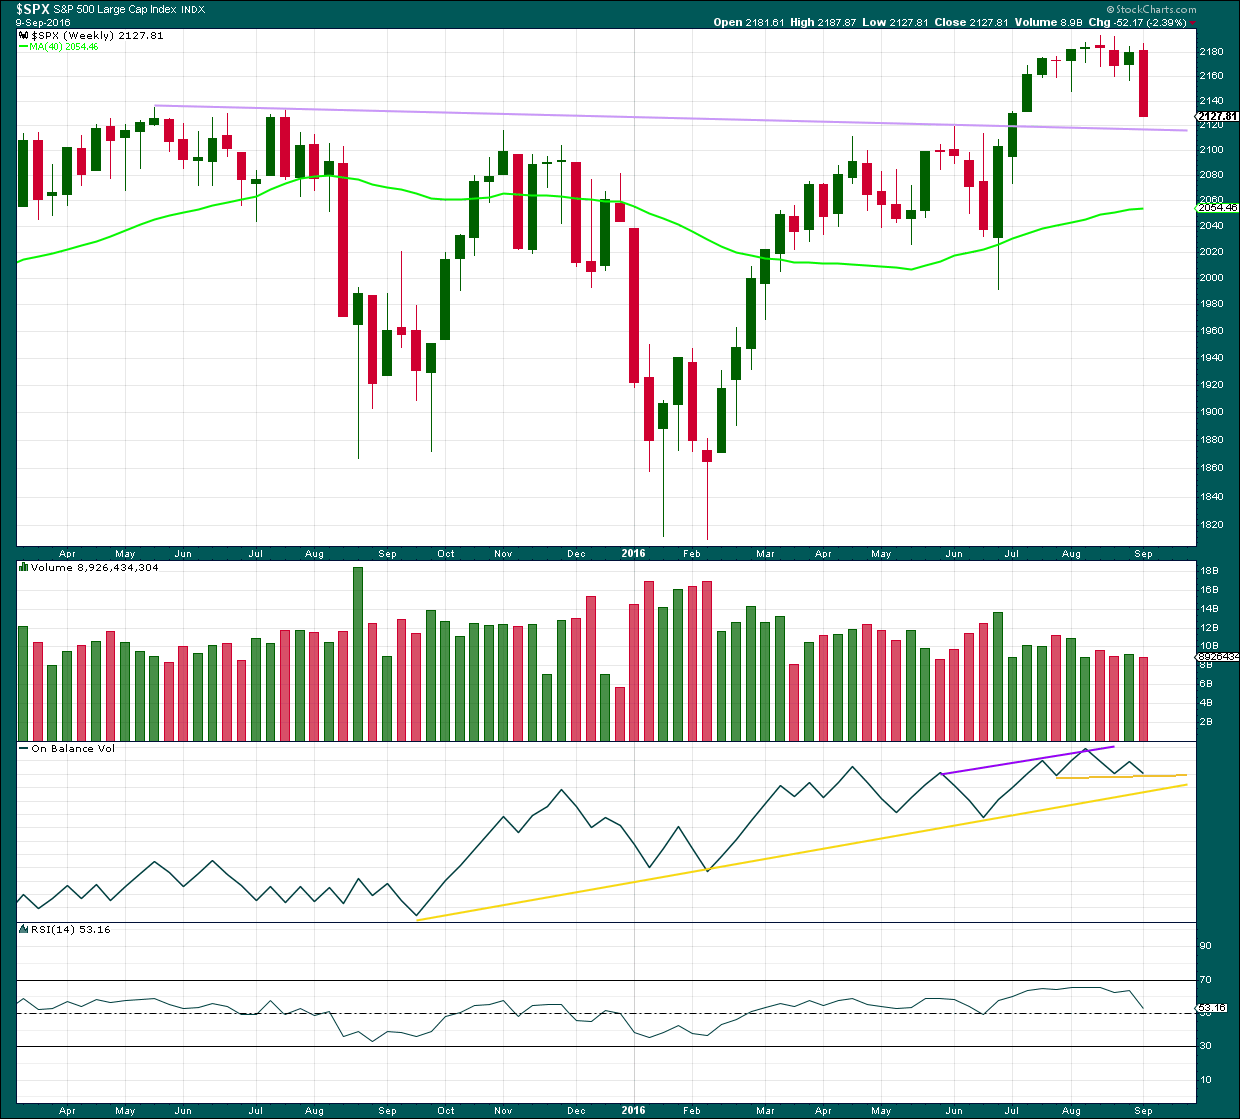
Last week has closed below an important resistance point at 2,134. This is the prior all time high from May 2015. This close is significant. On its own it is not enough to turn to full bearish, but it is one piece of evidence to weigh up.
The long held lilac trend line should be expected to offer strong support for price along the way down. Draw it from the prior all time high in May 2015 to the first small swing high in July 2015. This line is drawn also on weekly Elliott wave charts.
Volume for last week is lighter than the prior upwards week. The fall in price at the weekly chart level does not look like it was supported by volume, but to get a clearer picture it is necessary to look inside last week at daily volume bars.
On Balance Volume has come down to find support at a short term yellow line. The next support line is close by. These lines may assist to halt the fall in price.
RSI is just above neutral. There is plenty of room for price to rise or fall. There is no divergence at the weekly chart level to indicate weakness.
DAILY CHART
Click chart to enlarge. Chart courtesy of StockCharts.com.
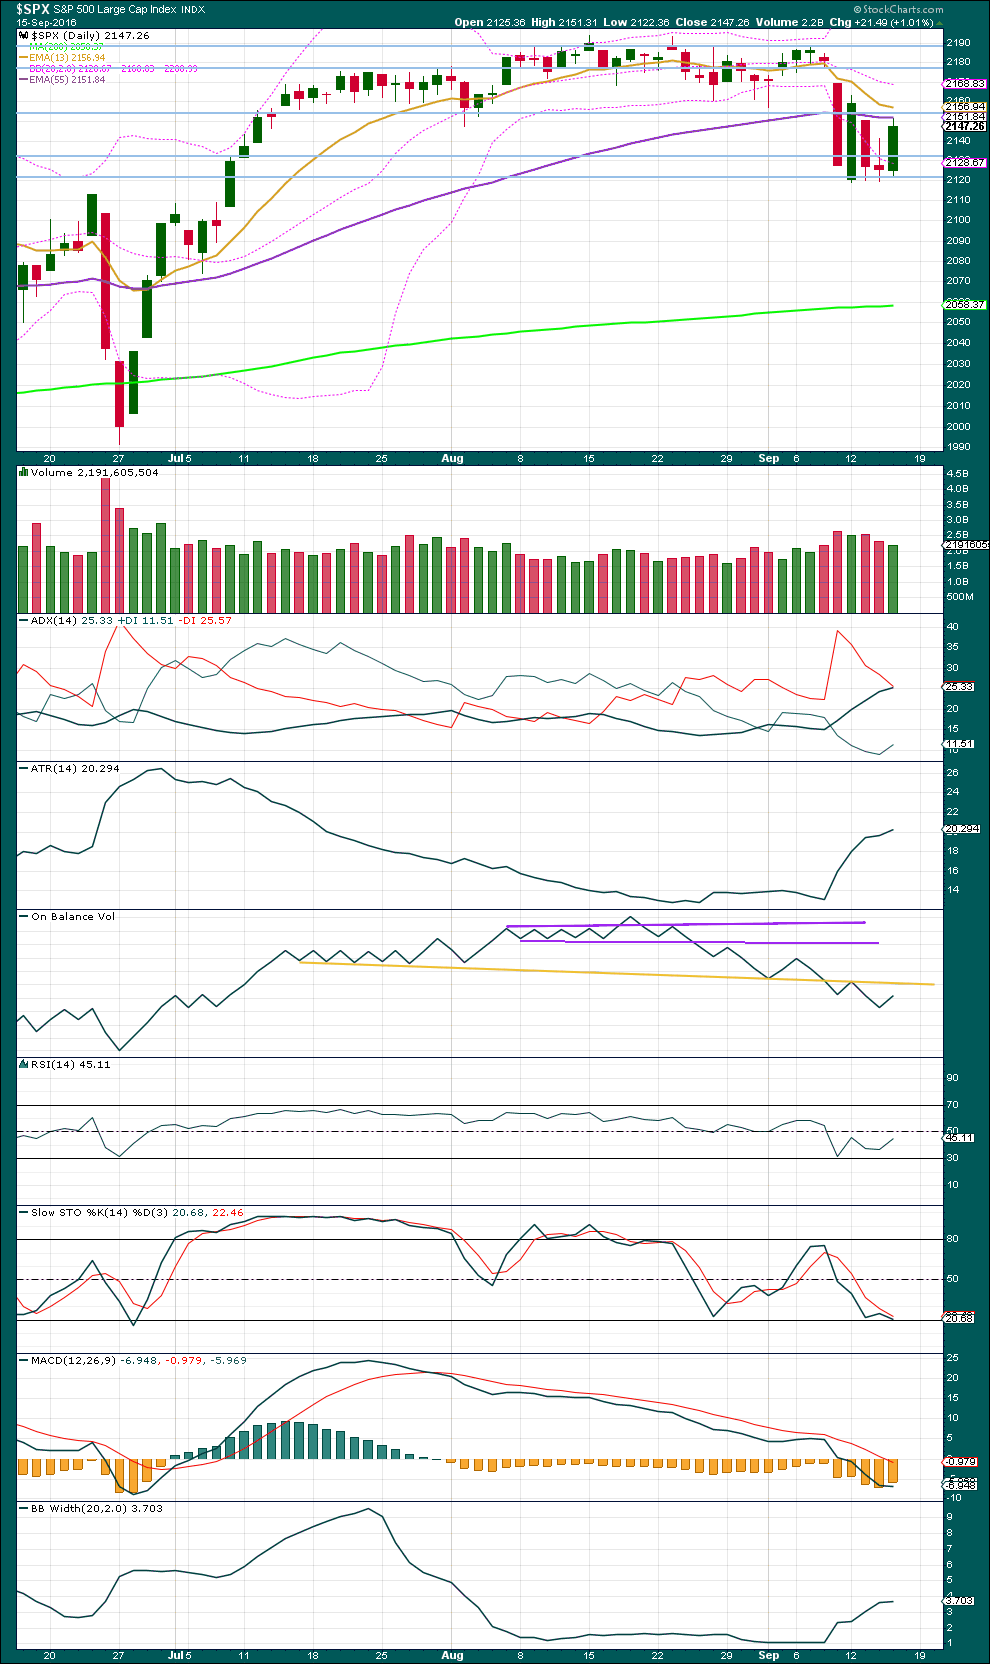
A strong upwards day comes with lighter volume than the prior downwards day. This upwards movement from price was not supported by volume. This suggests more downwards movement ahead and supports the alternate Elliott wave count slightly.
For three days now volume is declining. This indicates price may be in a small consolidation and this also supports the alternate hourly Elliott wave count mid term.
ADX is still increasing, indicating the market is now trending. The -DX line is above the +DX line, so a downwards trend is indicated.
On Balance Volume gave a bearish signal with a break below the long held yellow trend line. There is room yet for OBV to move higher before it finds resistance at this line. This should allow price to move higher for another session or maybe two, but not by too much.
RSI is moving back up to neutral. There is again plenty of room for price to fall or rise.
Stochastics today declined while price moved higher. This very short term divergence is bearish, but it can be given barely any weight as it is often unreliable. It is noted, but given almost no weight in this analysis.
Bollinger Bands have widened recently on downwards days and flattened on upwards days. This may be some support for the view that a new downwards trend may be beginning.
Price may find resistance about 2,150 which previously provided support. It may also find some resistance at the short term Fibonacci 13 day moving average.
The short term Fibonacci 13 day moving average remains above the mid term Fibonacci 55 day moving average, which is also above the long term 200 day moving average. These averages have not yet indicated a change from bull to bear; they indicate a bull market remains intact.
However, the mid term 55 day average is now declining. With this mid term average rolling over, the picture may be in the process of changing from bull to bear. For the mid term picture to be clearer the shorter 13 day average would need to move below the mid term 55 day average.
If the long term 200 day average rolls over and declines, then the picture would be much more bearish.
VOLATILITY – INVERTED VIX CHART
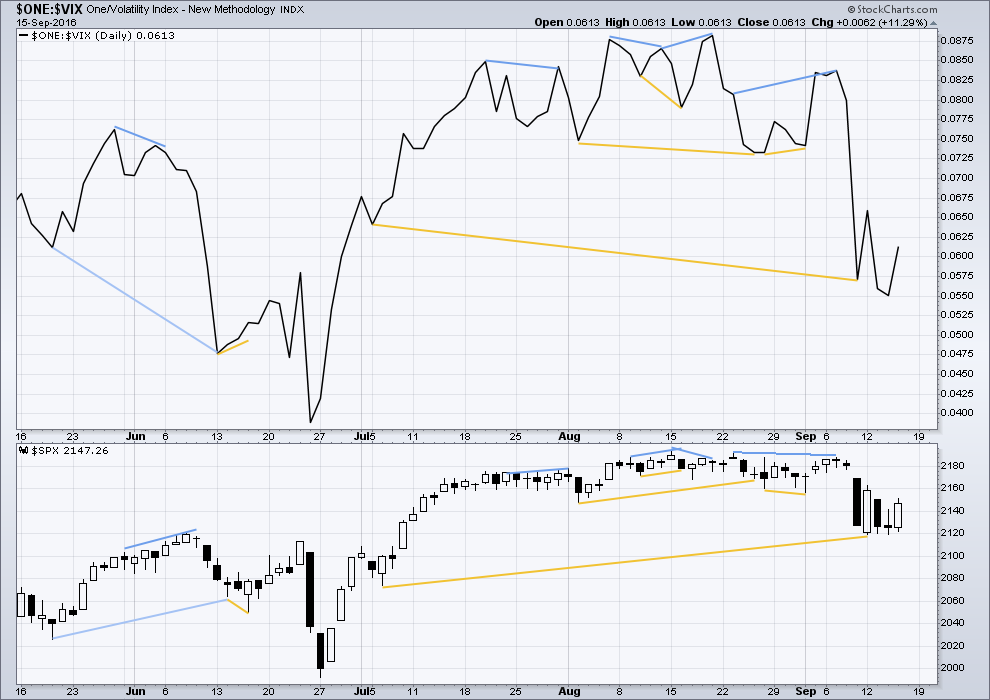
Click chart to enlarge. Chart courtesy of StockCharts.com.
Volatility is declining as price is rising. This is normal for an upwards trend.
There are a few instances of multi day divergence between price and inverted VIX noted here. Bearish divergence is blue. Bullish divergence is yellow. It appears so far that divergence between inverted VIX and price is again working to indicate short term movements spanning one or two days.
Today VIX and price both moved higher. There is no divergence today to indicate weakness.
BREADTH – AD LINE
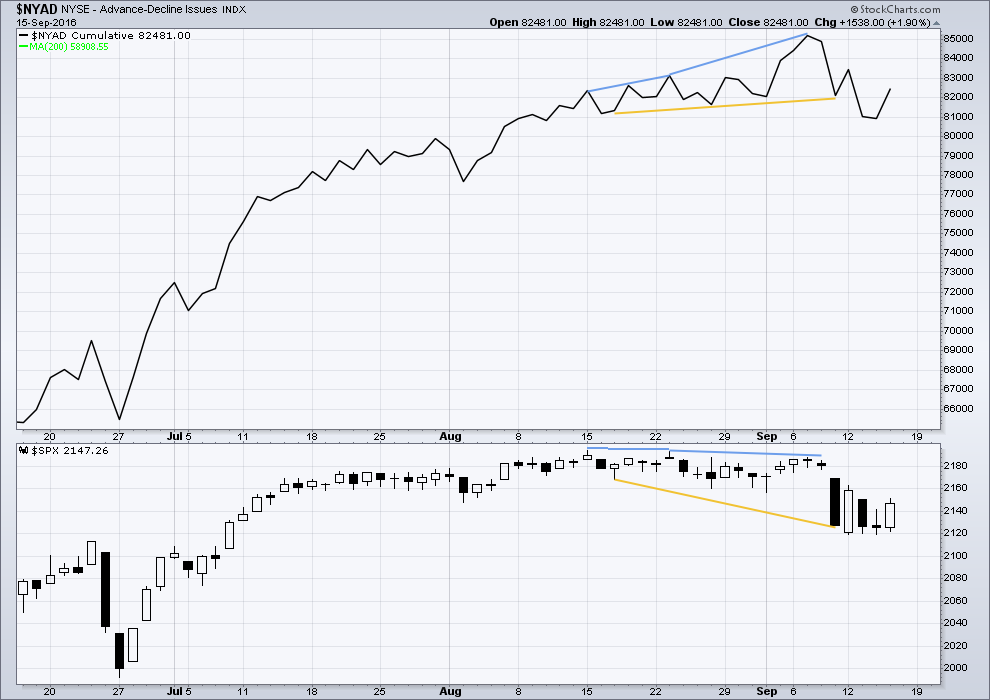
Click chart to enlarge. Chart courtesy of StockCharts.com.
There is support from market breadth as price is rising.
Short term bullish and bearish divergence is again working between price and the AD line to show the direction for the following one or two days.
Today both price and the AD line moved higher. There is no short term divergence today to indicate weakness.
DOW THEORY
Major lows within the old bull market:
DJIA: 15,855.12 (15th October, 2014) – closed below on 25th August, 2015.
DJT: 7,700.49 (12th October, 2014) – closed below on 24th August, 2015.
S&P500: 1,821.61 (15th October, 2014) – has not closed below this point yet.
Nasdaq: 4,117.84 (15th October, 2014) – has not closed below this point yet.
Major highs within the bear market from November 2014:
DJIA: 17,977.85 (4th November, 2015) – closed above on 18th April, 2016.
DJT: 8,358.20 (20th November, 2015) – has not closed above this point yet.
S&P500: 2,116.48 (3rd November, 2015) – closed above this point on 8th June, 2016.
Nasdaq: 5,176.77 (2nd December, 2015) – closed above this point on 1st August, 2016.
Dow Theory Conclusion: Original Dow Theory still sees price in a bear market because the transportations have failed to confirm an end to that bear market. Modified Dow Theory (adding S&P and Nasdaq) has failed still to confirm an end to the old bull market, modified Dow Theory sees price still in a bull market.
This analysis is published @ 09:41 p.m. EST.
Had to run off for a bit but nothing to see here as expected. I have no idea what is coming next. The failure to take the pivots is very bad for the bears, I don’t much care what their strategy is. These pivots are critical, and loosing the contest around them for several days in a row as the bears have means a break to the upside much more likely. I would have preferred the other outcome but it is what it is. I am now expecting upward movement for the near term and have adjusted my hedges accordingly.
Have a GREAAAAT week-end everyone and don’t let the banksters get you down…they have theirs coming; it may be sooner, it may be later….but its coming!! Cheerio!!!!
Good night and excellent week-end to all of you.
Patience is a virtue… we will win!
Yawn… The strategy of Lulling all Bulls to sleep!
Sleep well my friends… sleep well!
In my opinion, there is some bear intelligence beyond all this…the more they let bulls put their money in Mr Market, the more vulnerable they left them behind … …remember Sun Tzu, (The Art of War) : “Appear weak when you are strong, and strong when you are weak.”
Some huge bears are just waiting bulls to get exhausted before the final and huge mass attack…and believe me…again Sun Tzu: “Let your plans be dark and impenetrable as night, and when you move, fall like a thunderbolt.”
I think you are right about that. There is a lot of bearish moolah waiting for the pivot break and once it comes, it’s going to really go…if you know wadda mean! 🙂
I want to see futures take it out by at least one hundred DJI handles….
I am moving to all cash short term. Something about this price action smells very fishy. None of the wave counts yet invalidated but I am now betting on the bullish count and will wait for confirmation. I’ll eye this non-action for another 20 minutes and than I am outta here!
I am not at all happy about the bears failure to take out this round number. The longer it goes on the more difficult and unlikely it becomes. The banksters keep buying these break from multiple wedges and the bears seem completely unable to mount any momentum to the downside. Come on guys…do someething or get off the proverbial pot will ya??!
Let’s hope we are starting another first and second wave and that was not a fifth down… 🙁
Where are the banksters getting all this moolah?
They spent billions in the run-up yesterday.
They spent billions buying futures last night.
The are spending hundreds of millions fighting the down-trend today…
What the…*&%^%$$!!! 🙂
Farewell, Spanish Ladies… 🙂 🙂 🙂
Anybody let them shake you out of VIX long positions with that stupid stunt just before the plunge?! I didn’t! 🙂
Backing up the truck for the pivot break…
I like to move, it move it…!
There is no question that the violent whipsaws we often see in the market are much more than EW counts playing out. In addition to mindless bot algos, I suspect the banksters often target what they view as a “crowded trade” and perhaps even individual traders if they have a large enough position. A lot of traders are not aware that their brokerage firm may also be trading against their position, and with their superior capital position, can effortlessly take out their clients’ stops in the market . I probably should not have let that little kitty out of the bag but you really need to be aware of that. This is one reason I rarely put my stops in the market and maintain them whenever possible just mentally.
Based on an excellent wave count analysis by Lara on the Gold site and my own thinking about where the Euro was headed, I opened a pretty good sized bearish credit spread (109/110.50) awhile back and I swear the banksters did everything in their power to shake me out of it. At the time I entered the trade the FXE was trading around 108.50. I watched in amazement as over the next few weeks they ramped that animal all the way up to 110.25 on September 8 sending me quite a bit under water.
Currencies are funny things though and can only be manipulated for so long. I was still barely at break-even yesterday with the spread set to expire today but I was not budging and told the banksters to go pound sand by tripling my position! I thought they were full of it. I just love the look of that gap down today in FXE!!
Hoo Rah! 🙂
final stage the … tercio de muerte..
bye bye bulls
If this is a third down beginning, that pivot should fall…
I think the banksters are going throw the kitchen sink at this decline and try and buy as back towards the green today. If that happens I would be looking for a long slow crawl upwards and then a strong move down into the close…
Five minute chart does show a complete impulse down so we could be in a second wave up…
We need to stay below 2150.04 for the impulse down to remain in play…we now need to take out 2131.72 to confirm near term bearish potential…
I just got an ad in my inbox for Chinese gold panda coins sporting low premiums. Not interested. Too much tungsten adulterated gold comes out of that country. This particular dealer does very good due diligence but why bother…?!
I think the bears will stay out of trouble if that open VIX gap from yesterday’s 16.30 close remains open. I would even consider loading the canons into the week-end if it stays open, even without a pivot break…
The bears are making a run. Let’s see if they can change the market’s psychology which I think is from a sentiment point of view betting on the banksters. (you heard me this morning didn’t ya? 🙂 ). A VIX move above 20 is a sentiment game changer imo…
The banksters did spend a lot of capital buying futures out of deep in the red…maybe they weren’t expecting a brawl? Maybe it will turn into a maul… 🙂
Range … stay in the wood…the witches are not far away…
Every move the banksters do costs them money .. day after day.. the colossal amount of cash flow has reached the Rubicon…they cannot move backwards, the lost will be unrepairable … so, there is only one way in front of them: ahead…sky rocketing … but in some strate they will implode and explode, huge shooting star to see from down earth…
Frankly, I am terrified of holding any positions in this market overnight. I think the disaster is going to strike after hours, and traders are going to wake up to find themselves living their worst trading nightmares. People trading on leverage are probably going to be smoked, as happened during Brexit and the Swiss France unexpected ambush de-peg from the Euro. The banksters are not going to unwind their positions until forced to. I don’t expect they get margin calls. I am looking for a big intra-day gap down to give a hint of their loosing manipulative control..but first, that pesky pivot!
In the meantime. I am happy to accumulate volatility…nothing else… 🙂
Wow TDWaterhouse is not showing any bid/ask prices on options sell orders…i have been on phone for over 30 minutes and they have no clue…
That’s not good. It ususally means the brokerage has screwed something up. There is no reason so far as I can see why trading should not be proceeding normally. I executed a few orders already today…
I had ETrade do the same. For few minutes the quotes web page page was giving errors. After few minutes things became normal.
Looks like a common market feed problem.
The banksters are cunning. They knew that ramp up yesterday would make it harder for the bears to break the critical pivots which they really did not want happening just prior to a triple witching options and futures expiration Friday. A break yesterday would have resulted in a literal blood-bath this morning to it will be interesting to see of their strategem worked. If the pivots hold today, one would have to conclude that the scheme was quite effective…
There is an apparent selling pressure downwards…
The bears are trying but I think they lost this battle yesterday. They should have challenged that ramp up yesterday and forced a close closer to the pivots. Absent that, they really needed to sell futures through the pivots so they would have psychological and price momentum at the open. They face an uphill battle to break the pivots today imo…I am rooting for ’em but not trading that possibility…not yet…
Nice big red candles on the one minute chart shows the bears are eager to get started. The banksters are not going to go quietly. The fact that futures did not take out the pivots suggests this is going to be dogfight for probably the entire session. A VIX move above 20.52 and I will consider the bears case to have been convincingly made…in the meantime, I will plan on taking delivery on UVXY shares via my in the money calls expiring tomorrow just in case the banksters extend and pretend…
While I am thinking about it, I have to opine that the decadence, dystopia, and dysfunction of the bankster cartels is nothing short of staggering. Whether it be the reckless tens of trillions in radioactive derivatives that is ominously and silently smouldering and will ultimately set their financial houses on fire, or the hundreds of billions of paper gold contracts they have fraudulently executed, many multiples the the amount of Gold in actual existence, and which will guarantee a Gold price of 10,000.00/oz as soon as folk figure out what they have done. Another plunge in DB this morning is a harbinger of things to come, perhaps sooner than we think.
Here they are, stupidly spending literally billions to defend 18,000.00 and 2100.00 pivots in DJI and SPX respectively, instead of letting the market find its own level, and for what? Keeping up appearances until after the election? Don’t they understand that the longer they keep this up, the more catastrophic the ultimate day of reckoning will be? I know they are all planning to be safely ensconced in the various bunkers when the you-know-what hits the fan but what about the incredible wreckage they will be leaving in their wake? Any upward pop in US markets today should be a great shorting opportunity…the banksters are pushing on a string….I will continue to patiently wait for the pivot break…it may yet be delayed…but make no mistake…it is coming…
US consumer price is ahead of expectations, by 0.1 % -> FED hike in september.
FED cannot make no move: if it doesn’t move, all the splattered speach from FED’s officials, trying to impress with a september hike, will result as a defleated beach ball..they will loose their face. So FED is going to hike in september (swiss logic) .. TIC TAC …TIC TAC
The only question in my mind is whether the people talking about a possible rate hike with a straight face are that gullible, uninformed, or downright disingenuous in their commentary. It is no way possible for all these talking heads with all those letters after their names to not know the Scylla and Charybdis scenario the FED is facing, and instead of an intelligent conversation about what is going to happen to hard-working men and women when this thing blows up in all our faces, they keep blowing smoke up up our keysters about a POSSIBLE rate hike next week???! What the hell is wrong with these dolts?? I can only conclude that they consider their audience to be among the stupidest people on this beautiful earth that God created…. 🙂
Failure of futures to take out DJI 18,000.00 leaves open the possibility for US markets to once again trade in divergence from the European bourses. Triple witching should ensure volatility but the banksters are clearly trying to keep US traders off balance.
Foist again? Where’s everybody? 🙂
Kia ora.
On holiday?
Kia ora! Maybe. Most are ususally back after August. Perhaps the boring market has convinced some to extend their away time.