
Price is still within the confirmation / invalidation points and so both Elliott wave counts still remain valid.
Summary: Classic technical analysis today favours the alternate Elliott wave count. A new low below 2,111.05 would confirm the alternate. Price should then overall continue lower to at least 1,948. Only a new low below 1,810.10 would provide price confirmation of a larger bear market. To the upside, a new high above 2,187.87 would indicate the 9th of September as a false breakout. At that stage, expect price to keep going upwards to 2,233.
Last monthly chart for the main wave count is here.
New updates to this analysis are in bold.
MAIN WAVE COUNT
WEEKLY CHART
Click chart to enlarge.
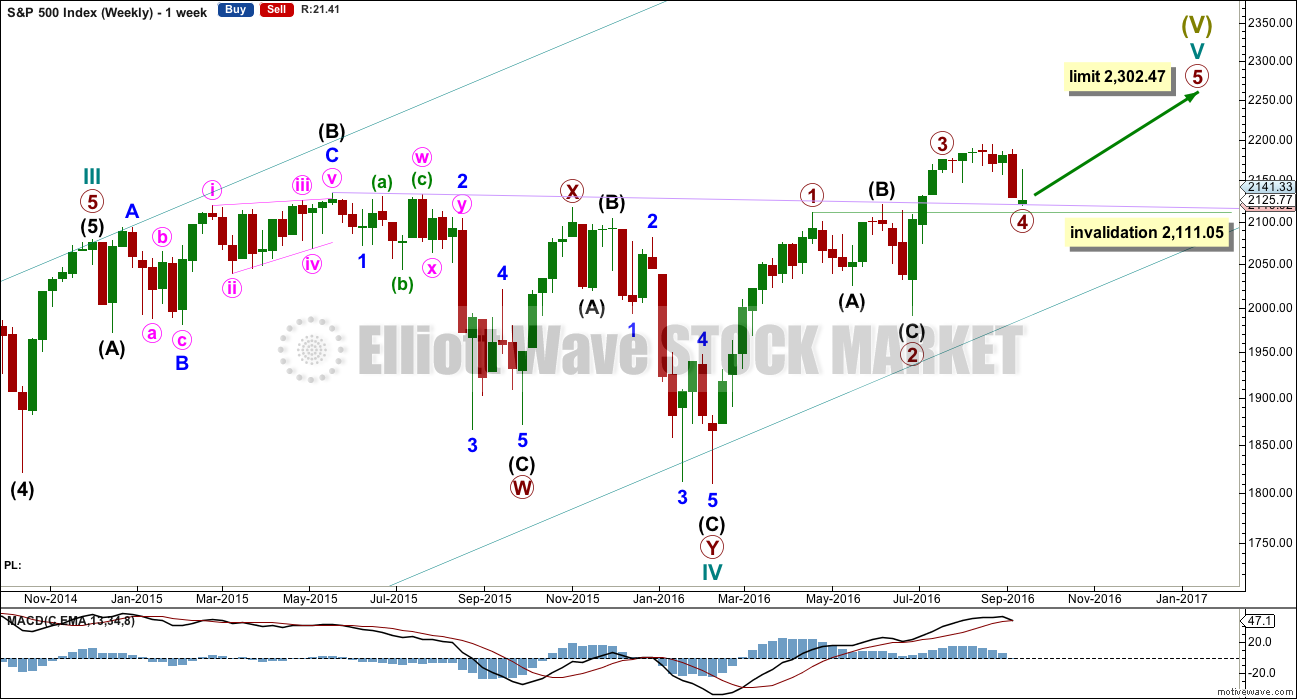
Cycle wave V must subdivide as a five wave structure. I have two wave counts for upwards movement of cycle wave V. This main wave count is presented first only because we should assume the trend remains the same until proven otherwise. Assume that downwards movement is a correction within the upwards trend, until proven it is not.
Primary wave 3 is shorter than primary wave 1, but shows stronger momentum and volume as a third wave normally does. Because primary wave 3 is shorter than primary wave 1 this will limit primary wave 5 to no longer than equality in length with primary wave 3, so that the core Elliott wave rule stating a third wave may not be the shortest is met. Primary wave 5 has a limit at 2,302.47.
Primary wave 2 was a shallow 0.40 expanded flat correction. Primary wave 4 may be exhibiting alternation as a more shallow triangle.
Primary wave 4 may not move into primary wave 1 price territory below 2,111.05.
It is also possible to move the degree of labelling within cycle wave V all down one degree. It may be that only primary wave 1 unfolding. The invalidation point for this idea is at 1,810.10. That chart will not be published at this time in order to keep the number of charts manageable. The probability that this upwards impulse is only primary wave 1 is even with the probability that it is cycle wave V in its entirety.
DAILY CHART
Click chart to enlarge.
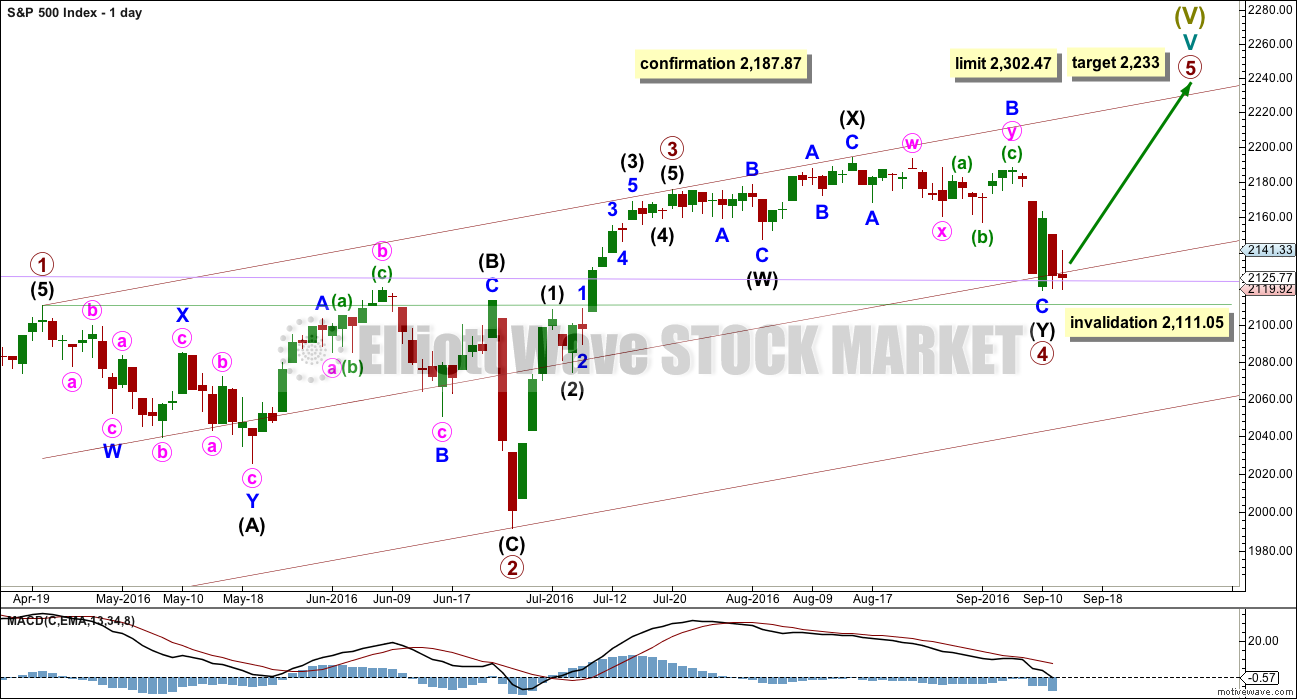
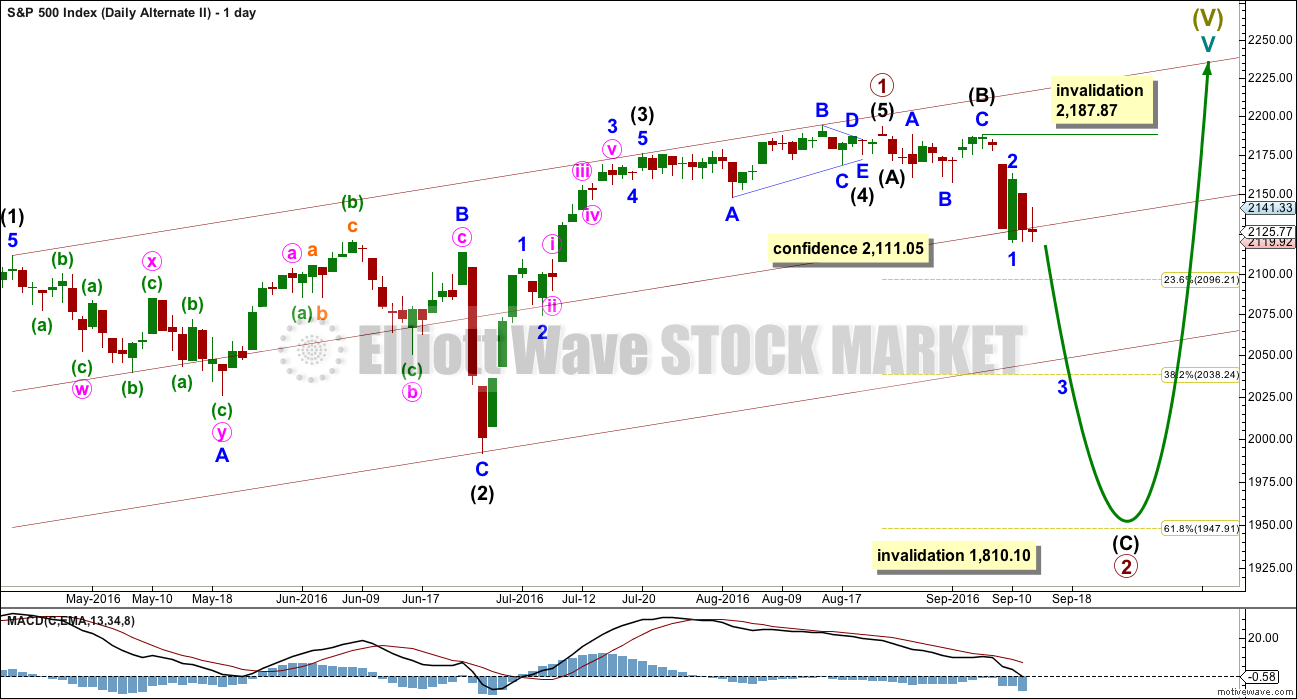
Primary wave 4 may be now complete as a double combination.
The first structure in the double is labelled intermediate wave (W) and is an expanded flat correction. The double is joined by a three in the opposite direction labelled intermediate wave (X). The second structure in the double is a zigzag labelled intermediate wave (Y).
The whole structure for primary wave 4 has a mostly sideways look, but the fact that intermediate wave (Y) has ended comfortably below the end of intermediate wave (W) must necessarily reduce the probability of this wave count. To achieve the purpose of taking up time and moving price sideways the second structure in a double should end close to the same level as the first and this one does not.
Primary wave 4 may not move into primary wave 1 price territory below 2,111.05.
Primary wave 1 lasted 47 days, primary wave 2 was even in duration at 47 days, primary wave 3 lasted 16 days, and so far primary wave 4 has lasted 39 days. The proportions between these waves are acceptable giving the wave count the right look.
If primary wave 5 has begun here, then at 2,233 it would reach 0.618 the length of primary wave 1.
A new high above 2,187.87 would invalidate the alternate daily wave count below and provide some confirmation of this main wave count.
HOURLY CHART
Click chart to enlarge.
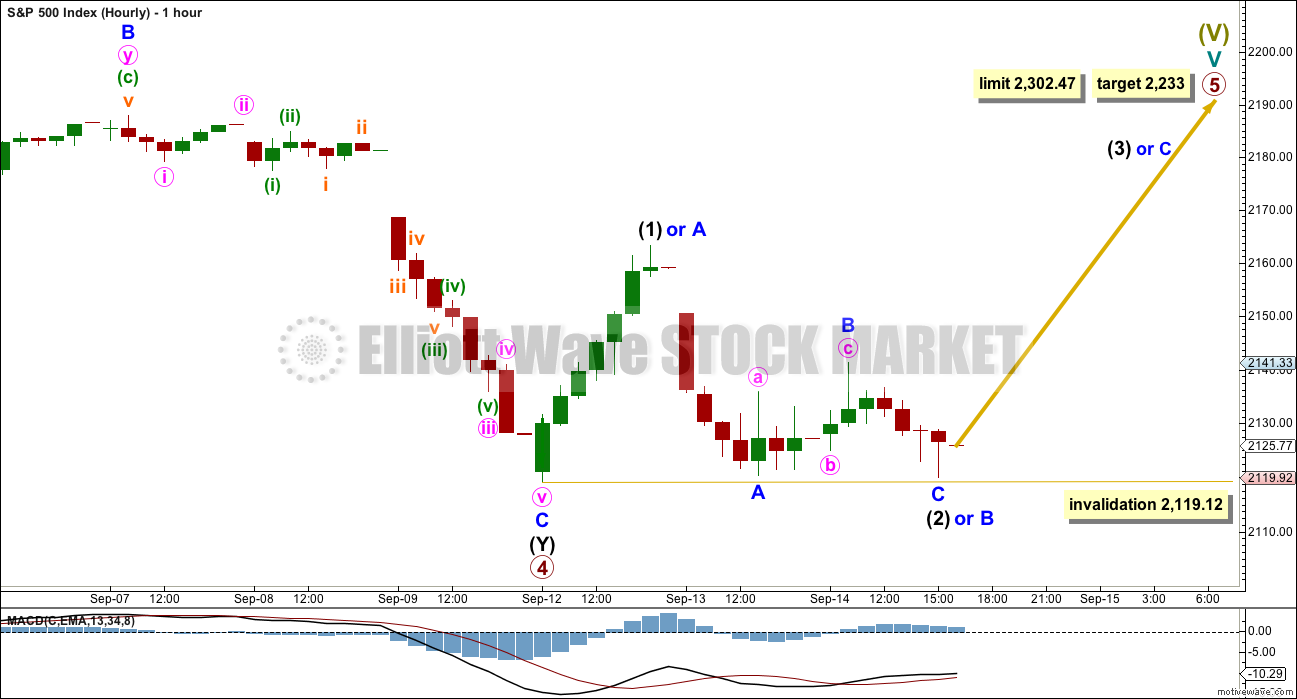
Within the zigzag of intermediate wave (Y), minor wave C is just 2.49 points longer than 2.618 the length of minor wave A. The structure is complete.
Primary wave 5 may unfold as either an impulse (more common) or an ending diagonal (slightly less common).
If an impulse upwards is unfolding for primary wave 5 then within it intermediate waves (1) and (2) would be complete. If intermediate wave (2) moves lower it may not move beyond the start of intermediate wave (1) below 2,119.12. Intermediate wave (3) may only subdivide as a five wave impulse and it must move above the end of intermediate wave (1) at 2,163.30.
If an ending diagonal is unfolding for primary wave 5 then within it all the sub-waves may only subdivide as zigzags. So far a zigzag for intermediate wave (1) would be incomplete, only minor waves A and most likely B would be complete. Minor wave C must move above the end of minor wave A at 2,163.30 to avoid a truncation. This idea is outlined today with alternate labelling. If minor wave B continues any lower it may not move below the start of minor wave A at 2,119.12.
Both an impulse or ending diagonal would now require a five wave structure upwards to move above 2,163.30, there is at this stage no divergence in expectations for direction.
Only when these two possibilities diverge in terms of expected direction or invalidation points will they be separated into two separate charts.
ALTERNATE WAVE COUNT
WEEKLY CHART
Click chart to enlarge.
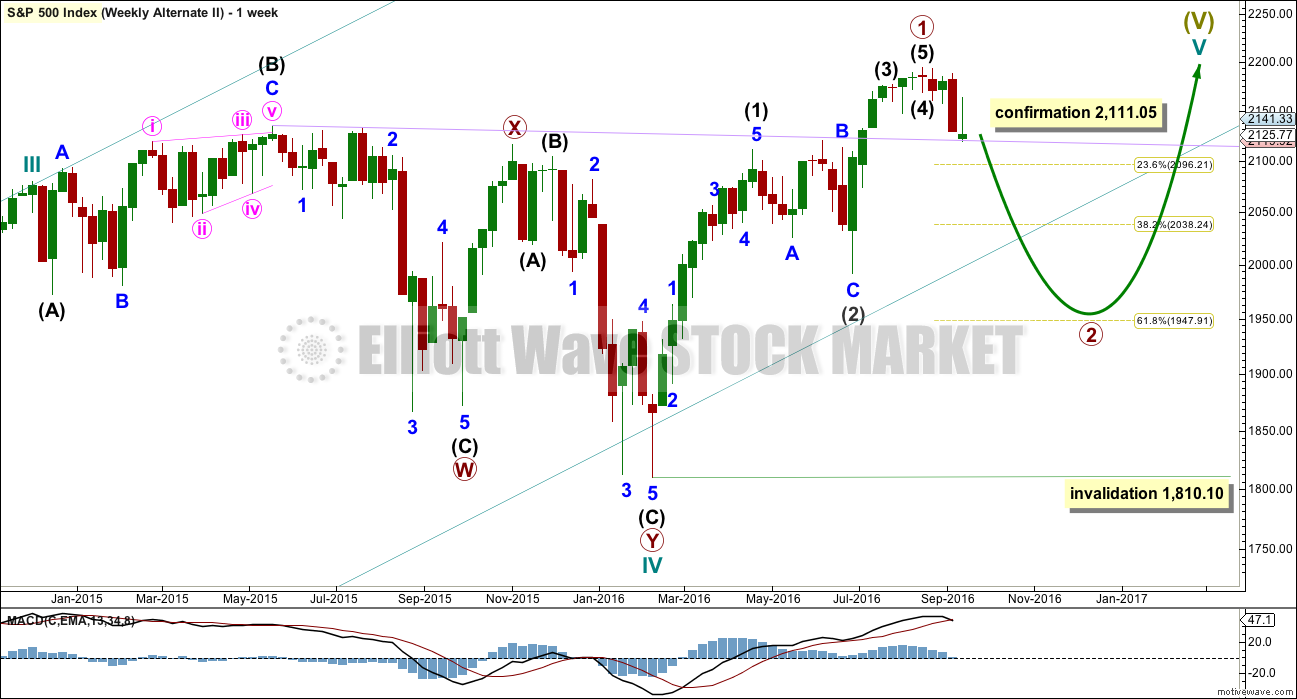
What if an impulse upwards is complete? The implications are important. If this is possible, then primary wave 1 within cycle wave V may be complete.
If the degree of labelling within cycle wave V is moved up one degree, then it is possible that recently Super Cycle wave (V) ended and the S&P has just begun a very large bear market to span several years. This scenario is possible, but absolutely requires price confirmation before it can be taken seriously. Only a new low below 1,810.10 would confirm this very bearish scenario.
If an impulse upwards is complete, then a deep second wave correction may be unfolding for primary wave 2. If primary wave 2 is to reach as low as the 0.618 Fibonacci ratio then it would break below the larger teal channel about Super Cycle wave (V) which is copied over here from the monthly chart. This is possible, the S&P does tend to break out of it’s channels towards the end of a movement, yet still continues in the prior direction before turning.
Primary wave 2 may not move beyond the start of primary wave 1 below 1,810.10.
DAILY CHART
Click chart to enlarge.
If an impulse upwards is complete, then how may it subdivide and are proportions good?
Intermediate wave (1) was an impulse lasting 47 days. Intermediate wave (2) was an expanded flat lasting 47 days. Intermediate wave (3) fits as an impulse lasting 16 days, and it is 2.04 points short of 0.618 the length of intermediate wave (1). So far this alternate wave count is identical to the main wave count (with the exception of the degree of labelling, but here it may also be moved up one degree).
Intermediate wave (4) may have been a running contracting triangle lasting 22 days and very shallow at only 0.0027 the depth of intermediate wave (3). At its end it effected only a 0.5 point retracement. There is perfect alternation between the deeper expanded flat of intermediate wave (2) and the very shallow triangle of intermediate wave (4). All subdivisions fit and the proportion is good.
Intermediate wave (5) would be very brief at only 18.29 points. Intermediate wave (5) is 1.43 points longer than 0.056 the length of intermediate wave (1).
So far primary wave 2 may be unfolding as a zigzag. The common depth for a second wave is the 0.618 Fibonacci ratio of the first wave it is correcting, so a reasonable expectation for primary wave 2 would be to end about 1,948.
Within intermediate wave (C), no second wave correction may move beyond the start of its first wave above 2,187.87.
Primary wave 2 may not move beyond the start of primary wave 1 below 1,810.10. A new low below this point would see the degree of labelling within cycle wave V moved up one degree. At that stage, a trend change at Super Cycle degree would be expected and a new bear market to span several years would be confirmed.
HOURLY CHART
Click chart to enlarge.
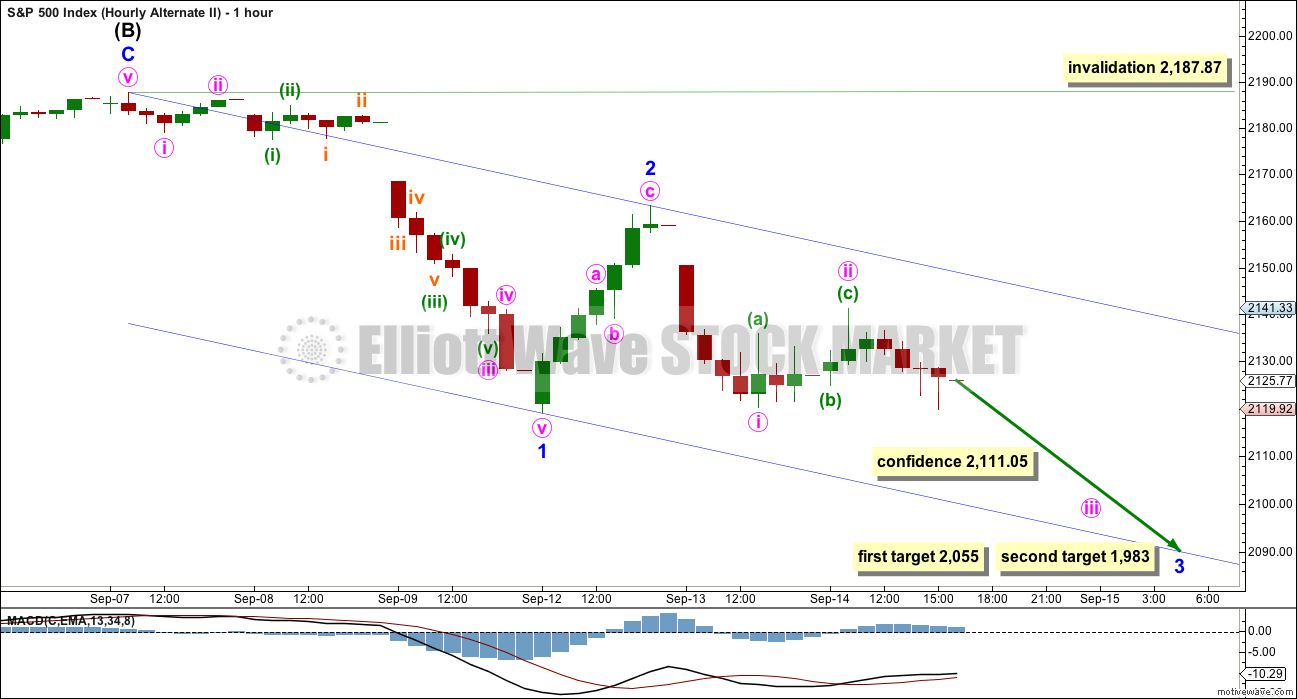
Downwards movement would be either intermediate wave (C) if the degree of labelling on the daily chart is correct, or intermediate wave (3) if the degree of labelling is moved up one degree. Both ideas should see a five wave impulse complete lower for this alternate wave count.
Minor wave 2 may be over, or it may still continue sideways and / or higher as a flat correction. It may not move beyond the start of minor wave 1 above 2,187.87.
At 2,055 minor wave 3 would reach 1.618 the length of minor wave 1. If price gets to this first target and just keeps falling, or if it gets there and the structure is incomplete, then the second target would be used. At 1,983 minor wave 3 would reach 2.618 the length of minor wave 1.
If minor wave 2 continues higher, then these targets must be recalculated.
If price makes a new low tomorrow below 2,111.05, then this alternate wave count would be used. At that stage, several more days of overall downwards movement, if not weeks, would be expected.
TECHNICAL ANALYSIS
WEEKLY CHART
Click chart to enlarge. Chart courtesy of StockCharts.com.
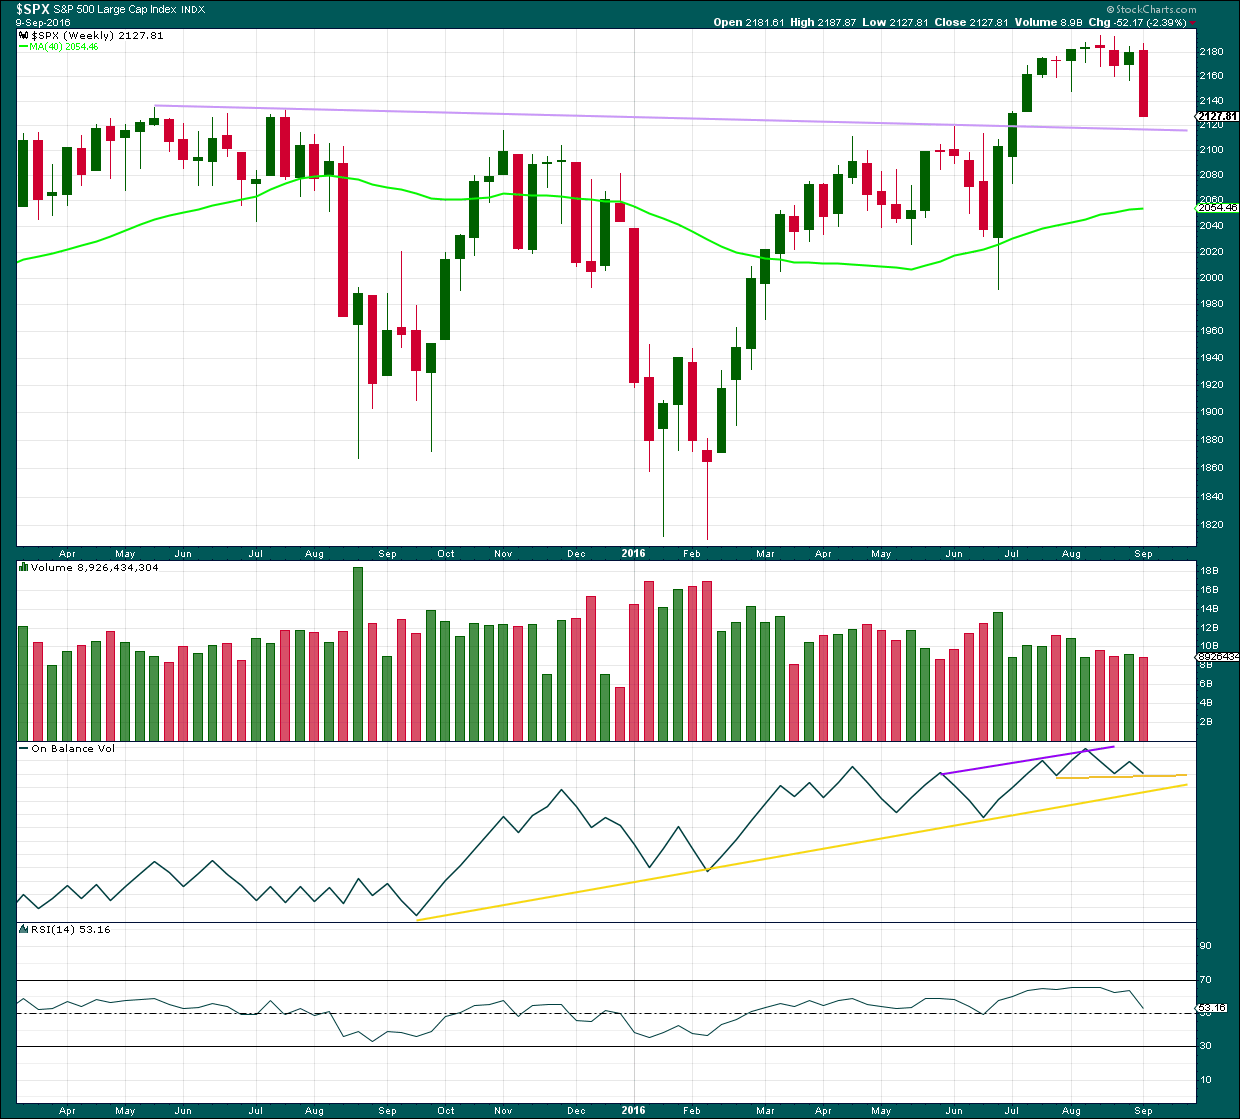
Last week has closed below an important resistance point at 2,134. This is the prior all time high from May 2015. This close is significant. On its own it is not enough to turn to full bearish, but it is one piece of evidence to weigh up.
The long held lilac trend line should be expected to offer strong support for price along the way down. Draw it from the prior all time high in May 2015 to the first small swing high in July 2015. This line is drawn also on weekly Elliott wave charts.
Volume for last week is lighter than the prior upwards week. The fall in price at the weekly chart level does not look like it was supported by volume, but to get a clearer picture it is necessary to look inside last week at daily volume bars.
On Balance Volume has come down to find support at a short term yellow line. The next support line is close by. These lines may assist to halt the fall in price.
RSI is just above neutral. There is plenty of room for price to rise or fall. There is no divergence at the weekly chart level to indicate weakness.
DAILY CHART
Click chart to enlarge. Chart courtesy of StockCharts.com.
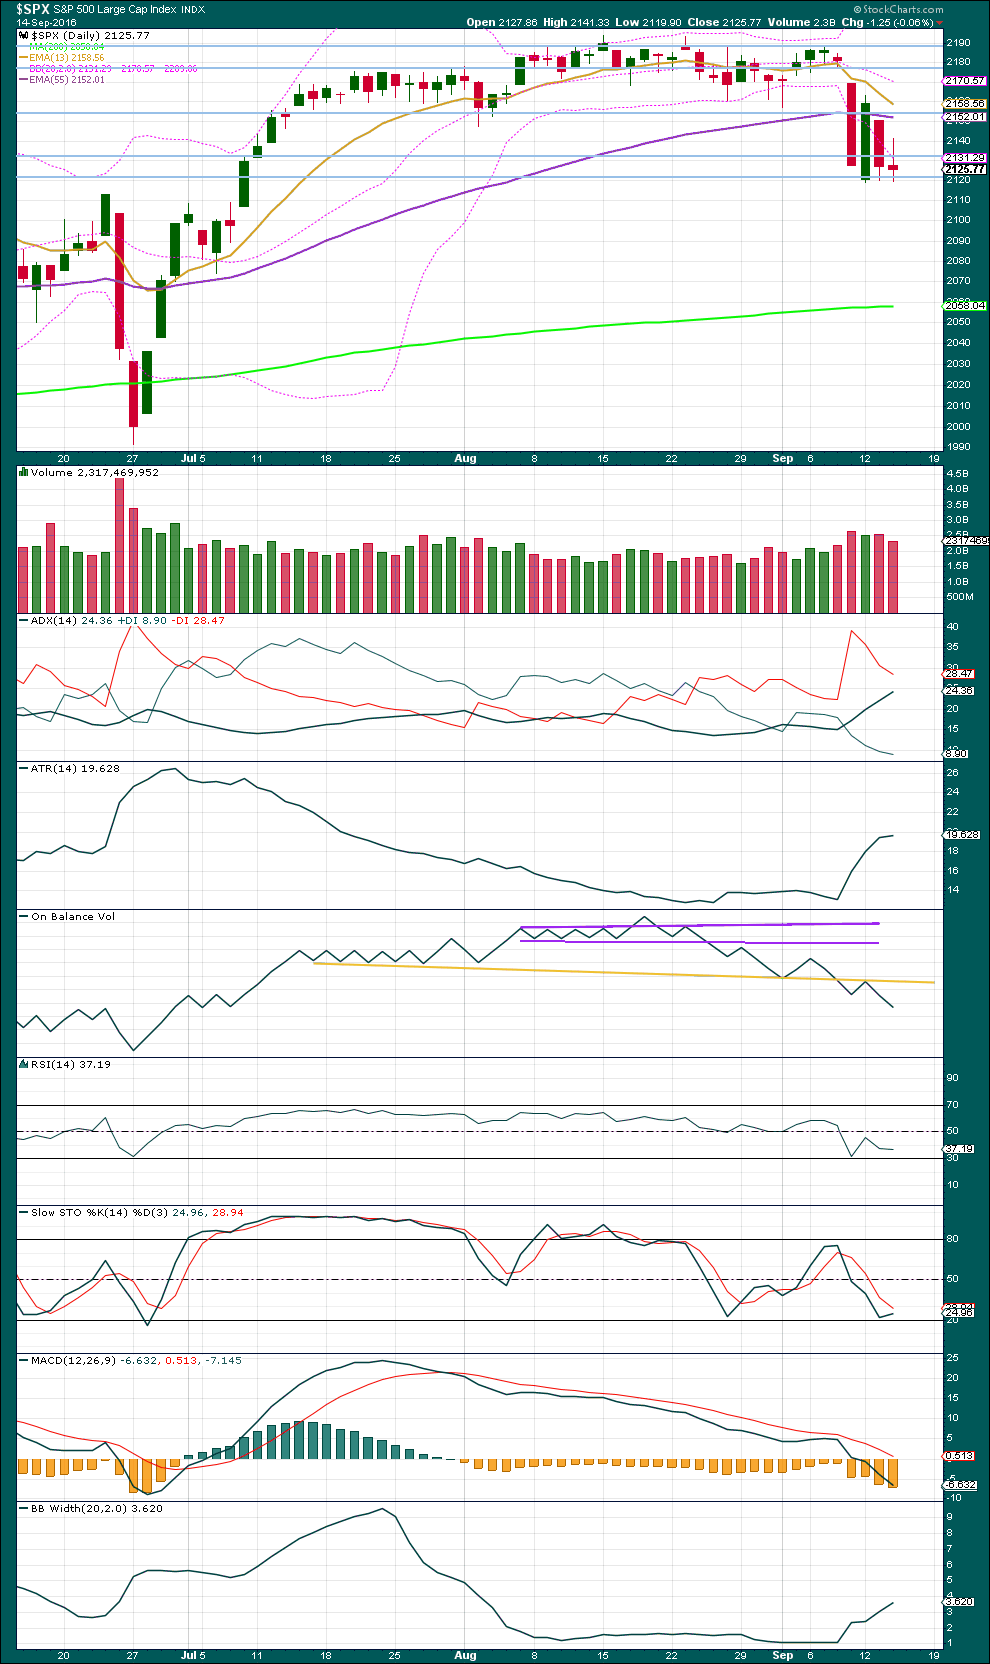
Another red daily candlestick is overall bearish. This session has a slightly lower low, and a lower high. Overall price moved lower. The long upper wick is bearish.
Slightly lighter volume for today does suggest the bears are tiring. The fall in price is not as well supported by volume for this session.
The signal from On Balance Volume though is judged to be stronger than daily volume bars, slightly. OBV breaking below the yellow line and then testing that line for resistance, now moving lower and away is a reasonably strong bearish signal. This supports the alternate Elliott wave count.
ADX still indicates there is a downwards trend in place. ATR agrees that this market is now trending. Bollinger Bands are widening, typical of a trending market. With all three indicators in agreement some confidence should be had that a downwards trend is very likely now beginning.
Stochastics is not extreme. This oscillator may remain extreme for reasonable periods of time during a trending market.
RSI is not yet extreme. This indicator may also remain extreme for periods of time during a trending market.
Overall this analysis favours the alternate Elliott wave count over the main Elliott wave count.
VOLATILITY – INVERTED VIX CHART
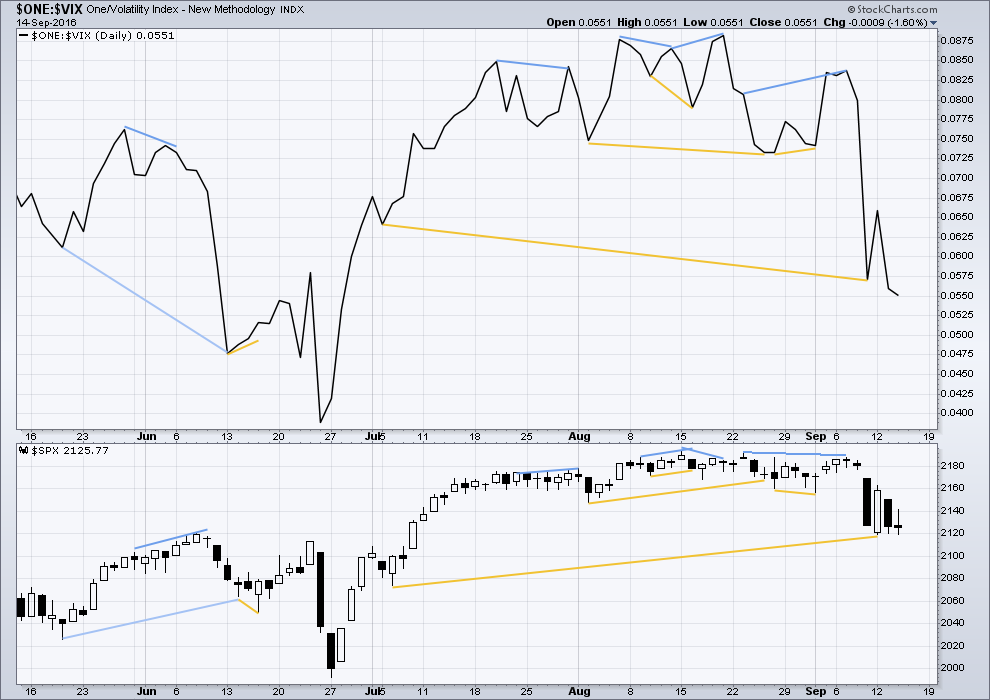
Click chart to enlarge. Chart courtesy of StockCharts.com.
Volatility is declining as price is rising. This is normal for an upwards trend.
There are a few instances of multi day divergence between price and inverted VIX noted here. Bearish divergence is blue. Bullish divergence is yellow. It appears so far that divergence between inverted VIX and price is again working to indicate short term movements spanning one or two days.
Today VIX and price both moved slightly lower. There is no divergence today to indicate weakness.
BREADTH – AD LINE
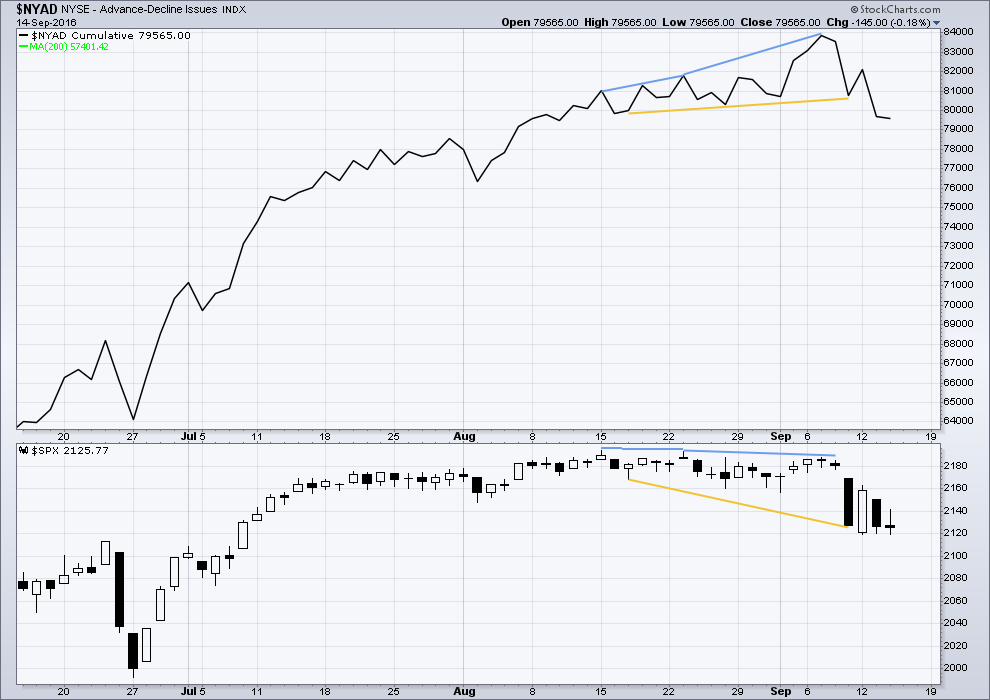
Click chart to enlarge. Chart courtesy of StockCharts.com.
There is support from market breadth as price is rising.
Short term bullish and bearish divergence is again working between price and the AD line to show the direction for the following one or two days.
Today both price and the AD line moved slightly lower. There is no short term divergence today to indicate weakness.
DOW THEORY
Major lows within the old bull market:
DJIA: 15,855.12 (15th October, 2014) – closed below on 25th August, 2015.
DJT: 7,700.49 (12th October, 2014) – closed below on 24th August, 2015.
S&P500: 1,821.61 (15th October, 2014) – has not closed below this point yet.
Nasdaq: 4,117.84 (15th October, 2014) – has not closed below this point yet.
Major highs within the bear market from November 2014:
DJIA: 17,977.85 (4th November, 2015) – closed above on 18th April, 2016.
DJT: 8,358.20 (20th November, 2015) – has not closed above this point yet.
S&P500: 2,116.48 (3rd November, 2015) – closed above this point on 8th June, 2016.
Nasdaq: 5,176.77 (2nd December, 2015) – closed above this point on 1st August, 2016.
Dow Theory Conclusion: Original Dow Theory still sees price in a bear market because the transportations have failed to confirm an end to that bear market. Modified Dow Theory (adding S&P and Nasdaq) has failed still to confirm an end to the old bull market, modified Dow Theory sees price still in a bull market.
This analysis is published @ 08:53 p.m. EST.
It’s not looking good today for the bear case, not for the short term anyway.
Lets see what volume has to say about this today.
For the bear count I’m going to see minor 2 continuing, that now has a better look in terms of the trend channel. Which means it should move up to complete minute c, above 2,119.12 to avoid a truncation.
Yawn… Just lulling the Bulls to sleep before taking a BAT to their knee caps!
While this did make me giggle Joe, I will respectfully ask that violent imagery is toned down a bit please. That one is just a bit too.. explicit or realistic?
I think it would be nicer if we didn’t use it.
This may be considered…. a bit OTT. But hey, it’s my website 🙂
Thank you very much.
It is sure starting to look like the bears have gone back into hibernation. This big green candle today looking quite bullish and the fact that there has been no reversal of the upwards movement means we are probably going higher. Invalidation for the bearish count is almost 2188 so we can easily kiss the underside of the 50 DMA at 2167 and still maintain the current down-trend. Until tomorrow…Cheerio! 🙂
Those market makers must be reading Lara’s site. They took the bid exactly down to 0.33 just long enough to shake me out…I shoulda guessed! (or kept my stop at 0.25!!) … 🙂
Stopped out. Looks like the rip will continue.
This is almost always the outcome of the bears’ failing to take out critical pivot points. We could be headed back up to test underside of 50 DMA….
It is remarkable how the banksters can execute these rips on low volume to try and keep the bears at bay…let’s see how high it goes…
O.K. We’ve got the 200 point pop I was expecting from the banksters. Very close to being stopped out on those speculative puts. That should be just about all she wrote if the down-trend is to hold…
good call last night Vern.
Moved stop on DIA 181.5 puts to 0.35. Will add contracts if bid goes back above 0.50…
DIA puts bid at 0.78, should go to at least 1.20 for a quick double on counter-trend trade…
If the pattern holds, we should be close to a gap down from a bear pennant….
Opening speculative trade on DIA 181.5 puts expiring tomorrow @ 0.58 per contract…very small contingent as is proper for speculative trades…! Stop at 0.25 🙂
The long and winding wedge seems to be the wave structure du jour. We have yet another one underway today. Perhaps the break from this one will accomplish the task of punching through that intractable pivot…
One of the most difficult things for traders to do is take advantage of counter-trend moves. It is difficult to do because it is so counter-intuitive as these moves are often quite violent. Yesterday, for those of you watching the price of crude, was a spectacular example. I am sure quite a few bulls as well as bears got absolutely hammered by that unbelievable spike up that was almost immediately reversed, destroying stops on both sides of the trade in all likelihood. I posted a link to an outstanding video by Chris Ciovacco awhile back in which he made some excellent points about staying with an intact trend. The one qualification I would have added to his overall excellent points was with respect to his often repeated phrase throughout the presentation- “Volatility to be ignored”.
With all due respect to Chris, telling a trader to ignore volatility is like telling a fish to ignore water. That advice may be sound for long term investors, but for traders, volatility is the environment in which he thrives, and for some is even a matter of survival. If you are buying options, you cannot survive without volatility. Very few traders know how to successfully navigate a sideways market and we all know that (depending on the time frame, of course) the market is not always trending. In fact some claim that this is the case about 70% of the time! We certainly saw an example of that fact recently.
I suspect the current trend is down, and while I am waiting for a break of DJI 18,000.00 to trigger new short side trades, the smart thing to do now most probably is sell the rips, and NOT buy the dips… 🙂
I completely agree Verne re volatility.
I think Chris Ciovacco’s model is for long term investing and wealth management. Not day trading, not even swing trading.
And so the approach is quite different.
When we get price confirmation from the S&P below 2,111 that will also be time to have some confidence in a downwards trend.
There’s a good example of volatility in Gold today with it’s wild whipsaw. Taking out stops, including me (idiot! did that wrong again) and inducing fear and confusion when the larger trend is still intact.
Happened to me more times than I care to remember…including today! 🙂 🙂
I would expect VIX to drop back to the 16 area due to long term trendline resistance. There is a trendline support there that can be tested. If the VIX can hold that region, then I suspect it will break to the upside for the real VIX spike into the 20’s, 30’s, etc.
However, VIX below 16 for any extended period of time would likely lead to new ATH’s. I see UVXY at $22 range to be an area to load up with a stop below $20…risky, risky, but could be rewardy, rewardy. I see UVXY in a large upward-moving channel since Thursday of last week. This scenario I see valid for only this week…next week, who knows?
This could be the bounce zone right here…no way to really know…
Hi! 🙂
Gidday 🙂