
Downwards movement was not expected to break below 2,157.09 for Friday.
Friday closed at 2,127.81.
Summary: Friday’s 90% down day is likely to be followed by at least 2-7 days of rebound. A new alternate wave count has a good look, and it expects Friday was the start of a deeper correction to about 1,950. This would be confirmed below 2,111.05. A larger bear market requires price confirmation below 1,810.10. On Balance Volume and volume bars favour the new alternate Elliott wave count. Divergence favours the main Elliott wave count.
Last monthly chart for the main wave count is here.
New updates to this analysis are in bold.
MAIN WAVE COUNT
WEEKLY CHART
Click chart to enlarge.
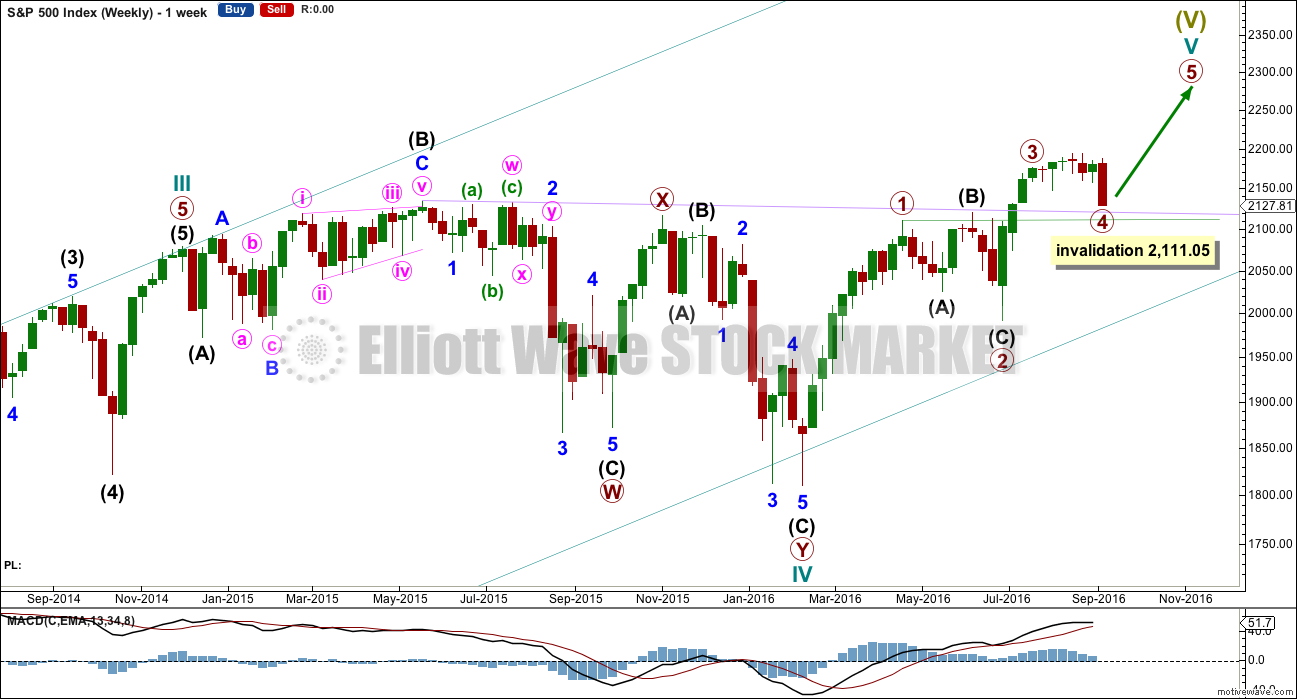
Cycle wave V must subdivide as a five wave structure. At the end of this week, I have two wave counts for upwards movement of cycle wave V. This main wave count is presented first only because we should assume the trend remains the same until proven otherwise. Assume that downwards movement is a correction within the upwards trend, until proven it is not.
Primary wave 3 is shorter than primary wave 1, but shows stronger momentum and volume as a third wave normally does. Because primary wave 3 is shorter than primary wave 1 this will limit primary wave 5 to no longer than equality in length with primary wave 3, so that the core Elliott wave rule stating a third wave may not be the shortest is met. Primary wave 5 will be limited to no longer than 183.95 points in length.
Primary wave 2 was a shallow 0.40 expanded flat correction. Primary wave 4 may be exhibiting alternation as a more shallow triangle.
Primary wave 4 may not move into primary wave 1 price territory below 2,111.05.
It is also possible to move the degree of labelling within cycle wave V all down one degree. It may be that only primary wave 1 unfolding. The invalidation point for this idea is at 1,810.10. That chart will not be published at the end of this week in order to keep the number of charts manageable. The probability that this upwards impulse is only primary wave 1 is even with the probability that it is cycle wave V in its entirety.
DAILY CHART
Click chart to enlarge.
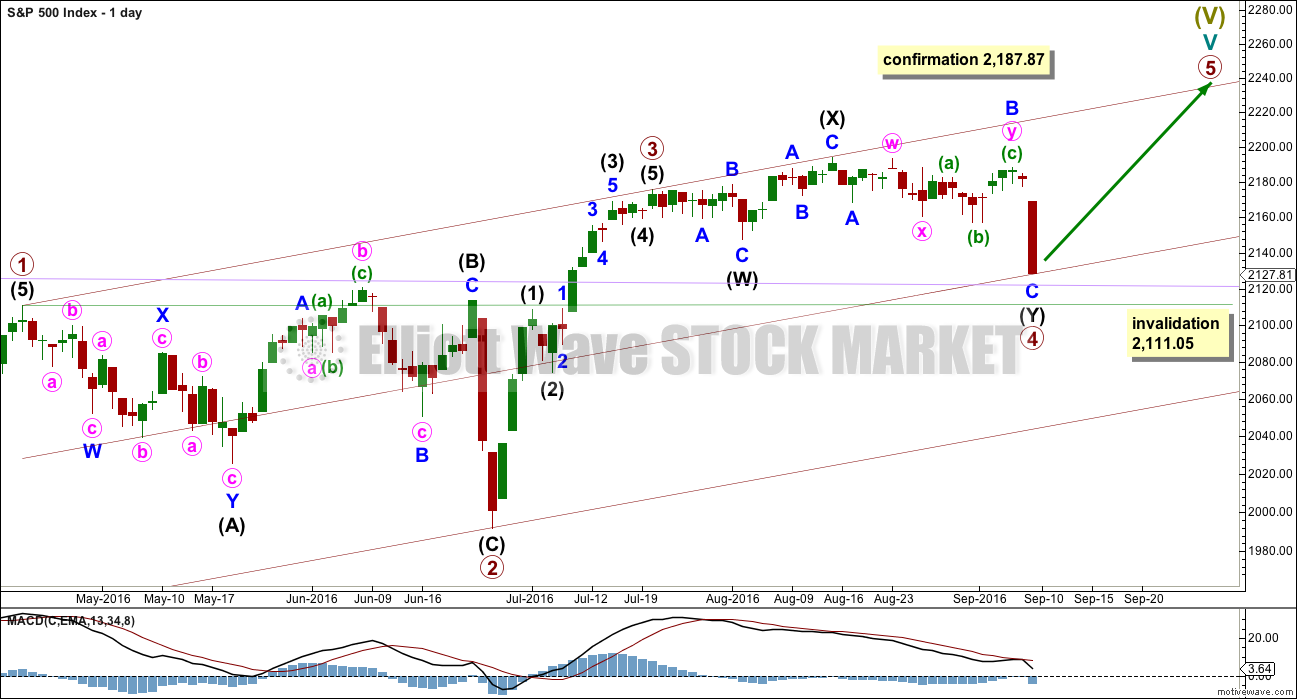
The triangle for primary wave 4 was invalidated below 2,157.09. Primary wave 4 may be completing as a double combination.
The first structure in the double is labelled intermediate wave (W) and is an expanded flat correction. The double is joined by a three in the opposite direction labelled intermediate wave (X). The second structure in the double is a zigzag labelled intermediate wave (Y).
If intermediate wave (Y) ends here, then it would look only a little odd. It does end reasonably below intermediate wave (W) but most of the structure is sideways. If intermediate wave (W) moves lower, then the probability of this structure being correct will reduce. Combinations exist to take up time and move price sideways, so the second structure in the double should end close to the same level as the first to achieve this purpose.
Primary wave 4 may not move into primary wave 1 price territory below 2,111.05.
Primary wave 1 lasted 47 days, primary wave 2 was even in duration at 47 days, primary wave 3 lasted 16 days, and so far primary wave 4 has lasted 38 days. The proportions between these waves are acceptable giving the wave count the right look.
HOURLY CHART
Click chart to enlarge.
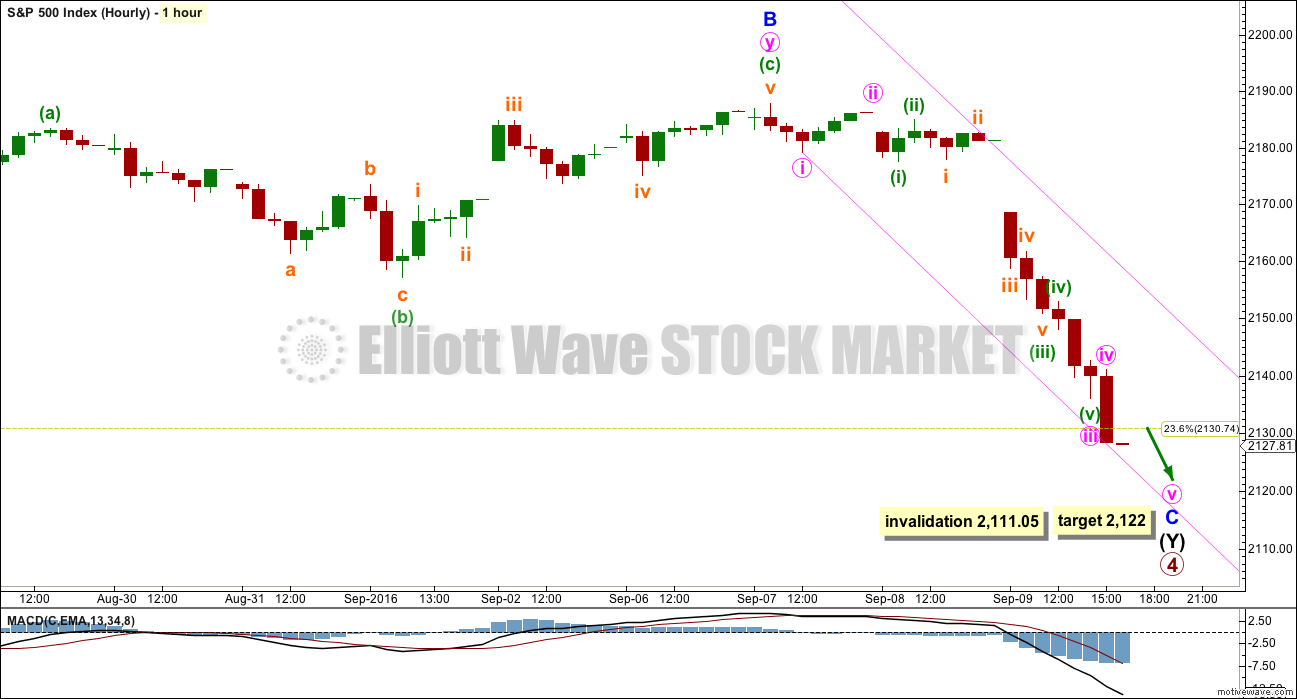
Within intermediate wave (Y), at 2,122 minor wave c would reach 2.618 the length of minor wave A. This target would still see primary wave 4 a relatively shallow correction, so it would not reach the 0.382 Fibonacci ratio.
The target does not have to be reached; the structure of minor wave C could already be complete.
The pink channel is a best fit. If price breaks above it, then it would indicate a trend change.
ALTERNATE WAVE COUNT
WEEKLY CHART
Click chart to enlarge.
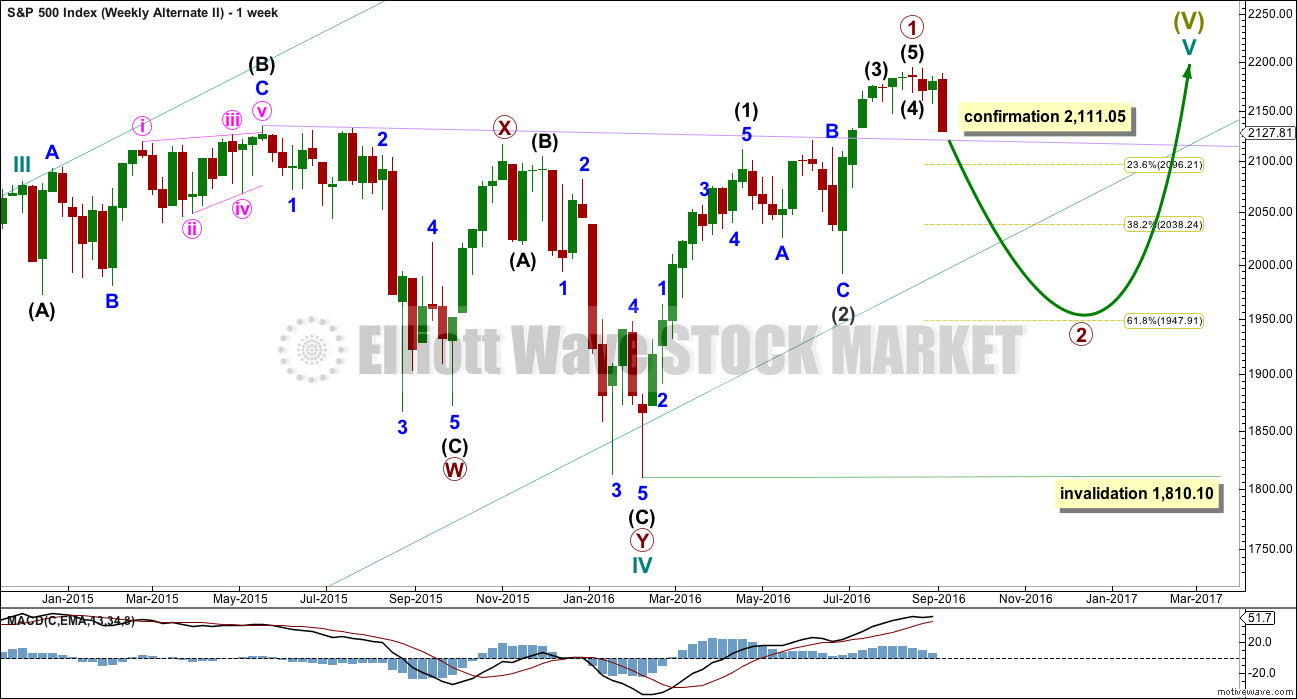
This alternate is new. What if an impulse upwards is complete? The implications are important. If this is possible, then primary wave 1 within cycle wave V may be complete.
If the degree of labelling within cycle wave V is moved up one degree, then it is possible that recently Super Cycle wave (V) ended and the S&P has just begun a very large bear market to span several years. This scenario is possible, but absolutely requires price confirmation before it can be taken seriously. Only a new low below 1,810.10 would confirm this very bearish scenario.
If an impulse upwards is complete, then a deep second wave correction may be unfolding for primary wave 2.
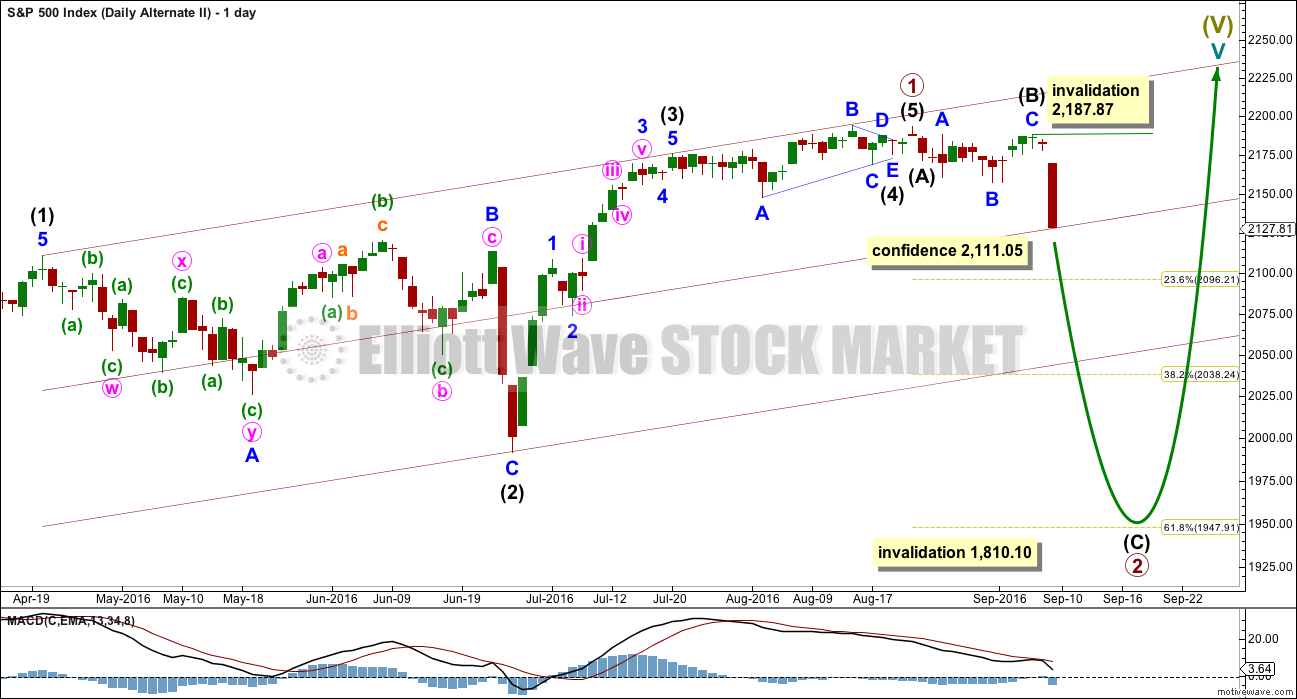
DAILY CHART
Click chart to enlarge.
If an impulse upwards is complete, then how may it subdivide and are proportions good?
Intermediate wave (1) was an impulse lasting 47 days. Intermediate wave (2) was an expanded flat lasting 47 days. Intermediate wave (3) fits as an impulse lasting 16 days, and it is 2.04 points short of 0.618 the length of intermediate wave (1). So far this alternate wave count is identical to the main wave count (with the exception of the degree of labelling, but here it may also be moved up one degree).
Intermediate wave (4) may have been a running contracting triangle lasting 22 days and very shallow at only 0.0027 the depth of intermediate wave (3). At its end it effected only a 0.5 point retracement. There is perfect alternation between the deeper expanded flat of intermediate wave (2) and the very shallow triangle of intermediate wave (4). All subdivisions fit and the proportion is good.
Intermediate wave (5) would be very brief at only 18.29 points. Intermediate wave (5) is 1.43 points longer than 0.056 the length of intermediate wave (1).
So far primary wave 2 may be unfolding as a zigzag. The common depth for a second wave is the 0.618 Fibonacci ratio of the first wave it is correcting, so a reasonable expectation for primary wave 2 would be to end about 1,950.
Within intermediate wave (C), no second wave correction may move beyond the start of its first wave above 2,187.87.
Primary wave 2 may not move beyond the start of primary wave 1 below 1,810.10. A new low below this point would see the degree of labelling within cycle wave V moved up one degree. At that stage, a trend change at Super Cycle degree would be expected and a new bear market to span several years would be confirmed.
TECHNICAL ANALYSIS
WEEKLY CHART
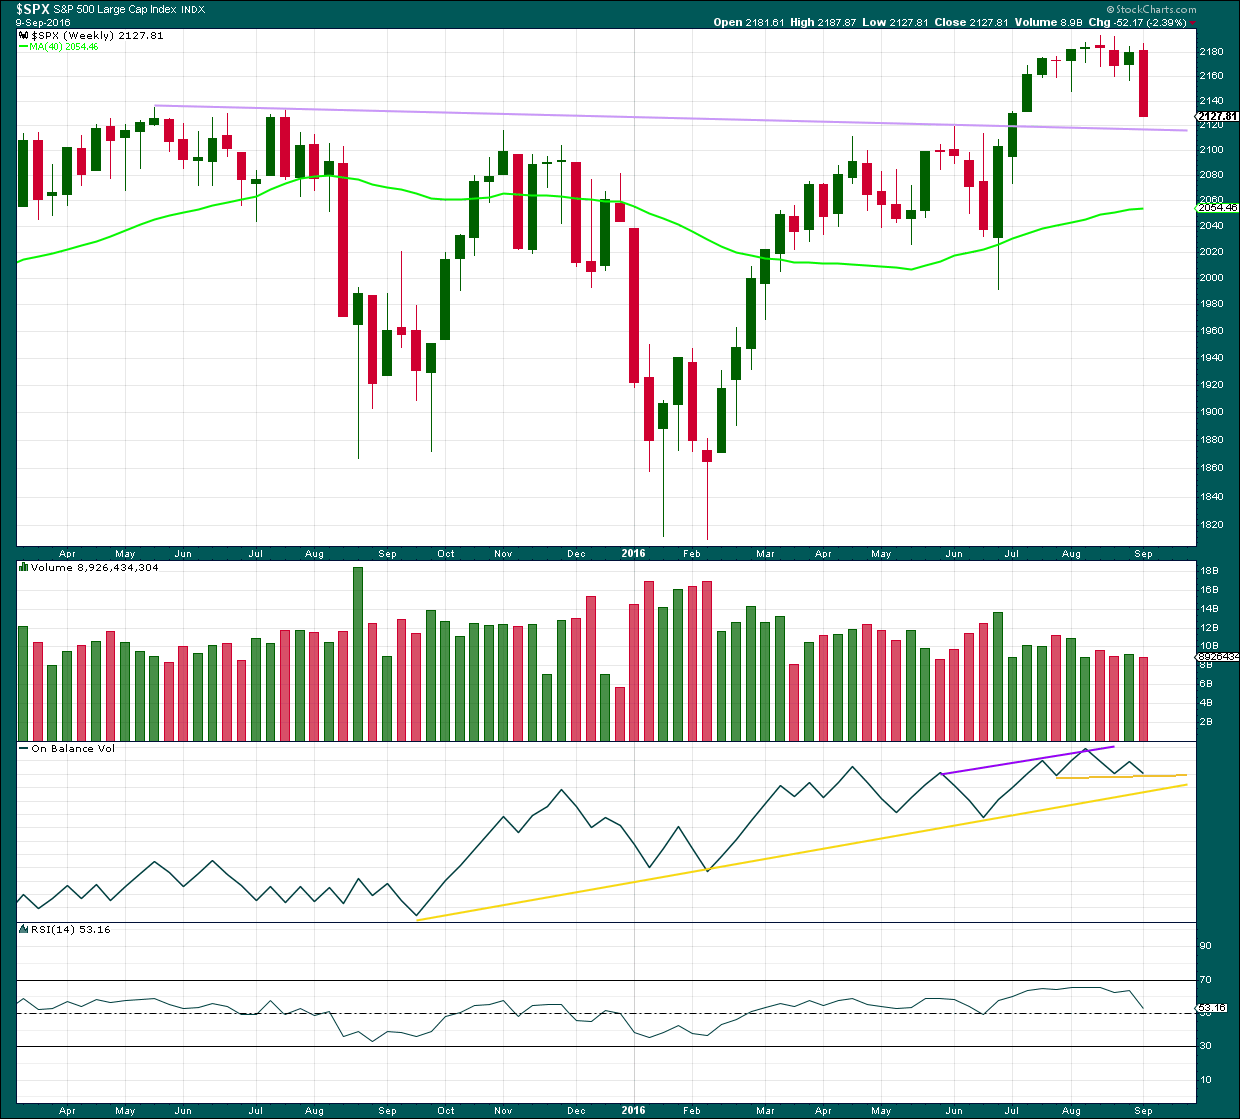
Click chart to enlarge. Chart courtesy of StockCharts.com.
This week has closed below an important resistance point at 2,134. This is the prior all time high from May 2015. This close is significant. On its own it is not enough to turn to full bearish, but it is one piece of evidence to weigh up.
The long held lilac trend line should be expected to offer strong support for price along the way down. Draw it from the prior all time high in May 2015 to the first small swing high in July 2015. This line is drawn also on weekly Elliott wave charts.
Volume for this week is lighter than the prior upwards week. The fall in price at the weekly chart level does not look like it was supported by volume, but to get a clearer picture it is necessary to look inside this week at daily volume bars.
On Balance Volume has come down to find support at a short term yellow line. The next support line is close by. These lines may assist to halt the fall in price.
RSI is just above neutral. There is plenty of room for price to rise or fall. There is no divergence at the weekly chart level to indicate weakness.
DAILY CHART
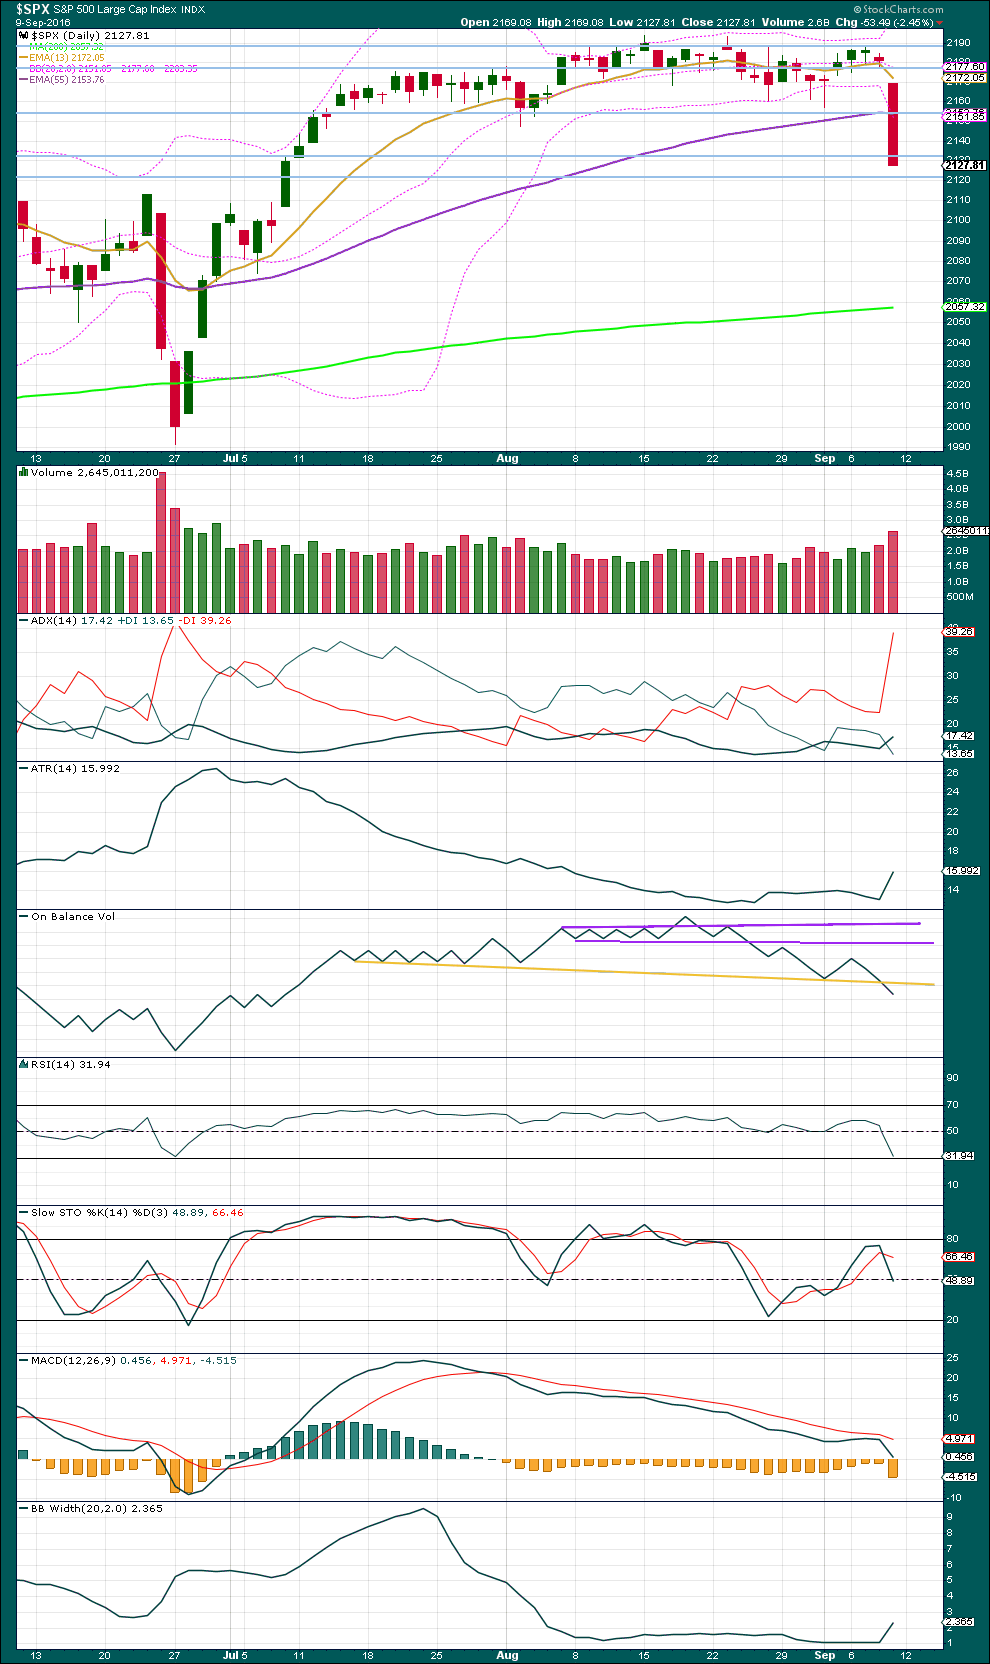
Click chart to enlarge. Chart courtesy of StockCharts.com.
Price is no longer range bound. It has broken out downwards. A reaction may be expected which may find resistance at prior support about 2,155.
The downwards breakout has occurred on a day with an increase in volume. The fall in price for Thursday and Friday is supported by volume. Looking inside this week the volume profile is bearish. A further fall in price is likely.
Looking at the bigger picture though this one strong downwards day is not enough yet to turn full bearish. The shorter 13 day moving average is sloping downwards, but it is still above the mid term 55 day moving average. The 55 day average is still sloping upwards, as is the long term 200 day moving average.
ADX at the end of the week indicates the early stage of a new downwards trend. ATR agrees as it is increasing.
On Balance Volume has broken below support at the yellow line on Friday. This is a bearish signal. The prior longer term divergence noted between OBV and price from the lows of 2nd August to 1st September, which was bullish, clearly did not work. It was not followed by upwards movement. Divergence again does not appear to be working prior to strong movements.
Divergence between lows from 2nd August to 1st September was also noted between price and RSI. This divergence was bullish but has not been followed by upwards movement. It has been followed very strongly by the opposite. Again, prior to strong movements longer term divergence does not appear to currently be working well.
RSI is not yet extreme. If price continues lower, then it may end when RSI reaches oversold and then exhibits some short term divergence with price.
Bollinger Bands are beginning to widen for Friday’s session. A trend may be returning.
Friday was a 90% down day. Commonly these are followed by 2-7 days of rebound from price.
VOLATILITY – INVERTED VIX CHART
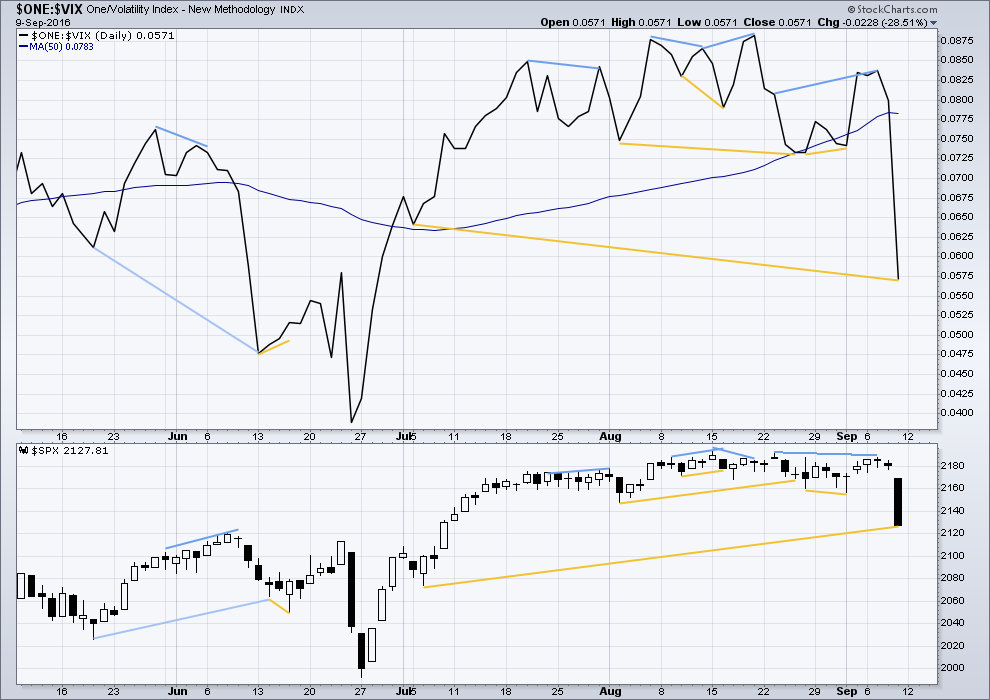
Click chart to enlarge. Chart courtesy of StockCharts.com.
Volatility is declining as price is rising. This is normal for an upwards trend.
There are a few instances of multi day divergence between price and inverted VIX noted here. Bearish divergence is blue. Bullish divergence is yellow. It appears so far that divergence between inverted VIX and price is again working to indicate short term movements spanning one or two days.
The short term bearish divergence noted between VIX and price has been followed by two days of downwards movement. This divergence did work, but unfortunately although it is useful to indicate direction it cannot be useful to tell us how far price may move.
There is now longer term divergence noted between price and VIX. From the lows of 6th July to Friday’s low, VIX has made a lower low but price has made a higher low. This divergence is bullish and indicates weakness in price. It remains to be seen if longer term divergence between price and VIX is currently working. This signal is given only a little weight.
Divergence between VIX and price favours the main Elliott wave count.
BREADTH – AD LINE
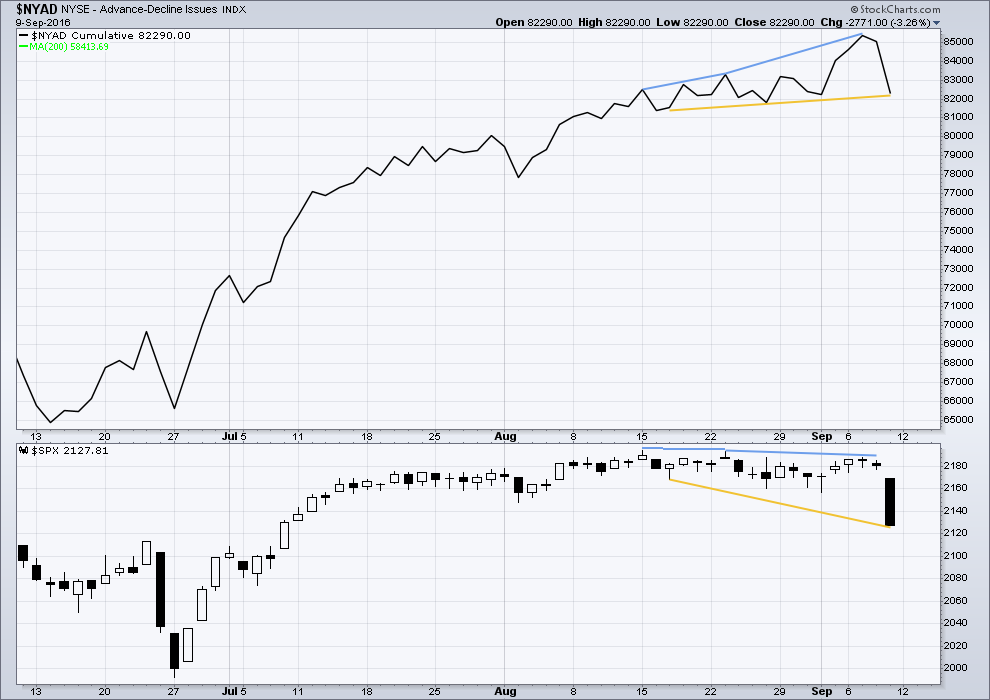
Click chart to enlarge. Chart courtesy of StockCharts.com.
There is support from market breadth as price is rising.
Short term bullish and bearish divergence is again working between price and the AD line to show the direction for the following one or two days.
Bearish divergence noted between price and the AD line from the highs of 23rd August to 7th September has resulted in two days of downwards movement from price, as was indicated. Sadly, although divergence can indicate a direction for price, it cannot indicate how far price may move.
There is now mid term bullish divergence between price and the AD line: from the low of 17th of August to 9th September price has made a lower low but the AD line has made a higher low. This indicates weakness in price.
Divergence between the AD line and price favours the main Elliott wave count.
DOW THEORY
Major lows within the prior bull market:
DJIA: 15,855.12 (15th October, 2014) – closed below on 25th August, 2015.
DJT: 7,700.49 (12th October, 2014) – closed below on 24th August, 2015.
S&P500: 1,821.61 (15th October, 2014) – has not closed below this point yet.
Nasdaq: 4,117.84 (15th October, 2014) – has not closed below this point yet.
Major highs within the new bear market:
DJIA: 17,977.85 (4th November, 2015) – closed above on 18th April, 2016.
DJT: 8,358.20 (20th November, 2015) – has not closed above this point yet.
S&P500: 2,116.48 (3rd November, 2015) – closed above this point on 8th June, 2016.
Nasdaq: 5,176.77 (2nd December, 2015) – closed above this point on 1st August, 2016.
Dow Theory Conclusion: Original Dow Theory still sees price in a bear market because the transportations have failed to confirm an end to that bear market. Modified Dow Theory (adding S&P and Nasdaq) has failed still to confirm an end to the old bull market, modified Dow Theory sees price still in a bull market.
This analysis is published @ 07:43 p.m. EST on 10th September, 2016.
A very strong upwards day, with a range of 42.2 points today’s range is slightly greater than Friday’s strong downwards day.
Let’s see what volume has to say. There is as yet no volume data from StockCharts.
While price remains below 2,187.87 both wave counts will remain valid and we will not have clarity.
From a classic TA POV today’s strong upwards day may negate the downwards breakout from Friday. Price has closed well within the prior consolidation. It looks like Friday’s downwards breakout was false. That would slightly favour the main EW count.
Today’s low is very close to that lilac trend line. It looks like that line has provided strong resistance, there’s only a very small overshoot of it.
Primary wave 4 for the main EW count is now slightly within primary 2 price territory and so Motive Wave is giving me a warning about that. Now, for members who use Motive Wave this is one of the frustrating aspects of it. MW seem to have decided that the rule that states “a fourth wave may not move into first wave price territory” also means that a fourth wave may not move into second wave price territory. I don’t know where they get that one from, that’s not the rule. And so whenever it tells me this is a problem I choose preferences > ignore issues.
Fourth waves can move into second wave territory. It’s first wave territory they may not move into.
I will take this as a very slight warning though that the main wave count may be wrong. But it needs to be actually invalidated by an actual EW rule, not a MW misinterpretation, before I’ll invalidate it.
I could be wrong folks but this is either one of the more boisterous of dead cat bounces, which I think it is, or the banksters are back in fine form. We should know before the open tomorrow. Have a great evening everyone!
Maybe this cat is alive Verne? 🙂 🙂 🙂
I do think he has indeed exceeded his customary nine lives! 🙂
I would not complain about a ramp higher…sitting on a ton of calls from old spreads!
ROFL
Yeah, nine lives.
That’s all you’re supposed to have Mr Cat! Enough already!
But seriously…. it does look like we’re going higher for a bit from here.
The implication of the market’s recent consistent failure to evidence capitulation spikes could be interesting. It is making me wonder if we could start to see volatility not so much spiking as embarking on a protracted run higher, simply posting higher highs and higher lows…
I am not convinced the compression we have been seeing in the BBs has been resolved with only Friday’s decline, precipitous as it was…
O.K. We are now kissing the underside of the 50 dma. Let’s see if we clamber back above it or it repels this move up…
The VIX faked below 15 and is now back above…good chance that we hold…cross our fingers…
When I entered long into a UVXY call, it was in the $21 area…we have dropped lower, but it does look like a good setup, if one is willing to take the risk…nearly the whole of summer, this didn’t work, but, we are in a historically weak month. If the VIX can hold up, then this has the potential to shoot to the $25-28 zone this week…
Only for risk-takers who like to lose money, though… 🙁
Trading the options are very tricky. Your timing has to be exactly right. I have switched my approach to accumulating actual shares as I think we are close enough to a market top to endure its annoying price decay. Selling covered calls against the long position has been working quite well as my cost basis is now under 15.00 per share with the most recent calls sold. Even with the market’s move higher today those calls are still not available for a lower price than I sold them on Friday so it could mean we are going higher in volatility….ask for those November UVXY 20 strike calls down to 5.10. I think I will buy back half if they go to four bucks even…
My problem is timing the market–never been good at it, especially this summer. So, I’m more of a swing trader, which really hasn’t worked…
I believe you’re right that volatility will explode higher, but the timeframe is difficult…this week? Next week? I do have shares as well, but I’m certainly not as efficient as you are.
I want to believe that we will have a good run in UVXY to 25-28 level this week if the VIX holds 15. Then a likely pullback followed by an even greater run…only wishful thinking right now, though.
If you are sitting on the actual shares and can be patient, I think you will be amply rewarded. There is an outside chance of one more reverse split on the final possible fifth wave up but I think it unlikely. In fact I expect volatility to make a higher low on this final move up as the sharks begin to smell blood in the water….
Huyk! Hyuk! Futures up over 284.00??!!!
Boy those banksters have turned into some eager beavers!! We’ll see what tomorrow brings!! 🙂
Thanks, Verne. Always appreciate the comments and feedback.
Volume on this pop also quite tepid. Of course that has never stopped price from grinding higher but in this case I think it does cast some doubt on whether an interim bottom is in….
If Friday’s gap filled today it may be that we are already in the fifth and final wave up. I don’t think we are, but you never know….
I think I am being overly cautious with that put spread. I think this move up is going to get hammered into the close … 🙂
Actually I don’t mind this pop up. I wish it would go a bit higher so I could buy back those UVXY calls. They are still trading for a buck more than I sold ’em for on Friday…
Defending short position by selling an equal number of SPY 212.50 puts expiring next week for 1.10. We could go as high as 2165 I think…
VIX is at a support level…if it holds, then there’s a very good chance that we’ll drop…but, the VIX has not been our friend lately…
A VIX below 15 is bad news for the bears. 🙁
Yep. We are seeing a ferocious battle on the part of the banksters in their attempt to control market price. It is really surreal watching them at work. It is particularly amazing considering how the European markets and others fared today. If we get no capitulation by way of a VIX spike after that plunge on Friday, it just simply means when it does arrive it will be more spectacular. I will be quite happy to continue to amass volatility while the banksters are at play…
I am prepared to buy back those SPY puts by the close as I think this move up is bogus….
Opened order to buy back UVXY 20 strike calls sold for 4.56 on Friday for limit of 3.00 but don’t think I am going to get filled even with UVXY’s big move down today…
I agree that it’s bogus…but, as you yourself have noted and most of us have witnessed, these market makers somehow always seem to gap the market up over resistance–strong resistance…I hope justice (a continuation of a drop) happens, but I just don’t expect it to play out…hope it does, though.
Unbelievable how this market just holds up…is Japan and the ECB buying the indexes today? Or maybe our Fed illegally? Who knows? Maybe the banks are buying with their fake accounts through Wells Fargo…SEC actions are not big enough to prevent this fraud…we are in the Twilight Zone… 🙁
Oh, no, did the market drop 1%?!? Quick, blame it on Trump!!! Lol…no responsibility these days…
I am personally convinced the central banks are illegally trading in the equities markets and I believe they are doing it with massive leverage. This is one of the reasons I want to always maintain a short position in this market. As we saw last Friday, the plunges can occur without much warning and you have to be already positioned to benefit. I think when this thing finally begins to unravel, the unprecedented levels of leverage is going to make it unlike any bear market we have ever seen. No wonder they are fighting tooth and nail to keep the thing afloat. It’s definitely lights-out if it ever gets away from the banksters! 🙂
So tiring…we can never have a multi-day pullback. Volatility losing support and another short squeeze just so the Fed can help the rich get richer…heavier volume now, so maybe summer trading is close to an end. 🙁
It could go either way at this point…but it seems that the BTDers keep thinking that SPX at near ATHs are still really cheap. If our GDP was awesome (which it’s not) I may be inclined to agree, but I happen to disagree…what do I know?
Third down on deck?!
Another good write-up from my main man Peter Temple. I really like this dude, as you can tell. Hope you don’t mind the occasional links…. 🙂
http://worldcyclesinstitute.com/wound-up-tight/
I think we area going lower folks. The bankster feint is failing, and other traders are calling their bluff it would appear. If you trade this move down I would recommend taking the money to the bank prior to the close as we could put in a temporary low with futures jacked up overnight; that’s the way they roll….
Looks like SPX came up to tag 2150.00…
Adding to SPY 213 puts to lower cost basis to 1.80 per contract…
Fed Governor induced spike… That is NOW OVER!
What did he say exactly? I have to say in addition to their behind the scenes cash dumps, I was in fact expecting some jawboning to get the lemmings to keep heading off the cliff…. 🙂
This divergence from other global markets I do not believe is going to hold. The banksters are clearly trying to keep traders off balance. I have opened a STC limit order of 1.50 on my small contingent of SPY puts in the event of a dive into the close.
Oops! I meant STC at limit of 2.50…. 🙂
Filled at 1.90 on September 21 213 puts; stop at 0.95…
UVXY hanging tough and saying this pop is a bunch of horse feathers…
I generally not in the habit of calling the bluff of the banksters.
That phenomenal BB compression in my opinion has not unleashed anywhere near the implied potential energy it has accumulated. I am going to dip a pre-emptive toe in the water with a small contingent of SPY 213 puts expiring next week for 2.00 per contract. I am giving myself a generous stop loss of 50%. A decline to the target of a second wave correction of around 1950 will see these puts trading close to a juicy 20.00 per contract with premium, a potential ten-bagger. If they trade for 3.00 or more anytime in the next 24 hrs I will consider that a green light for filling the wagon, as Rodney would say…. 🙂
The November UVXY 20 strike calls I sold for 4.00 bucks Friday are now trading at 6.00 and are down only 3% today. The market makers think this decline is not done…not by a long shot. VIX is showing no sign whatsover of anything remotely resembling capitulation; optimism remains sky high, and indeed the talking heads, many of whom I think are good analysts, are talking enthusiastically about this decline being a great buying opportunity! They could be right, but I cannot help, at the risk of sounding like a broken record, noting that the interest rate environment in now dramatically different from that which prevailed during the last market declines…I personally think this is a game changer, the ebullience of the BTFD crowd notwithstanding…
Lol. CNBC pushing the BTD crowd…usually a sign the decline isn’t over yet…I can’t stand listening to those morons, so I’m glad someone does key into it…let us know when these people start panicking, Verne, might be time for a long entry then…
Roger that Russell.
It may be that a 400 DJI point plunge is not sufficient to stoke the fear, or even get the attention of the BTFD crowd. Maybe 1000.00?! 🙂
I’m looking for the market to get a tad bit higher, maybe SPX at 2140 area…the QQQs are leading for now, but UVXY seems to have gotten to its pivot near 20.90 for today…if it holds here, I would expect a pullback to ensue, hence, I would be bearish down to about 2100 area short-term. IWM is weak which is an early warning sign to the bulls.
So, from what I see, if we have a very slow upwards move, it’s vulnerable and will probably fall apart later today…a stop is definitely necessary in this schizoid market…
I am wondering if the paradigm of the last kiss good-bye of the 200 dma that generally happens to kick off the serious leg of a bear market, could see something of a prelude with the 50 dma during this initial leg down…this could take us as high as the area of 2164.50…
I have a UVXY high of 23.40 today….looking to buy back some calls against my long position if it goes lower…
That is very possible…no one should follow me as I am only good at losing money lately…anyway, the SPY is just below its pivot and UVXY is above its pivot…bearish-leaning, so I now have a small portion of UVXY calls…looking for SPY to 211.50 this week…at least that would be a test of the pre-market low…QQQs are trying to be bullish, so it’s still hard to say, but I think bears have a small advantage for now.
Don’t feel badly; I know a lot of very seasoned traders who have been mightily frustrated by this market. I feel reduced to day trading this beast. As badly as I wanted to remain short the market, you saw how I bailed like a wus last Friday and took profits a bit early. If any one went short at the end of the day Friday as a result of that huge plunge, they are underwater this morning. I was sure that futures were giving the all-clear but you saw what unfolded this morning. At some point the whack-a-mole games are going to come to an end; the trick is preserving capital to short this animal with authority when that finally happens; I think the SPX 2110 pivot ultimately will tell the tale…
Thanks, Verne. Seems that the only way to make money anymore is to day trade for a couple SPX points per day–as you say, most are losing in this market. Just can’t believe all of the corruption going on with the banks as well…one would think this market would just give it up, but since it’s okay for Hillary Clinton to lie and get away with anything and everything illegal it seems (not that Trump would be any better, he just never raped or murdered anyone), why wouldn’t this market just fraud its way to 4000 SPX? If only the Warren Buffetts would see jail time for illegal activities instead of being worshipped by the masses…
Can’t wait for the volume to come back to the party…light volume today, maybe we’ll get a drop the end of today or overnight? Then a BTD period of time for a few days…then more red? One can only hope for a real market.
Move back below 2129.60 would look a lot like a 3,3,5, correction off this morning’s low… a time to be patient and wait for confirmation though…
Opened contingent order on a truckload of SPY September 14 214 strike puts to be triggered by move of SPX below today’s low at 2119.12…still holding SPX calls from closed bearish call spreads last week…just in case…. 🙂
Waiting for break of 2110 to go massively short….so far looks like three up off this morning’s lows….
You and me both Mr Carty 😉
Good to have you back…I missed ya sweetie!
Thanks Verne – been lurking but SOH since the bear invalidated so not really had anything constructive to say. No appetite for chasing this farce to 2500 so patiently waiting for us to either reach that target or a viable EW alternate to show up.
We may or may not have that viable alternate – if not I’ll continue to SOH 🙂
As you know – been invested in PMs for quite some time though so not all bad. Great to see you posting on the Gold Site.
Hi Olga. I think we’ve all missed you 🙂
Good to know you’re lurking about here
Thanks Lara 🙂
Friday’s selloff was mostly during normal trading hours (~90% of)… as they all will be from here on out!
These normal trading hours selloff’s are harder to manipulate than the overnight hours are.
They spent a ton of dough overnight trying to manipulate the futures market and we still got a gap down this morning. Let’s see how long their trashing around keeps the bears at bay…we know they can buy back a thousand DJI points in a day or two so one cannot take anything for granted. I am looking for an intra-day gap down to signal their complete loss of control….. 🙂
Almost went flat… Now a continuation of selloff from Friday can begin.
A “snowball effect” will occur daily over the next several weeks.
The American banksters seem to be buying the propaganda of the US economy being the cleanest shirt in a dirty laundry basket – they have spent a fortune trying the to buy futures markets out of deep in the red. They apparently think they can de-couple from the global sell-off underway. It looks like the strategy is to defend DJI 18,000.00 and SPX 2110.00. Have the been paying attention to what is going on in the global bond market?
I’ve got news for them – the jig’s up, or at least very nearly so imo. I for one will be aggressively shorting any bankster induced bounce today….have a great trading day all!
{ Beware of the Sales Pitch to Ban Cash! } To Continue the Series…
Negative Rates & The War On Cash, Part 4: “Financial Totalitarianism”
{ “Governments and central banks would very much like to frighten people away from cash, but that only underlines its value under the current circumstances. Cash is king in a deflation. The powers-that-be know that, and would like the available cash to end up concentrated in their own hands rather than spread out to act as seed capital for a bottom-up recovery. Holding on to cash under one’s own control is still going to be a very important option for maintaining freedom of action in an uncertain future.” }
http://www.zerohedge.com/news/2016-09-11/negative-rates-war-cash-part-4-financial-totalitarianism
The ppt can move the market both ways. For example if they want it to go down because trump is gaining in the polls all they have to do is stop buying. There is also the possibility they could buy short positions. There agenda is market stability so that could work both ways.
The problem with your theory is that the current administration will bear the blame for any market dislocation, and since Hillary has tied her star firmly to Obama, the PPT would not be doing her any favors by “letting” the market decline. It may be entirely out of their hands. It looks to me like the trading bots have simply been turned off. We had absolutely no pause at the 50 DMA, a very ominous sign. I would not be at all surprised to see a plunge straight to the 200 DMA before we see an initial bounce.
Another critical development is that the subterfuge of massive stock buybacks to inflate share prices has declined greatly due to the steep drop in earnings. The spike up we are now seeing in rates will have put that dishonest practice finally to rest. There will be no more issuing of bonds to buy back shares, while insiders cash out and leave shareholders holding the bag. Already a lot of these shares are trading well below the re-purchase prices so those corporate bonds issued to make the buys are already in deep trouble. The companies engaging in this kind of misconduct are some of the easiest money shorts you will ever make, among them IBM and 3M and Papa Johns. I own leap puts on all these corpses…it is like money lying in a corner waiting for someone to come by and pick it up…. 🙂
It has been a very long time since this market set up in a way that made it possible to execute a directional trade with high confidence. I think it will finally do so next week.
One of the reasons I was so reluctant to go “all in” on the bullish count was the market’s failure to return and test the break-out area, which it generally done when it is about to begin a sustained bull run. I think Lara is right that that is exactly what it seems to be doing no and in that sense this move down is not all that unusual. What is quite unusual though is that it is happening after such a long period of sideways consolidation. The prior break-out area of around 2110 is also just about the neck-line of the IHS so many have cited giving further credence to an idea of a return to test.
Personally, based on the BB situation I entered my biggest trade of the year last week, on volatility while remaining somewhat hedged with bearish call spreads which I could quickly exit if I was wrong. Those positions all exploded (in a good way!) as you can imaging on Friday. We will definitely know what is going to happen next week, but I am personally quite bearish. Why? The bond market.
If the breakout area of around 2110 gives way, I think it means we are going much lower. If it reverses up from there I think it means all aboard! 🙂
Hee hee. First?
It would indeed be great should the bear emerges. I’m sure a lot of us have been waiting for it to happen. The relentless but artificially stimulated rise had been too far too long. More downwards movement, especially if the tempo picks up, would be a very welcome relief.
It would indeed. The tricky part then comes in trying to time a good entry point.
Right now my only worry is that it is going to be difficult to determine if further sharp downward movement is a developing primary two, or primary one down of a new bear market. I think the brevity of the bounces will be a good clue. If we get additional relentless movement to the downside with only brief pauses next week, my money is on the grizzly…