
More sideways movement for Thursday’s session fits the main hourly Elliott wave count.
Summary: One more day of overall downwards movement to 2,168 but not below 2,157.09 is now expected to complete this consolidation, which began back on 14th of July. Thereafter, an upwards breakout is expected. The final wave up is likely to be only about 114 points in length.
Last monthly chart for the main wave count is here.
New updates to this analysis are in bold.
MAIN WAVE COUNT
WEEKLY CHART
Click chart to enlarge.
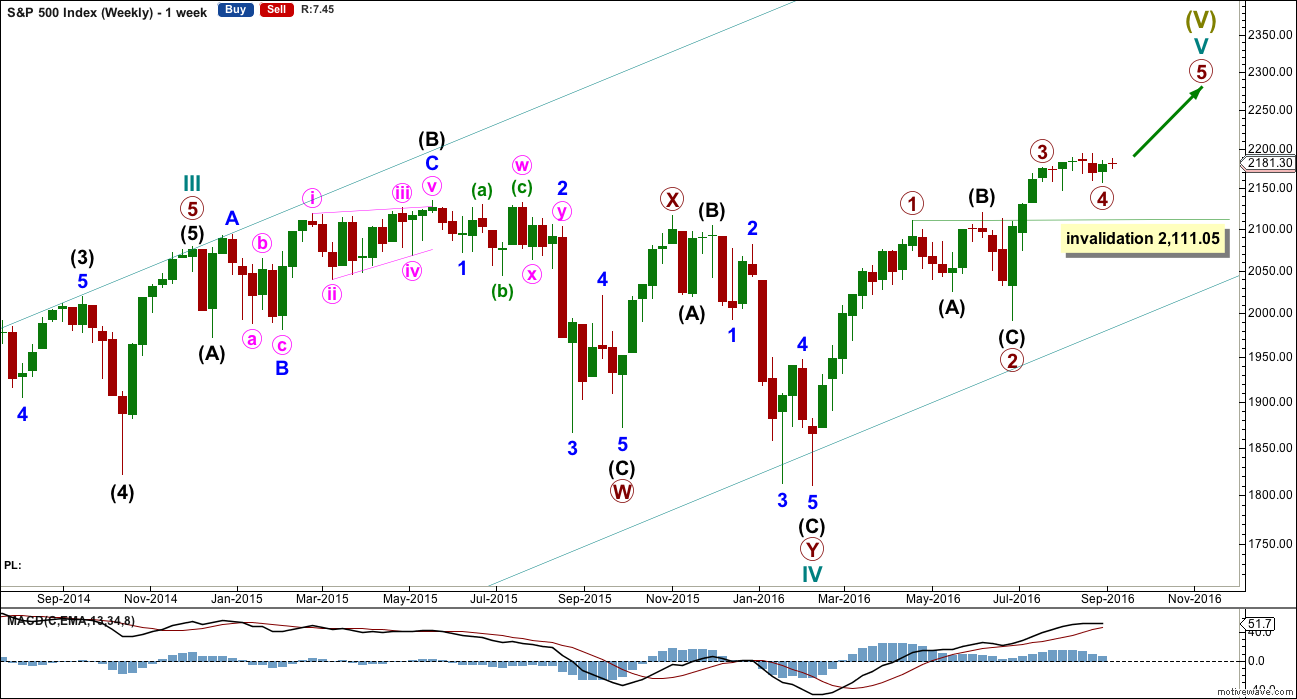
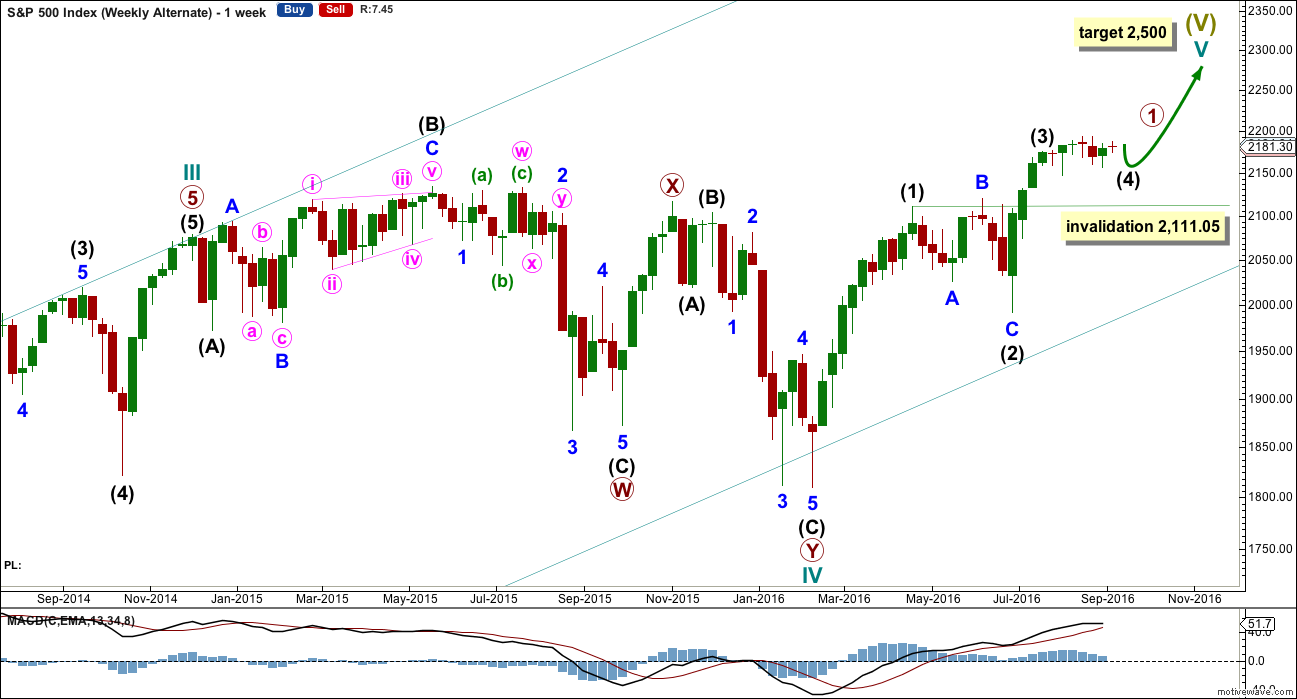
Cycle wave V must subdivide as a five wave structure. So far upwards movement is unfolding as an impulse with the fourth wave completing. This may be primary waves 1, 2, 3 and now 4, with primary wave 5 upwards still to come.
Primary wave 3 is shorter than primary wave 1, but shows stronger momentum and volume as a third wave normally does. Because primary wave 3 is shorter than primary wave 1 this will limit primary wave 5 to no longer than equality in length with primary wave 3, so that the core Elliott wave rule stating a third wave may not be the shortest is met. Primary wave 5 will be limited to no longer than 183.95 points in length.
Primary wave 2 was a shallow 0.40 expanded flat correction. Primary wave 4 may be exhibiting alternation as a more shallow triangle.
Primary wave 4 may not move into primary wave 1 price territory below 2,111.05.
DAILY CHART
Click chart to enlarge.
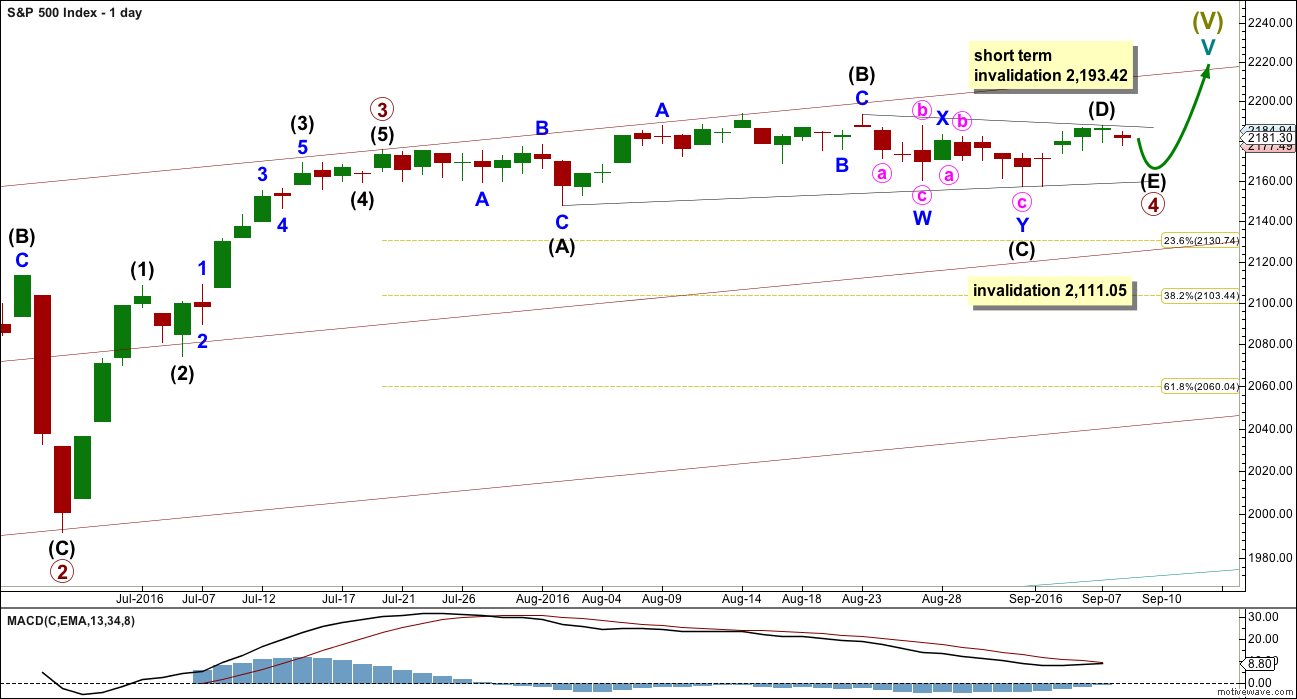
Primary wave 2 lasted 47 days (not a Fibonacci number). Primary wave 3 lasted 16 days (not a Fibonacci number).
If primary wave 4 was over on 2nd of September, as per the alternate hourly count below, then it would have lasted a Fibonacci 34 days. If it continues for another one or few days, as per the main hourly wave count below, then it may not exhibit a Fibonacci duration.
The maroon channel is redrawn. Draw it first from the end of primary wave 1 (this can be seen on the weekly chart) to the end of primary wave 3, then place a parallel copy on the end of primary wave 2. If primary wave 5 comes up to touch the upper edge of this channel, then look out for a possible end to this structure there.
HOURLY CHART
Click chart to enlarge.
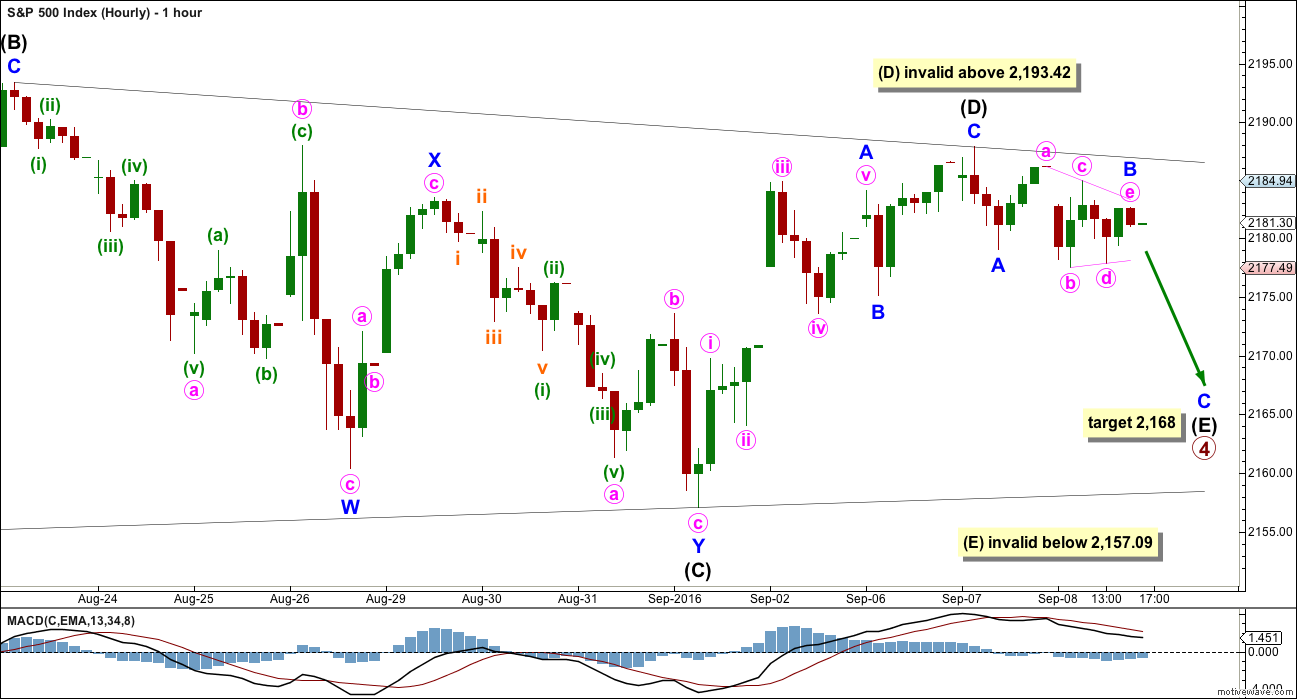
Intermediate wave (C) fits well as a double zigzag. One of the five sub-waves of a triangle should be a double.
Intermediate wave (D) no longer has a good fit as a completed zigzag. Minute wave v of minor wave A is slightly truncated, and minor wave C does not look like a five. If it continues any higher, then it may not move substantially above the end of intermediate wave (B) at 2,193.42.
If primary wave 4 is a contracting triangle, then intermediate wave (D) may not move beyond the end of intermediate wave (B).
If primary wave 4 is a barrier triangle, then intermediate wave (D) should end about the same level as intermediate wave (B), so that the (B)-(D) trend line is essentially flat. Unfortunately, this means that intermediate wave (D) may end slightly above the end of intermediate wave (B). This rule is not black and white.
Intermediate wave (E) is most likely to end short of the (A)-(C) trend line. The next likely point for it to end is with an overshoot of the (A)-(C) trend line. Intermediate wave (E) may not move beyond the end of intermediate wave (C) below 2,157.09. This invalidation point for the triangle is black and white.
Sideways movement for Thursday’s session fits as a small triangle. This may be a running contracting triangle for minor wave B within the zigzag of intermediate wave (E). At 2,168 minor wave C would reach 1.618 the length of minor wave A. This target would see intermediate wave (E) have a normal look and fall short of the (A)-(C) trend line.
ALTERNATE HOURLY CHART
Click chart to enlarge.
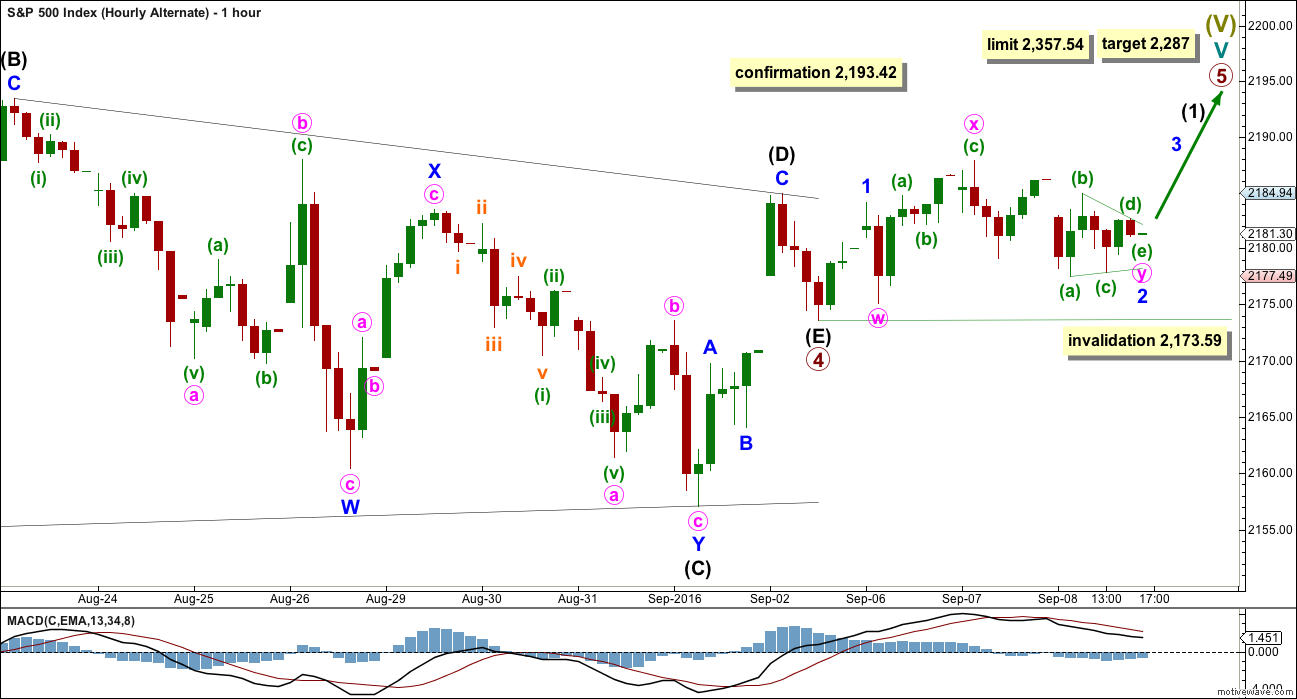
If price continues higher and moves reasonably above 2,193.42, then this alternate hourly wave count would be confirmed.
It is possible to see the triangle for primary wave 4 as complete. Intermediate wave (E) may have fallen well short of the A-C trend line and been very brief. This is possible. All reasonable possibilities should be considered.
The structure for intermediate wave (D) now fits as a three.
If primary wave 4 is over here, then the limit for primary wave 5 is at 2,357.84 where it would reach equality in length with primary wave 3. Primary wave 5 may not be longer than equality in length with primary wave 3, so that primary wave 3 is not the shortest actionary wave.
Within primary wave 5, no second wave correction may move beyond the start of its first wave below 2,173.59.
At 2,287 primary wave 5 would reach 0.618 the length of primary wave 3.
At this stage, the degree of labelling within primary wave 5 sees intermediate wave (1) incomplete. Because primary wave 5 may be relatively short this degree of labelling may need to be changed in coming days; it may need to be all moved up one degree.
A first wave and second wave may be complete within primary wave 5. Minor wave 2 fits as a double combination: zigzag – X – triangle.
ALTERNATE WAVE COUNT
WEEKLY CHART
Click chart to enlarge.
This alternate is identical to the main wave count with the exception of the degree of labelling within cycle wave V.
Here the degree of labelling is moved down one degree. It is possible that only primary wave 1 is completing as a five wave impulse. When it is complete, then primary wave 2 would be expected to be a deep pullback which may not move beyond the start of primary wave 1. At that stage, the invalidation point would move down to the start of cycle wave V at 1,810.10. At that stage, a new low below this point would confirm a bear market for both Elliott wave and Dow Theory.
At 2,500 cycle wave V would reach equality in length with cycle wave I. This is the most common ratio for a fifth wave, so this target has a good probability.
At this stage, this alternate wave count differs only in the degree of labelling to the main wave count, so subdivisions for daily and hourly charts would be labelled the same.
TECHNICAL ANALYSIS
WEEKLY CHART
Click chart to enlarge. Chart courtesy of StockCharts.com.
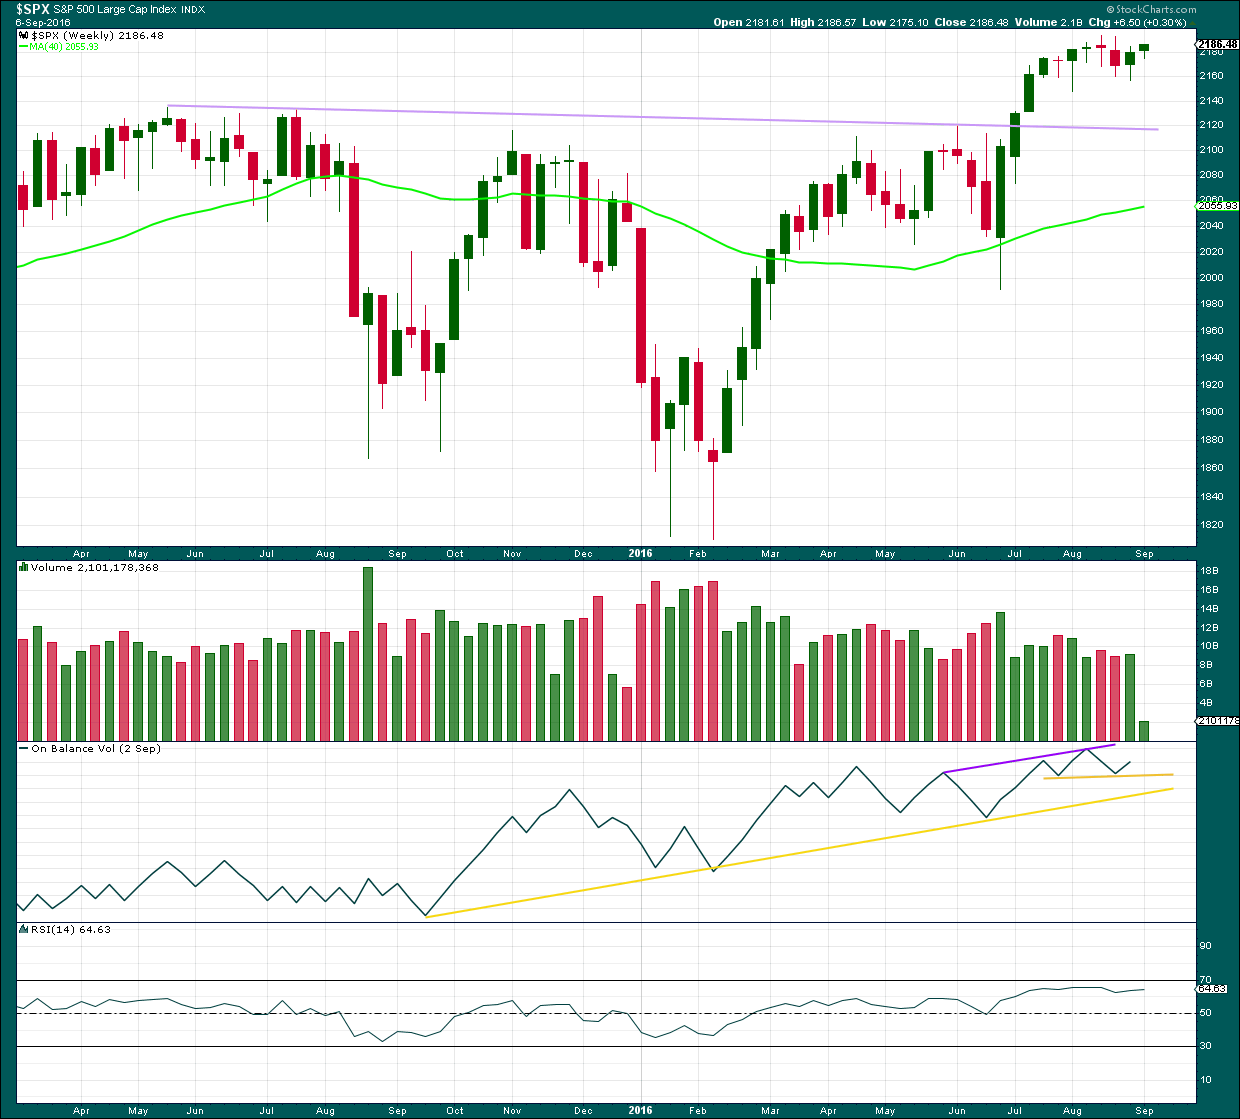
Last week completed a green weekly candlestick with a long lower wick. The colour and lower wick are bullish. The slight increase in volume supports the rise in price and is also bullish.
On Balance Volume gave a bullish signal last week as it moved up and away from the upper yellow support line.
RSI is not extreme and exhibits no divergence with price. There is still room for price to rise.
DAILY CHART
Click chart to enlarge. Chart courtesy of StockCharts.com.
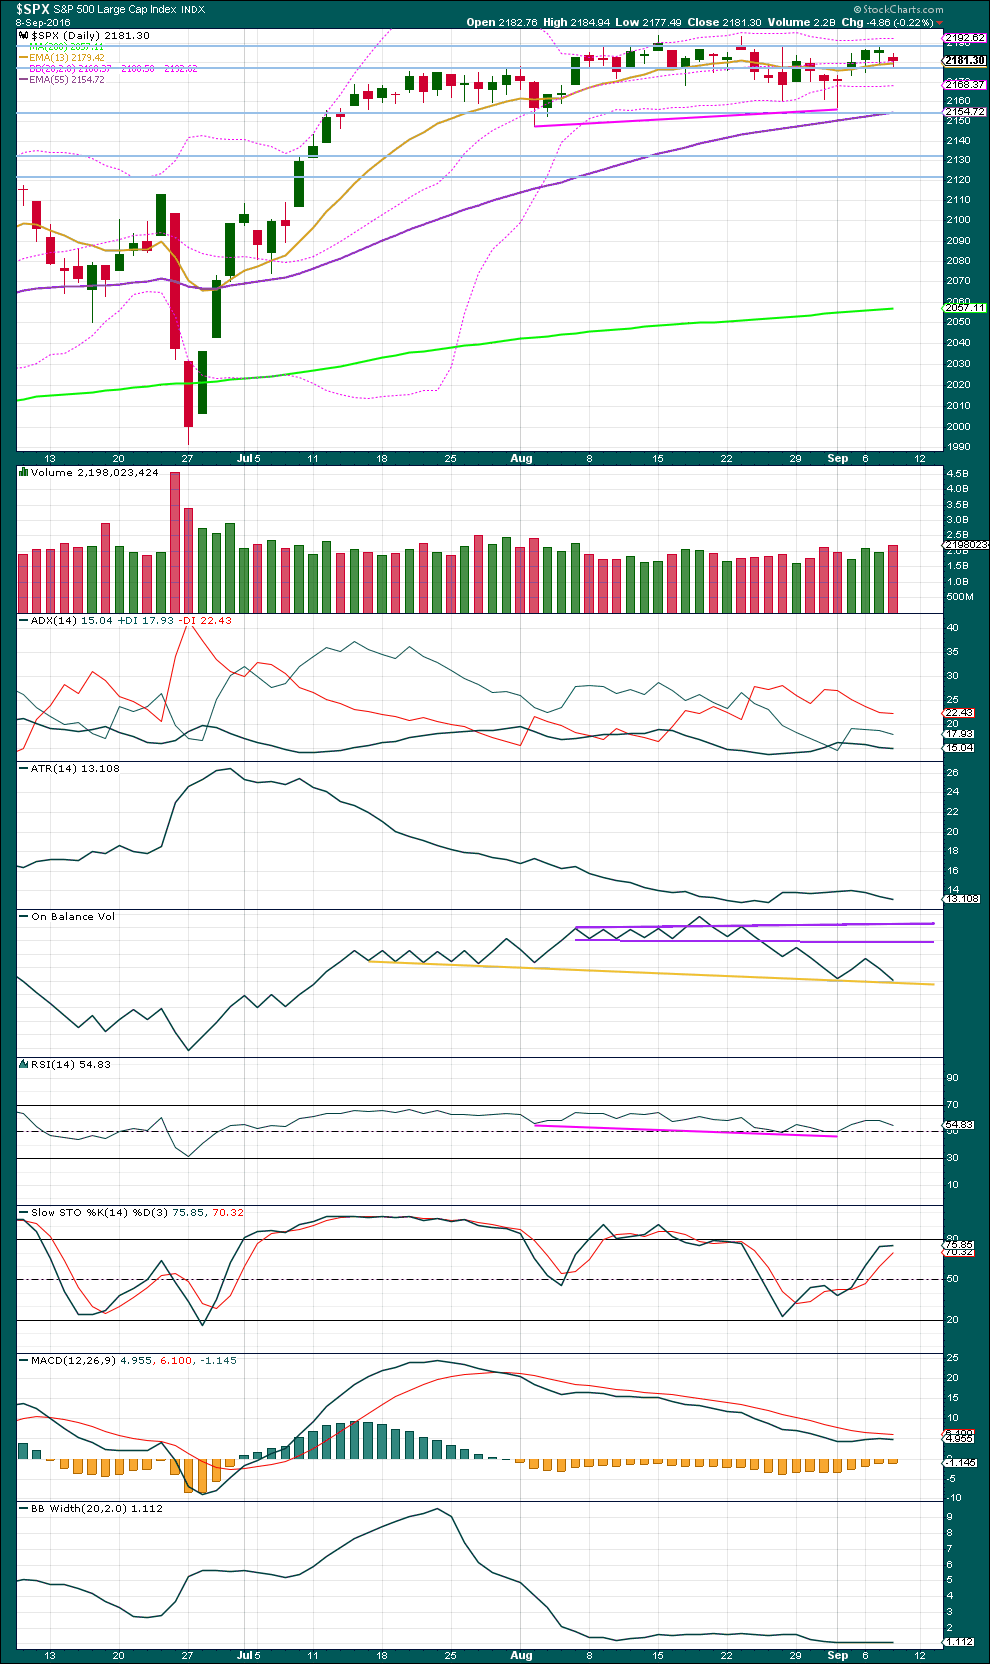
Price remains range bound with resistance about 2,190 and support about 2,155. Price entered this range about 14th of July. During this period, it is the downwards day of 14th of July which has strongest volume suggesting a downwards breakout is more likely than upwards. However, this trick has recently proven to not work for this market. It is given little weight in this analysis.
A small red candlestick with a very small real body for Thursday’s session comes on increased volume. This indicates that there is some support for the fall in price. It should be expected that price will move lower for at least one more day.
On Balance Volume is still finding support at the yellow trend line. This may halt the fall in price. There is bullish divergence between the low of price on 2nd of August and today: OBV has made a lower low but price has made a higher low. This indicates weakness to downwards movement from price. This divergence does not mean that price must move upwards tomorrow; it only supports an overall bullish wave count for the mid term.
ADX is declining, indicating the market is not trending. ATR is also flat to declining, in agreement with ADX. We would need to see price break above resistance at 2,190 or below support at 2,155 on a day with increased volume to have indication that the trend has returned.
RSI is not extreme. There is room for price to rise further.
Stochastics is not yet overbought. There is a little room for price to rise further before the upwards swing may be over.
MACD should be watched carefully in the next few days. If the shorter black average crosses above the longer red average, then it would indicate a possible upwards trend returning.
Bollinger Bands are still very tightly contracted. There is very little volatility in this market. It will return, probably when price breaks out of this range.
VOLATILITY – INVERTED VIX CHART
Click chart to enlarge. Chart courtesy of StockCharts.com.
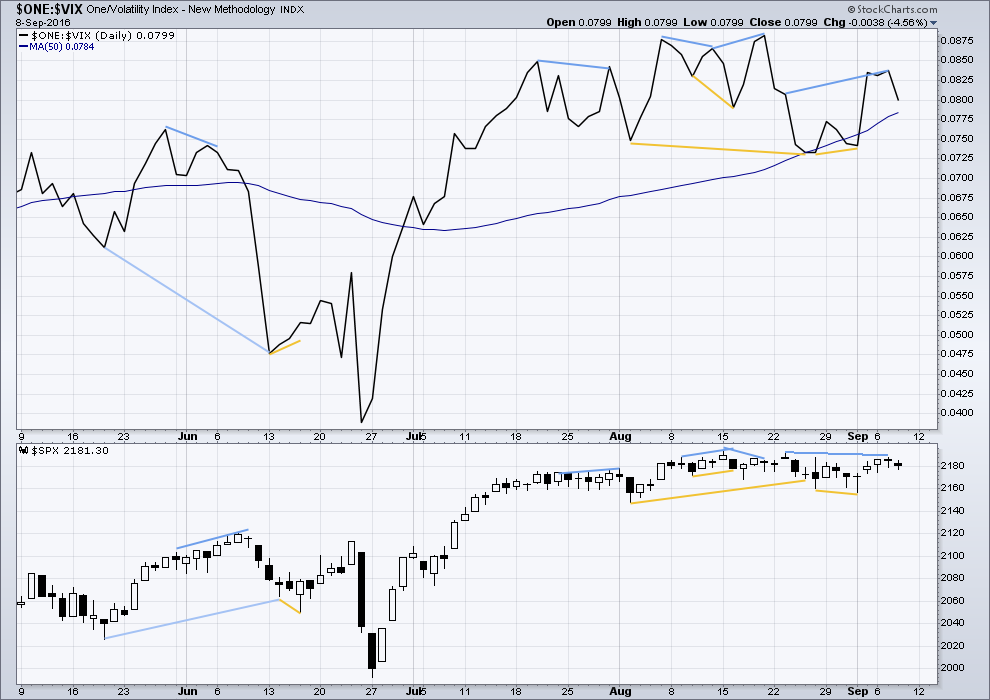
Volatility is declining as price is rising. This is normal for an upwards trend.
There are a few instances of multi day divergence between price and inverted VIX noted here. Bearish divergence is blue. Bullish divergence is yellow. It appears so far that divergence between inverted VIX and price is again working to indicate short term movements spanning one or two days.
Yesterday some bearish divergence between price and VIX was noted from the high of 23rd of August: VIX has made a higher high but price has made a lower high. This indicates some weakness in price. This is now followed by one day of downwards movement from price, and it may be followed by one more day of downwards movement before it is resolved. This supports the main hourly Elliott wave count.
Again, it is noted that divergence between price and VIX is again sometimes working as a short term indicator.
BREADTH – AD LINE
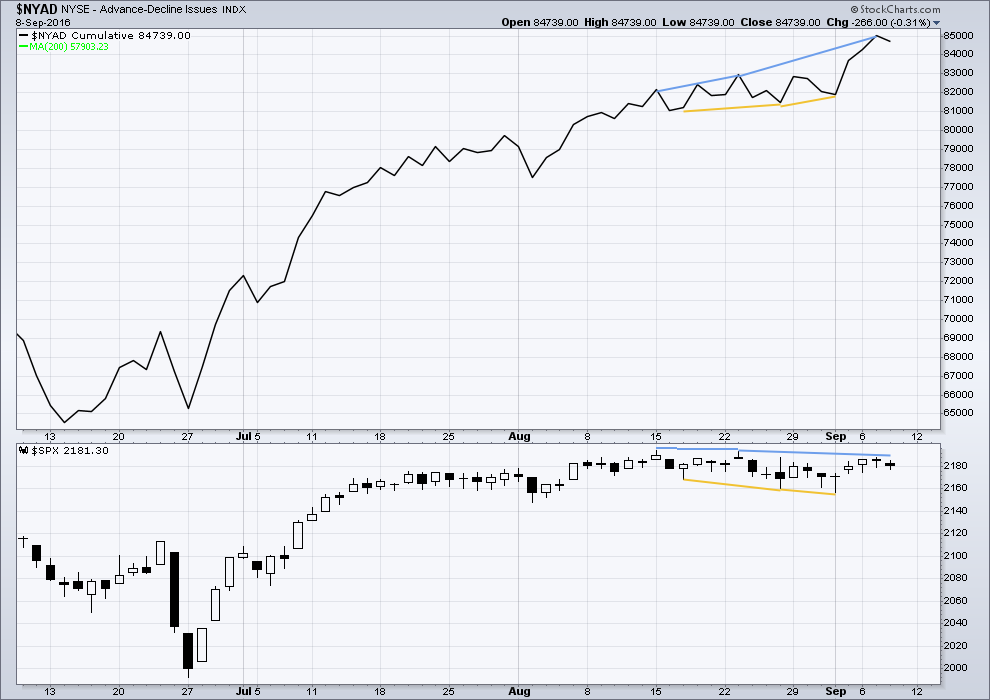
Click chart to enlarge. Chart courtesy of StockCharts.com.
There is support from market breadth as price is rising.
Short term bullish and bearish divergence is again working between price and the AD line to show the direction for the following one or two days.
There is now strong mid term bearish divergence between the AD line and price: the AD line made a new high yesterday but price has failed to make a corresponding new high. This indicates weakness in price. So far this divergence has worked to indicate a short term price movement and has been followed so far by one day of overall downwards movement. Price may move lower for one more day before this divergence is resolved.
DOW THEORY
Major lows within the prior bull market:
DJIA: 15,855.12 (15th October, 2014) – closed below on 25th August, 2015.
DJT: 7,700.49 (12th October, 2014) – closed below on 24th August, 2015.
S&P500: 1,821.61 (15th October, 2014) – has not closed below this point yet.
Nasdaq: 4,117.84 (15th October, 2014) – has not closed below this point yet.
Major highs within the new bear market:
DJIA: 17,977.85 (4th November, 2015) – closed above on 18th April, 2016.
DJT: 8,358.20 (20th November, 2015) – has not closed above this point yet.
S&P500: 2,116.48 (3rd November, 2015) – closed above this point on 8th June, 2016.
Nasdaq: 5,176.77 (2nd December, 2015) – closed above this point on 1st August, 2016.
Dow Theory Conclusion: Original Dow Theory still sees price in a bear market because the transportations have failed to confirm an end to that bear market. Modified Dow Theory (adding S&P and Nasdaq) has failed still to confirm an end to the old bull market, modified Dow Theory sees price still in a bull market.
This analysis is published @ 07:43 p.m. EST.
Chris Ciovacco: essentially after Friday’s volatile downwards day, the overall picture is still bullish.
Some solid and calm technical analysis for you all before my analysis is finalised today.
https://www.youtube.com/watch?v=y4iqPs48nxg
{ Beware of the Sales Pitch to Ban Cash! } To Continue the Series…
{ Negative Interest Rates & The War On Cash, Part 3: “Beware The Promoters”
The main promoters of cash elimination in favour of electronic currency are Willem Buiter, Kenneth Rogoff, and Miles Kimball… in order to implement substantially negative interest rates…”If all central bank liabilities were electronic, paying a negative interest on reserves (basically charging a fee) would be trivial. But as long as central banks stand ready to convert electronic deposits to zero-interest paper currency in unlimited amounts, it suddenly becomes very hard to push interest rates below levels of, say, -0.25 to -0.50 percent, certainly not on a sustained basis. Hoarding cash may be inconvenient and risky, but if rates become too negative, it becomes worth it.” }
http://www.zerohedge.com/news/2016-09-10/negative-interest-rates-war-cash-part-3-beware-promoters
Folk are not only preemtively starting to withdraw money from banks. They are moving it out of equities. We should see OBV continue to head South as volume on down days continue to outpace up days volume. The banksters are approaching their limit…or may be there already!
I have a theory about all the gap ups we have been seeing in the market. I do not for one minute buy the notion that these are being caused by retail investors – they don’t have that kind of buying power. I also seriously doubt it is being caused by institutions, although that is a more feasible notion. I think these gaps are being engineered by the banksters, and I suspect they are doing it with massive leverage. Quite a few gaps got filled yesterday. Are these banksters starting to unwind? How long is it going to take for the average Joe who has been in perpetual BTFD mode to get a clue about the con game that has been going on?
People long the market lost 40 days of “gains” in a few hours. Maybe the lights are going to start going on in a few complacent heads…
Does any one have any ideas of why Draghi demurred on the matter of additional asset purchases by the ECB? He is after all the “whatever it takes” dude, and has often reminded us of how “ready and willing” he is to act. He does have reasons I assure you! 🙂
A few times when the price action in the market was frustrating so many of us, I remember on occasion saying how I felt like sitting on my hands until the overnight futures suggested otherwise. Remember my comments about when the chickens came home to roost we were going to see DJI futures down by a thousand points?
I am sure it sounded far-fetched at the time, but here we are, not even officially in a bear market and futures are down by over 400 points! I know that could change by Sunday night and that could improve…it could also get worse…. 🙂
Tim made an interesting comment about the banksters “allowing” this decline to happen and speculated that they were looking for some reason to justify further delay in a rate hike. This of course raises the age-old question about how much control the powers that be have over price action in the markets. Anybody observing the market the past few day could not deny that the dips were consistently being bought and we kept seeing those monstrous candles as the battle unfolded on the one and five minute charts. There is no question that they were trying. Someone even remarked about the “invisible hand” that always seemed to ramp the market higher into the close. Their ability to manipulate prices in the short term, and possibly even the intermediate term simply cannot be denied, unless we choose to deny what is abundantly evident. I would however like to take issue with Tim’s speculation that the banksters are “allowing” this decline, and particularly doing so as a subterfuge for rate hike avoidance. The gorilla in the room is the bond market. Anybody noticing what is starting to happen with global bond yields? JGBD, the 3X inverse Japanese bond fund, took back 2 1/2 years of losses in just under a month. The banksters can manipulate and bamboozle equities markets as long as they have the cooperation of the big gorilla in the room – the bond market. Based on the price action in both JGBD, which is the canary in the coal mine so far as global bond markets are concerned, and TLT, the gorilla may be saying to all, including the banksters: “Everybody, out of the pool!”
I do still think we have on final wave up to come, but a warning shot has been fired across the bow of the global equities steam boat…
https://m.youtube.com/watch?v=gzThkIBqNVE
Critical info from Tim Knight on some trend lines to watch carefully next week, particularly the neckline of the inverted HS SPX pattern, right now being tested. A strong move below and coupled with a break of another trend-line he shows confirms a failed break-out and clarion call to look out below.
https://www.tastytrade.com/tt/shows/trading-the-close-with-tim-knight?locale=en-US
SPX monthly for the last 20 years…negative divergence is readily apparent…blue indicator directly under price is an important tell…just a matter of time before price catches up to the indicators…
https://youtu.be/krD4hdGvGHM — my market observation, sorry if its a bit too technical.
ROFL
Yeah, very technical there Doc. Way over my head 🙂
One more thing…look at that VIX candle!!
Anybody remember the SNL skit with Madonna hosting with the quip”
“Look at the unit on that guy!”? 🙂
https://vimeo.com/4760357
I must say, the acceleration to the downside into the close was a bit surprising and reflects a change in pattern from recent days where down moves have been almost universally met with rallies into the close. It will be interesting to see where volume comes in (volume on SPY is the highest it has been since the large two day drop in June).
We are getting awfully close to another significant invalidation point at 2111.05, so I am starting to wonder if this, in fact, the start of a larger correction.
Highest SPX Volume since 7-29 and before that 6-30 and before that 6-24 to 27
Today was a stunning example of how even seasoned analysts can be completely wrong about market direction. I had to smile after reading an e-mail in my inbox from Sam Collins, a very able analyst in my opinion, who opined this morning that SPX looked ready to break out higher from a head and shoulder pattern (I assume inverted)….Ooops! 🙂
p.s. Looks like we have a complete impulse down. Monday ought to be most interesting…have a great weekend everybody! 🙂
Closed at the Low… 2127.81
I am looking at next week’s option chains and there is STILL an incredible amount of optimism in this market. That is truly remarkable! Especially give today’s significant decline. How can anyone possibly be this complacent? We may indeed, as Thomas suggests, have ways down to go…that is one big stick of a VIX candle!!! Yikes!!!!
The relatively low volume accompanying today’s decline is quite a mystery…any thoughts?
lack on conviction in the selloff. This is one sell off which both bulls and bears have been waiting for. Lots of money on sidelines looking to slowly enter market and hence financials performing relatively better etc.
Updated hourly chart.
So far I can’t see the structure for minor C complete. At 2,121, C = 2.618 X A.
The triangle is invalidated. Obviously 🙁
I still expect this is primary 4 (or intermediate (4) ) and not the start of a huge bear market.
The structure will fit as a combination: expanded flat – X – zigzag.
The key now is to see when minor C is done.
The break to the downside from this extended period of consolidation poses an interesting problem. This entire area is now going to be very formidable resistance so I suspect we could be facing the prospect of some kind of truncation of the final wave up…VIX is agreeing with you that we are not done with the plunge quite yet. I think the 2110 area is now in play…this is looking like wave four with a fifth wave down yet to unfold…
I think we are going lower. We are already almost at Lara’s target (above). We have been in an interesting and unusual condition in the SPX for a month now, where the BBs have been inside the Keltner Channels on the daily chart. That usually signals a lot of pent up energy that needs to get spent either up or down, and once it starts, like it has today, it usually takes at least 8-10 periods to spend itself. I think we are looking at a couple of weeks of downside here.
That would certainly play havoc with every EW count out there currently….
In these conditions the movement will sometimes reverse back in the other direction. Could happen here, and EW will be fine.
Here’s another idea: what if we have already seen the end of a (severely) truncated primary fifth wave?
Ai! Yi! Yi!
That would make this the top that NOBODY, and I mean nobody saw…
It would also be quite a lesson regarding unprecedented market conditions such as the historic BB compression we saw these last few weeks. I really hope anyone long this market was properly hedged or had stops in place. Fortunately for me, I choose to enter my long positions via bearish credit spreads that allowed me to do so virtually cost free exactly because of the possibility of what we saw today. I cannot imagine that downside stops were not all relentlessly taken out today…WOW!
I sold my VIX position way too early and left an awful lot of money on the table today.
No complaints though as it is often said no one ever went broke taking a profit! 🙂
“Complacency” Has Never Been Higher
Perhaps the best indicator is the so-called complacency index, which relates enterprise value (dictated by market prices for a company’s debt and stock), Ebit (a measure of actual profitability) and the Chicago Board Options Exchange’s Volatility Index, or VIX.
http://www.zerohedge.com/sites/default/files/images/user3303/imageroot/2016/09/07/20160909_Comp.jpg
2 months of sideways action wiped out in 1 day.
Still tend to think this is what is occurring with the SP500.
EWI has the same count, one degree lower. Yours makes more sense imo…today would be the C wave of a ZZ for intermediate two in the ECD….
FWIW, this move down feels like a 3 wave of some sort.
The last break from compressed BBs happened during Brexit on June 24. Interestingly enough that was also on a Friday. The low on the following Monday was 1991.68. The most recent compression has been far more intense and lasted much longer. I am wondering if we should be paying more attention to these kinds of indicators as the regular technical gauges have been so erratic of late…
I don’t know about you guys, but that VIX candle looks to me like some very serious business is underway. Those BBs may be getting ready to blow up big time….
Not that we should be surprised – they have been signaling this for weeks now…
Don’t know what the count is, but it sure does seem like we are no longer in a sideways market.
Personally, I’m glad to see it, even though I only caught a small portion of this move down, because for the past month holding either position long or short for an extended period of time meant profits were evaporating and becoming a loss.
I am under the impression that the markets will start trending again after today. Maybe this means I can go back to my 30 minute chart.
It will have to be a long-way down before I get excited! This is just another tease! Need to be actually down there 1st… then maybe.
I agree. This move down very likely only corrective with one final wave up to come. The one caveat in my mind are those remarkably compressed BB bands. We are either going to get on helluva final pop higher or the market is going straight to hell in a hand-basket. Whatever the next trend is that develops, it is going to be very violent, that much is reasonably certain….
EWI sees a potential minor wave 2 correction that could possibly take the DOW down to around 17,500.00
Closing at an extreme Low Today… Friday bodes will for Monday & going forward for the bears… If any bears remain or care. WTEOM
The current level of complacency is exactly what one would expect for a market top no?
What is quite amazing is this plunge downward today is happening on very low volume. The market is apparently falling under its own weight…
The absence of the tell-tale long upper wick on VIX may be signaling a continuation of this decline into Monday’s session. Of course this could change by the close but we could be gearing up for the plunge to pick up speed. A break of 2110 would be a game changer. Isn’t it kinda funny that not a single solitary person, including me, king of bears, has called a top in this market???!!!! Mr. Market might yet have the last laugh… lol
Now that the triangle has been invalidated, does anyone have an alternative count for Primary 4? I suppose this must be some sort of combination. I think we are still near the end, even though the invalidation would now be moved down to 2111.05.
Aww…what the heck; I am selling November 20 strike covered calls against my UVXY long position. You just watch – I’ll probaly get called away with the thing trading at 50! 🙂
SO far…looks like Lara’s 2157.09 number is holding. waiting for a trend change on the 1 minute chart, and I’ll hammer it on the long side.
Come on in…the water’s fine! 🙂 🙂 🙂
The banksters all know this is their last dance. I expect them to put on quite a show! he! he!
(As I said, they will probably wait until near the close to make their move so laddering into long positions is a good strategy imo…)
The more conservative may want to wait for a fill of today’s opening gap down…
Loading second half of bearish SPY credit spreads going into December. This is a very unconventional trade as I will be using deep in the money puts to build the spread. I am buying the December 16 SPY 220 puts and selling the December 16 221puts for a limit credit of 0.35 per contract. Risk is 100 per spread sold. The objective of the trade is not necessarily to make a big profit but to get positioned during the final wave up. As soon as I can exit the sell side of the spread at break-even I will do so by buying back the 221 puts and holding the 220 puts. I will add to the spread position when SPX closes above 2190.00
This a way to get positioned ahead of an anticipated big move with a minimum ( or none at all!), of capital outlay. 🙂
Just hit Lara’s end of (E) of circle-4 point. Bounce time!?
Selling remainder of my VIX shares at 13.88. Not bad for a cost basis of 11.50 considering how sleepy the market has been of late. Will reload the truck on any move back below 12.00
Back to break-even on UVXY shares and will be holding for the long haul (unless we go over 20.00 today)
Verne, how do you buy VIX shares?
They should be listed in your brokerage account under the ticker VIX. Some do not allow you to trade either VIX shares or its options so it may or may not show up depending on who you are trading with.
Speaking of bonds, keep an eye on TLT. A decisive break of 137 with a close below it will violate a support shelf going back to June of this year and probably signal that long term rates are about to drag the FED to the woodshed, albeit kicking and screaming… 🙂
Looks like we finally have that wave C of four showing up. It certainly took its sweet time with all that triangulating!
Key level for SPX is 2160 and we should see a bounce of it today with the final wave up beginning. The banksters will probably wait until the close to step in so as to try an trap a few eager bears who remain short over the week end. I will be adding to my bullish put credit spread with a move below 2170. If 2160 breaks early, we could retest the break-out area around 2110 early Monday.
The talking heads are finally beginning to talk about cracks in the bond market. It has been my long standing contention that this is where the the carnage will begin. The dirty little secret is that the crowd did not throw a hissy fit just because Draghi did not promise to expand the ECB balance sheet; the fact of the matter is that other central banks have been buying US equities as well, although you will never hear that little tidbit reported anywhere. We are getting close to the end folk. We will probably get up to around 2300.00 before it’s time to batten down the hatches. Lock and load…. 🙂
SNB purchases of U.S. equities has been in the news a lot recently. The ECB is stuck in the same corner that the SNB is facing: not enough bonds to buy is forcing them to buy equities.
“Switzerland’s central bank now owns more publicly-traded shares in Facebook than Mark Zuckerberg, part of a mushrooming stock portfolio that is likely to grow yet further.
The Swiss National Bank has become a multi-billion-dollar equity investor due to its campaign to hold down the Swiss franc. It is now the world’s eighth-biggest public investor, data from the Official Monetary and Financial Institutions Forum show.
“The SNB is in a bit of a corner, they have acquired a lot of foreign currency as part of their efforts to weaken the franc and they have to invest it somewhere,” said Alessandro Bee, an economist at UBS. “The bond market is drying up and so they are going increasingly for equities.”
Switzerland’s reputation as a safe haven has long caused problems for the SNB. Investors pile into the franc in times of uncertainty, causing a rise in the currency which hurts Swiss exporters and increases the risk of imported deflation.”
http://www.dailymail.co.uk/wires/reuters/article-3765259/Swiss-central-bank-steps-stock-buying-spree.html#ixzz4Jm03y9tR
Yep. They and the BOJ are the only ones admitting they are buying equities but they are all doing it…
It is really mind-blowing that they are allowed to do this. What are they going to do when all those shares get an 80% haircut??!!
They will sell out 100% of all positions once 1810 has broken down with further acceleration down. That will be the catalyst pushing it down to 1050.
I have been thinking about the market trading at these ridiculous levels with several quarters of declining revenues. One thing we have not talked much about is leverage. The criminal banksters are allowed to leverage as much as 30: 1
Now that is a really interesting thought. We know baby boomers have been retiring at the fastest rate ever and presumably pulling money out of the market. I wonder how much of this bloated market is due to laughable bankster leverage??!!
This thing could unravel with a rapidity that leaves even the most bearish among us shell-shocked!
I just looked at a chart of SVXY going back a few months and there have not been a single day, with the exception of August 24-26, when it went down went down for more than one day…now that is a manipulated market folks…
Foist? 🙂