
Price continues to move sideways within a clearly defined trading range.
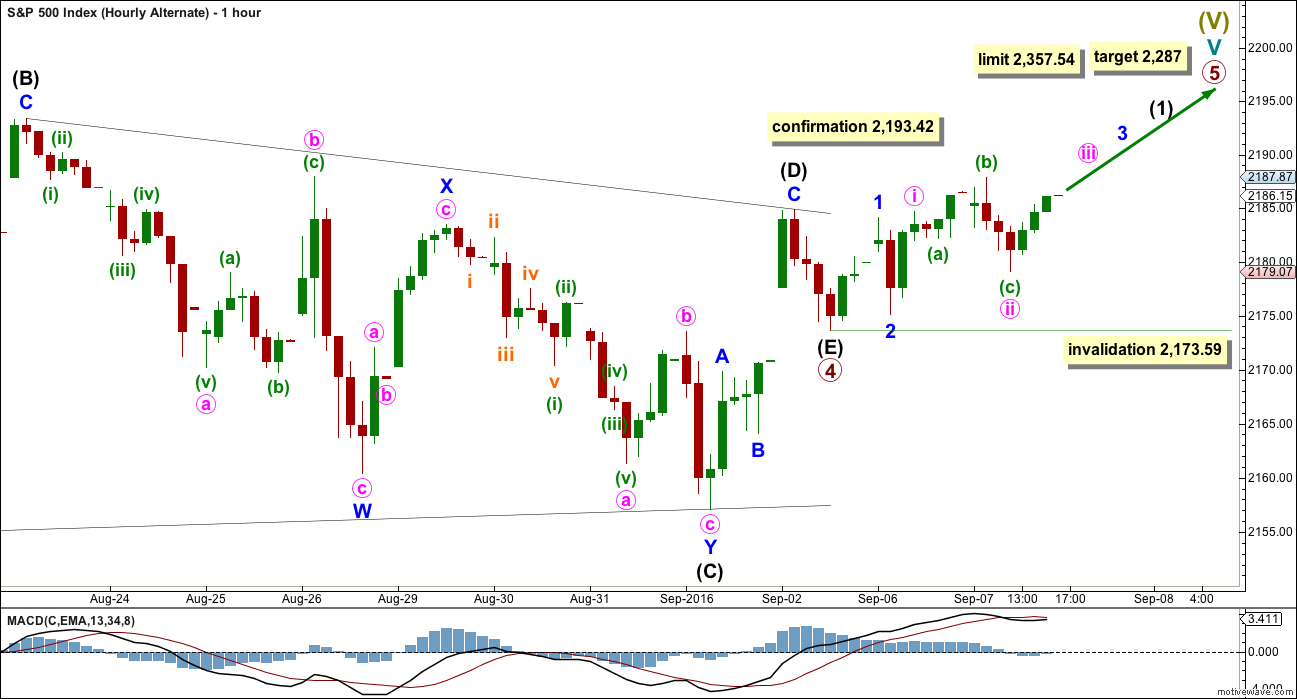
Summary: While price remains below 2,193.42, it is still likely that a final small wave down will end the consolidation. A new high reasonably above 2,193.42 would indicate that the consolidation is over and price should then continue higher to 2,287 but not above 2,357.54. Classic technical analysis today indicates one or two days of downwards movement is likely.
Last monthly chart for the main wave count is here.
New updates to this analysis are in bold.
MAIN WAVE COUNT
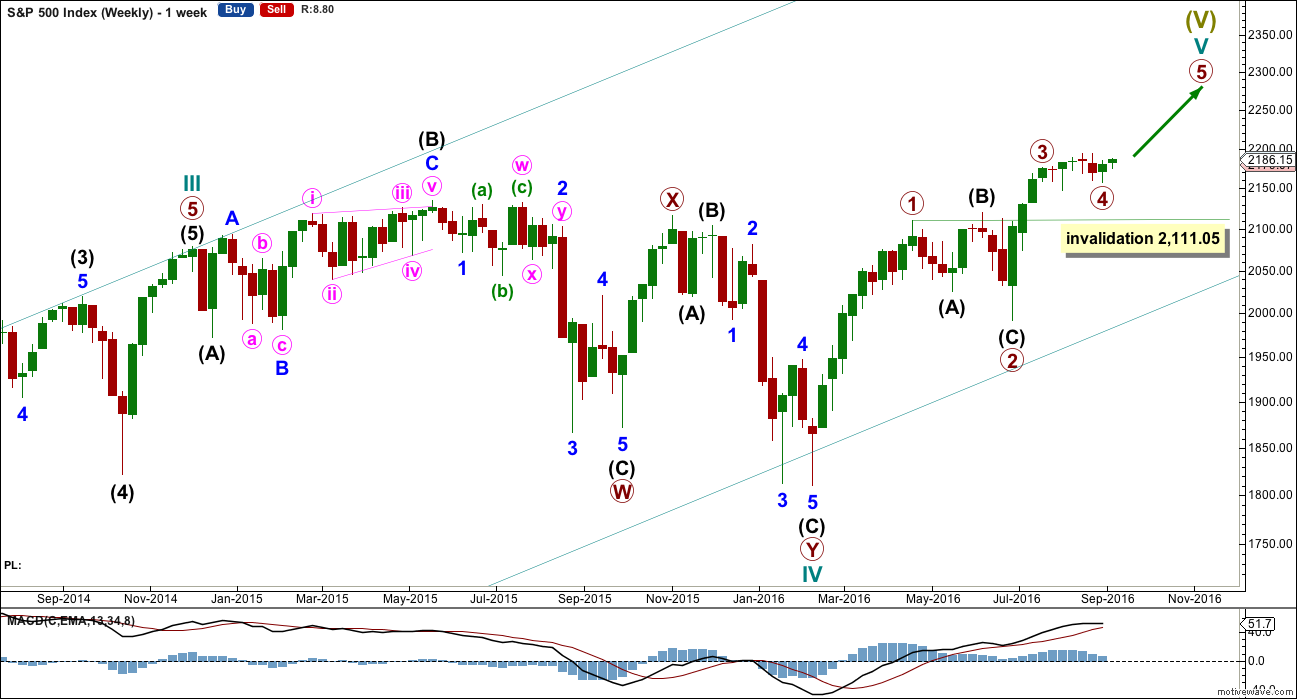
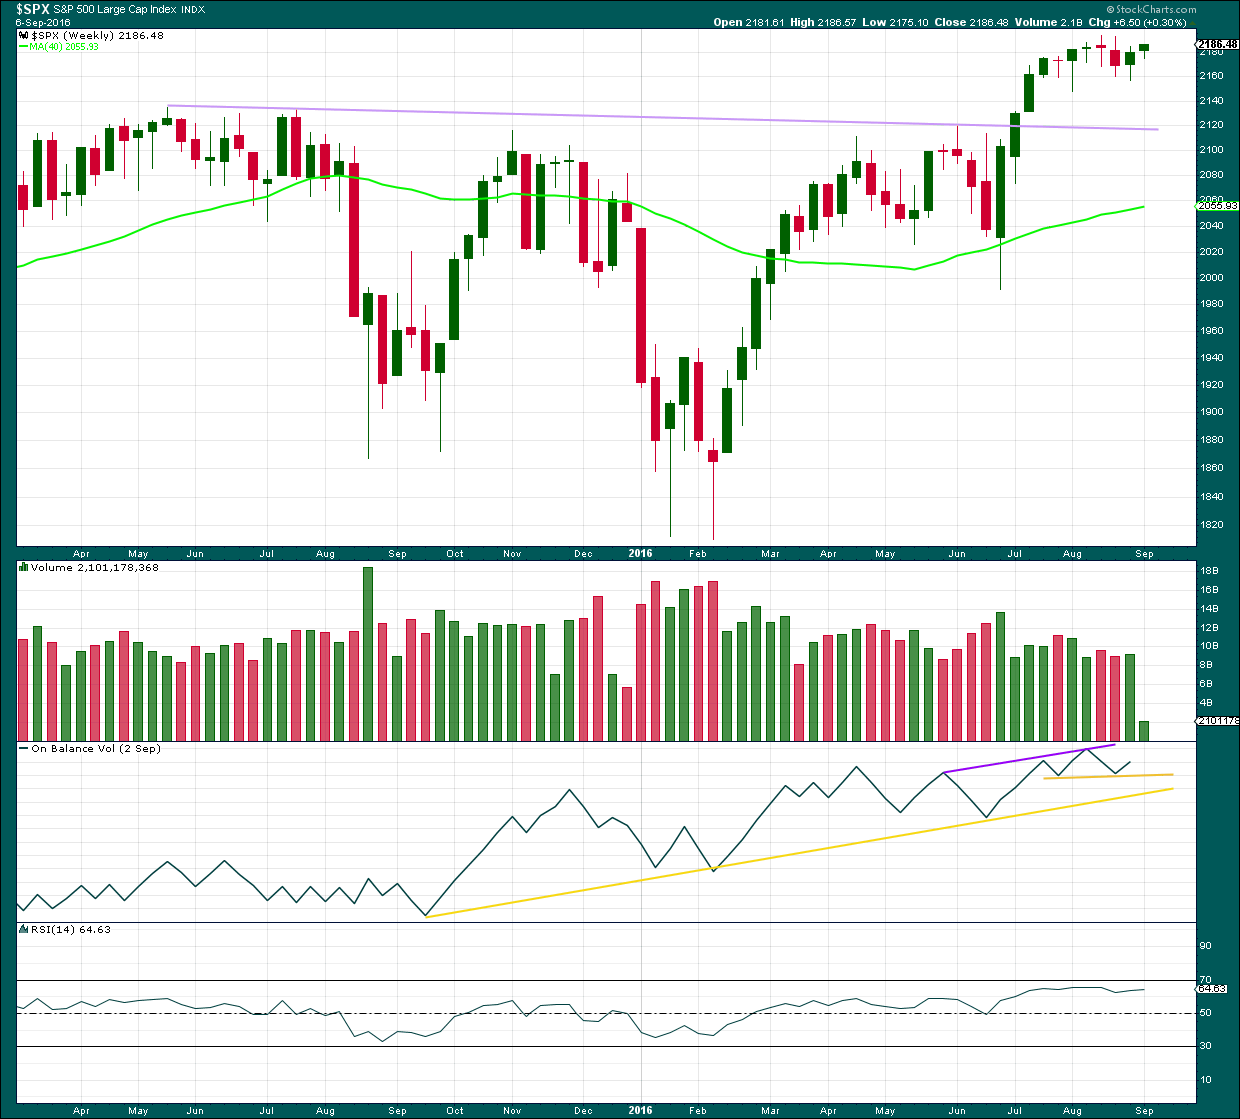
WEEKLY CHART
Click chart to enlarge.
Cycle wave V must subdivide as a five wave structure. So far upwards movement is unfolding as an impulse with the fourth wave completing. This may be primary waves 1, 2, 3 and now 4, with primary wave 5 upwards still to come.
Primary wave 3 is shorter than primary wave 1, but shows stronger momentum and volume as a third wave normally does. Because primary wave 3 is shorter than primary wave 1 this will limit primary wave 5 to no longer than equality in length with primary wave 3, so that the core Elliott wave rule stating a third wave may not be the shortest is met. Primary wave 5 will be limited to no longer than 183.95 points in length.
Primary wave 2 was a shallow 0.40 expanded flat correction. Primary wave 4 may be exhibiting alternation as a more shallow triangle.
Primary wave 4 may not move into primary wave 1 price territory below 2,111.05.
DAILY CHART

Click chart to enlarge.
Primary wave 2 lasted 47 days (not a Fibonacci number). Primary wave 3 lasted 16 days (not a Fibonacci number).
If primary wave 4 was over on 2nd of September, as per the alternate hourly count below, then it would have lasted a Fibonacci 34 days. If it continues for another one or few days, as per the main hourly wave count below, then it may not exhibit a Fibonacci duration.
The maroon channel is redrawn. Draw it first from the end of primary wave 1 (this can be seen on the weekly chart) to the end of primary wave 3, then place a parallel copy on the end of primary wave 2. If primary wave 5 comes up to touch the upper edge of this channel, then look out for a possible end to this structure there.
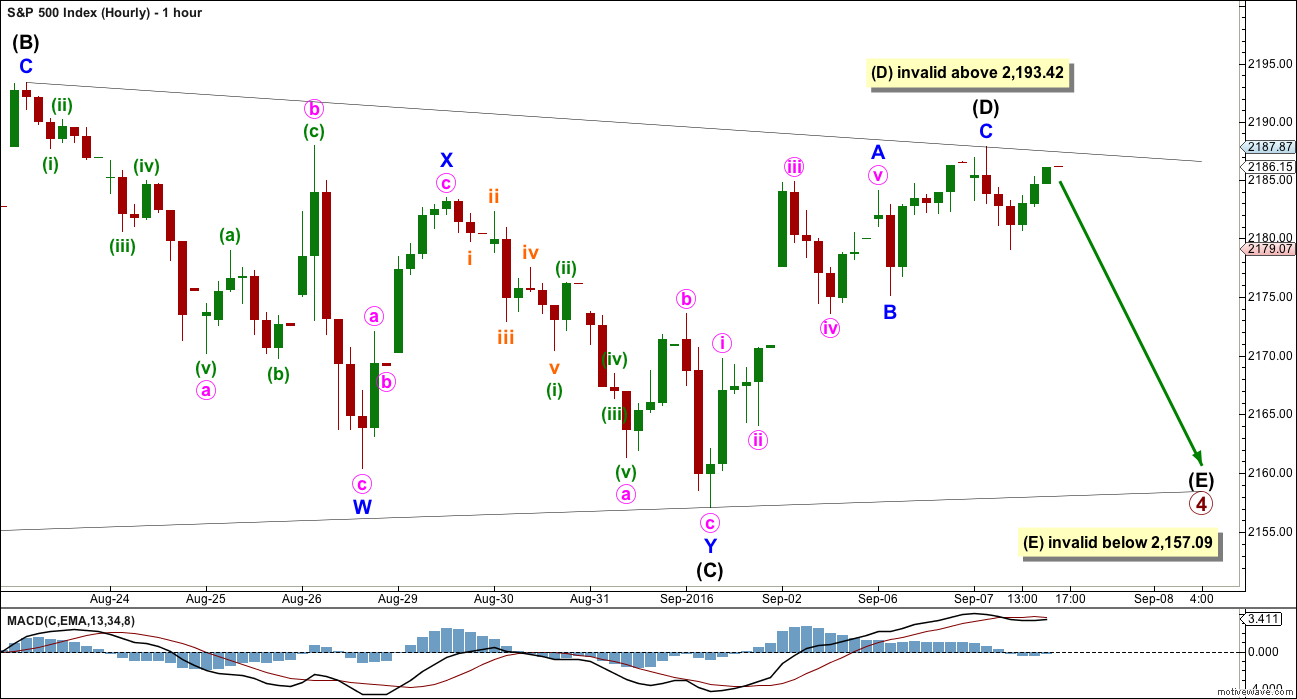
HOURLY CHART
Click chart to enlarge.
Intermediate wave (C) fits well as a double zigzag. One of the five sub-waves of a triangle should be a double.
Intermediate wave (D) no longer has a good fit as a completed zigzag. Minute wave v of minor wave A is slightly truncated, and minor wave C does not look like a five. If it continues any higher, then it may not move substantially above the end of intermediate wave (B) at 2,193.42.
If primary wave 4 is a contracting triangle, then intermediate wave (D) may not move beyond the end of intermediate wave (B).
If primary wave 4 is a barrier triangle, then intermediate wave (D) should end about the same level as intermediate wave (B), so that the (B)-(D) trend line is essentially flat. Unfortunately, this means that intermediate wave (D) may end slightly above the end of intermediate wave (B). This rule is not black and white.
Intermediate wave (E) is most likely to end short of the (A)-(C) trend line. The next likely point for it to end is with an overshoot of the (A)-(C) trend line. Intermediate wave (E) may not move beyond the end of intermediate wave (C) below 2,157.09. This invalidation point for the triangle is black and white.
Slight upwards movement for Wednesday’s session may have been intermediate wave (D) moving a little higher. There is still no Fibonacci ratio between minor waves A and C.
ALTERNATE HOURLY CHART
Click chart to enlarge.
If price continues higher and moves reasonably above 2,193.42, then this alternate hourly wave count would be confirmed.
It is possible to see the triangle for primary wave 4 as complete. Intermediate wave (E) may have fallen well short of the A-C trend line and been very brief. This is possible. All reasonable possibilities should be considered.
The structure for intermediate wave (D) now fits as a three.
If primary wave 4 is over here, then the limit for primary wave 5 is at 2,357.84 where it would reach equality in length with primary wave 3. Primary wave 5 may not be longer than equality in length with primary wave 3, so that primary wave 3 is not the shortest actionary wave.
Within primary wave 5, no second wave correction may move beyond the start of its first wave below 2,173.59.
At 2,287 primary wave 5 would reach 0.618 the length of primary wave 3.
At this stage, the degree of labelling within primary wave 5 sees intermediate wave (1) incomplete. Because primary wave 5 may be relatively short this degree of labelling may need to be changed in coming days; it may need to be all moved up one degree.
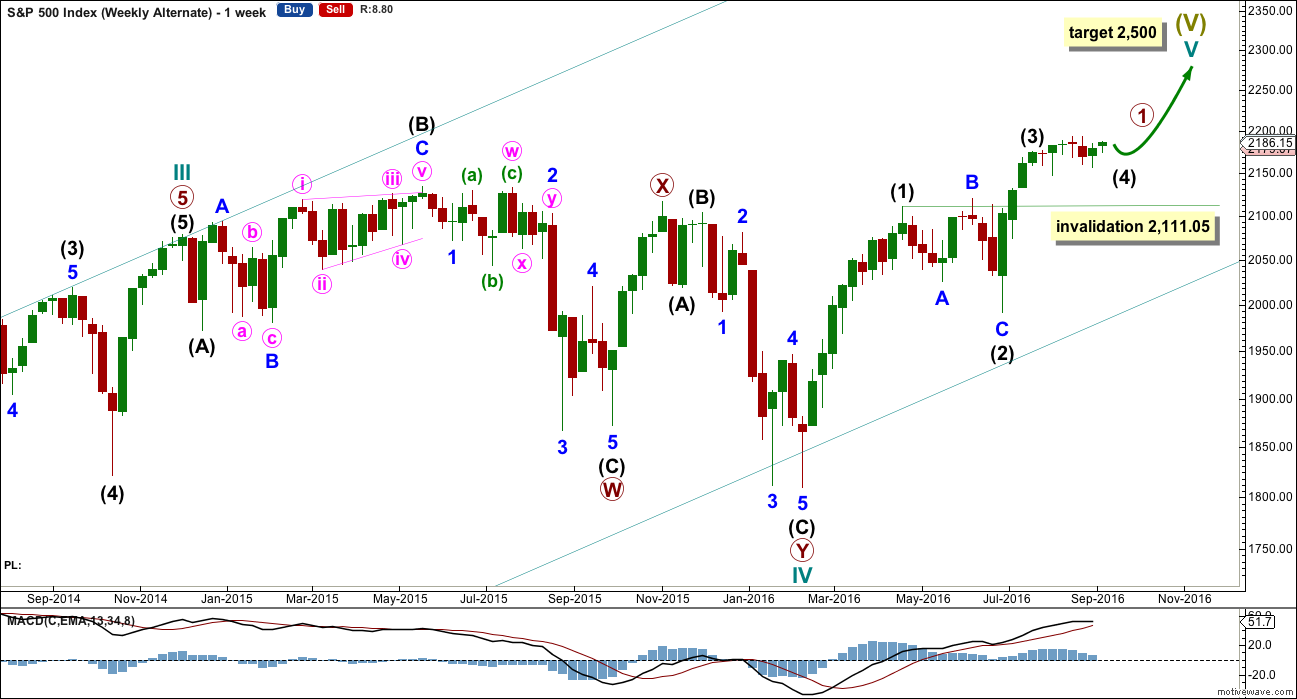
ALTERNATE WAVE COUNT
WEEKLY CHART
Click chart to enlarge.
This alternate is identical to the main wave count with the exception of the degree of labelling within cycle wave V.
Here the degree of labelling is moved down one degree. It is possible that only primary wave 1 is completing as a five wave impulse. When it is complete, then primary wave 2 would be expected to be a deep pullback which may not move beyond the start of primary wave 1. At that stage, the invalidation point would move down to the start of cycle wave V at 1,810.10. At that stage, a new low below this point would confirm a bear market for both Elliott wave and Dow Theory.
At 2,500 cycle wave V would reach equality in length with cycle wave I. This is the most common ratio for a fifth wave, so this target has a good probability.
At this stage, this alternate wave count differs only in the degree of labelling to the main wave count, so subdivisions for daily and hourly charts would be labelled the same.
TECHNICAL ANALYSIS
WEEKLY CHART
Click chart to enlarge. Chart courtesy of StockCharts.com.
Last week completed a green weekly candlestick with a long lower wick. The colour and lower wick are bullish. The slight increase in volume supports the rise in price and is also bullish.
On Balance Volume gave a bullish signal last week as it moved up and away from the upper yellow support line.
RSI is not extreme and exhibits no divergence with price. There is still room for price to rise.
DAILY CHART
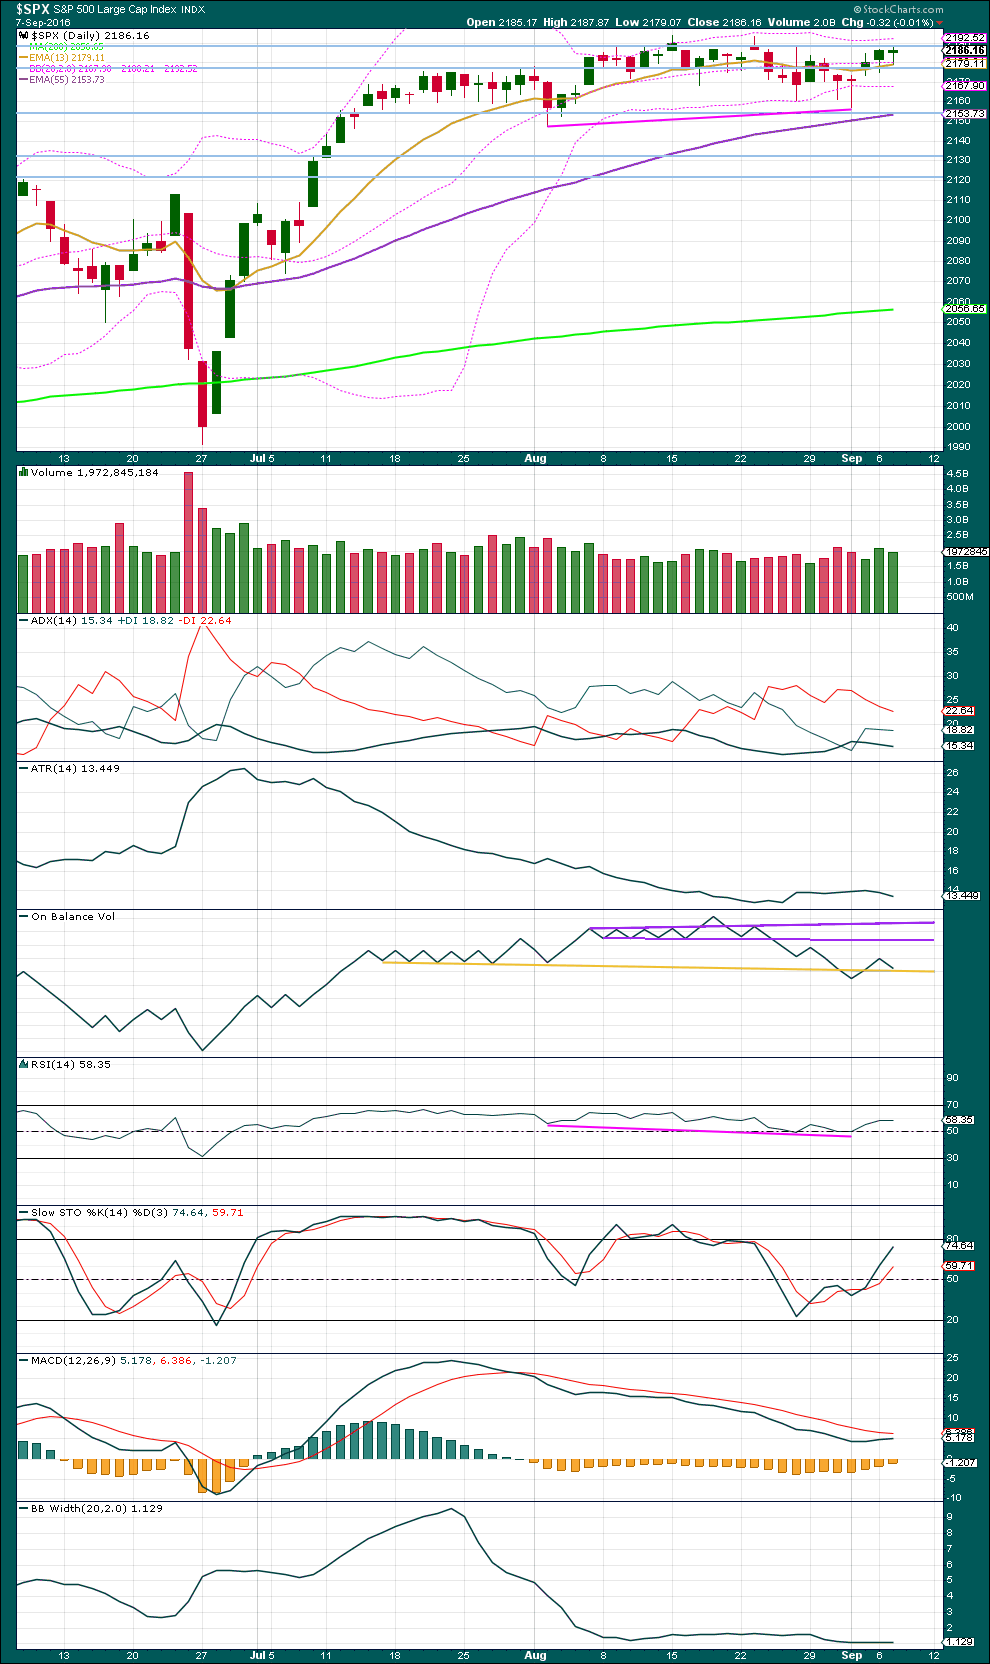
Click chart to enlarge. Chart courtesy of StockCharts.com.
Price remains range bound with resistance about 2,190 and support about 2,155. Price entered this range about 14th of July. During this period, it is the downwards day of 14th of July which has strongest volume suggesting a downwards breakout is more likely than upwards. However, this trick has recently proven to not work for this market. It is given little weight in this analysis.
A small green doji candlestick for Wednesday’s session suggests a balance between bulls and bears with bulls only slightly more dominant. Price is again finding resistance at the upper trend line about 2,190. A decline in volume for an overall upwards day indicates bulls may be exhausted at this stage. A downwards day is a likely result for tomorrow. This supports the main hourly Elliott wave count over the alternate.
ADX is declining, indicating the market is not trending. ATR is also flat to declining, in agreement with ADX. We would need to see price break above resistance at 2,190 or below support at 2,155 on a day with increased volume to have indication that the trend has returned.
On Balance Volume has today come lower to touch the yellow support line. This line may offer some support, but it has been recently weakened with a breach and return. OBV today supports the alternate hourly Elliott wave count over the main hourly Elliott wave count.
RSI is not extreme. There is room for price to rise further.
Stochastics is not yet overbought. There is a little room for price to rise further before the upwards swing may be over.
MACD should be watched carefully in the next few days. If the shorter black average crosses above the longer red average, then it would indicate a possible upwards trend returning.
Bollinger Bands are still very tightly contracted. There is very little volatility in this market. It will return, probably when price breaks out of this range.
VOLATILITY – INVERTED VIX CHART
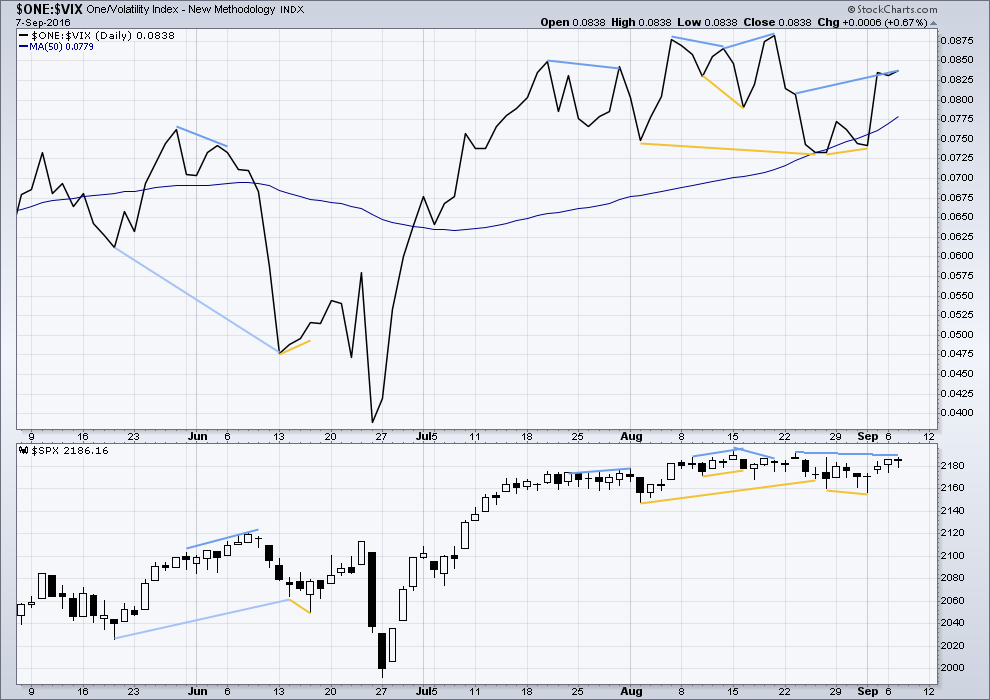
Click chart to enlarge. Chart courtesy of StockCharts.com.
Volatility is declining as price is rising. This is normal for an upwards trend.
There are a few instances of multi day divergence between price and inverted VIX noted here. Bearish divergence is blue. Bullish divergence is yellow. It appears so far that divergence between inverted VIX and price is again working to indicate short term movements spanning one or two days.
There is still some bearish divergence today between price and VIX from the high of 23rd of August: VIX has made a higher high but price has made a lower high. This indicates some weakness in price. It may be followed by one or two days of downwards movement. This supports the main hourly Elliott wave count over the alternate. However, divergence is not always working as expected and it may not work again here.
Price today moved higher but VIX moved lower. This is very short term further bearish divergence. It remains to be seen if it will work.
BREADTH – AD LINE

Click chart to enlarge. Chart courtesy of StockCharts.com.
There is support from market breadth as price is rising.
Short term bullish and bearish divergence is again working between price and the AD line to show the direction for the following one or two days.
There is now strong mid term bearish divergence between the AD line and price: the AD line made a new high today but price has failed to make a corresponding new high. This indicates weakness in price. It remains to be seen if this divergence will be followed by one or two days of downwards movement.
DOW THEORY
Major lows within the prior bull market:
DJIA: 15,855.12 (15th October, 2014) – closed below on 25th August, 2015.
DJT: 7,700.49 (12th October, 2014) – closed below on 24th August, 2015.
S&P500: 1,821.61 (15th October, 2014) – has not closed below this point yet.
Nasdaq: 4,117.84 (15th October, 2014) – has not closed below this point yet.
Major highs within the new bear market:
DJIA: 17,977.85 (4th November, 2015) – closed above on 18th April, 2016.
DJT: 8,358.20 (20th November, 2015) – has not closed above this point yet.
S&P500: 2,116.48 (3rd November, 2015) – closed above this point on 8th June, 2016.
Nasdaq: 5,176.77 (2nd December, 2015) – closed above this point on 1st August, 2016.
Dow Theory Conclusion: Original Dow Theory still sees price in a bear market because the transportations have failed to confirm an end to that bear market. Modified Dow Theory (adding S&P and Nasdaq) has failed still to confirm an end to the old bull market, modified Dow Theory sees price still in a bull market.
This analysis is published @ 08:54 p.m. EST.
[Note: Analysis is public today for promotional purposes. Member comments and discussion will remain private.]
I took a quick look a few months out at the option chains for the SPY ETF and MMs are expecting a big move to the downside. December puts are expensive. 220 strike puts are 7 bucks, the calls are just over 4. To find puts trading at under a buck yo have to go all the way down to a strike price of 185.00. I am opening a bullish put spread of 180/185 in anticipation of the final leg up for limit credit of 0.30 per contract. I continue to buy VIX shares on any move under 12 and my pile is now at half full strength as I am maintaining a trailing stop to sell half, of 1.00 point. Volatility, low as it is, has been the is the only reliably profitable trade the past few weeks in this undead market. Rinse and repeat! 🙂
We need to know when the fed will stop with all their support. Just like when we knew they were done with POMO, we need to know when PPT is going to be done here, otherwise, we can’t trust any of these moves. It’s obvious ‘to me’ (lol…or so I hope) that they are not buying the market up, only supporting the market from free fall.
They are never going to stop. The events of the last few weeks could be quite ominous in that their on-going efforts to keep the bubble inflated could be becoming less effective. I am starting to suspect that market outflows are now such that the bankster largesse that previously would issue in manic triple digit runs (in DJI) to the upside now suffice only to keep the market treading water. The market continues to decline under its own bloated weight, despite a complete absence of any aggressive sellers. They continue to spend prodigious amounts of capital just to keep the market from a precipitous decline.
Exiting sell side of bearish SPY call spreads. Holding upside calls for final move up. Nothing much to see until wave four completes followed by a slow torturous fifth wave up. It is looking more and more like the banksters are going to have to offer some kind of empty inducement to get the lemmings to jump on board for the final push higher. Will check in again tomorrow! 🙂
Mario made markets cry today!
Ohhh… the little babies!
The level of journalistic daftness is nothing short of stunning. In fact the chaotic state of the markets very much reflects the incredible stupidity of the so-called investing public at large. Does any thinking person really believe that Draghi and his criminal bankster cronies are not ALREADY buying assets completely outside their mandate in an attempt to prop up the markets????! Of course he cannot make an commitment to do what he is ALREADY doing since he would have to admit that he was doing it! Come on people, get with the program!! 🙂
Another insightful big picture perspective from Peter Temple at World Cycles Institute. A great reminder that the final outcome to the drama we are seeing, is inexorable, slow and painful though it may be. All the pumping, dumping, and stumping by the banksters will in the end be to no avail. Their proverbial goose is cooked. The key is preserving capital for the moment of truth, which I suspect is not too far in the future…
http://worldcyclesinstitute.com/the-man-made-money-cycle/
“if you play this right, it could be the biggest financial opportunity of your life”
That’s what I’m figuring on.
Cash is king.
….and Queen! 🙂
The markets are soaring thanks to bad employment figures. This becomes quite banal as a behavior. The Fed should continue its accommodative monetary policy, and markets rejoice.
Record of global warming, global debt record, record bond bubble, record of financial markets, and record of human stupidity … All going in the same direction for the same causes, probably with the same deadlines…
In purely economic terms, many economists are struggling…the Keynesian principle that was to revive growth through money creation to repay debts no longer works … while the permanent injection of liquidity by gigantic amounts, produces no inflation at all. Why is that ?
Maybe because our model of civilization has crossed a threshold which defeats the Keynesian principle … Globalization leads naturally to deflation since the objective of all multinationals and big business in an ultra liberal and deregulated world, is to reduce the cost of labor, to reach almost zero..
Therefore no central bank can create inflation in such a model of civilization. This means that it can go on, and that the record of human stupidity is still far from being achieved.
Long live the Fed and the ECB … yum … my prediction for today? Opening, downwards 6-7 points, then around 11.30 am upwards movement, then final close in light positive territory. Wanna bet?
AFAIK the Keynesian approach would be to create money or use money to invest in infrastructure and job creation. That’s not what QE has been doing though. They’ve pumped it into the financial sector, and mostly that seems to be where it’s stayed.
So what they’ve done isn’t AFAIK Keynesian. If I’m correct there then we can’t look to this example as a fail for Keynes.
Your bet was pretty close. But closed with a tiny red doji. Nothing to see here folks.
We have a member here, Peter, who’s an economist. I asked and he explained why QE hasn’t led to inflation.
As far as I could figure he reckoned that it was because the sector of society into which the money has been put is already relatively wealthy. They luxury items they purchase does not allow the money to flow through the wider economy. So no inflation.
I may have gotten that interpretation wrong.
But if it’s right, then the conclusion from that is also that the trickle down theory doesn’t work.
It hasn’t worked in NZ anyway.
The banks are sitting on massive reserves they accumulated when the Central banks bought off a lot of their toxic assets, primarily the mortgage backed securities, and CDOs. Not only is there not a lot of demand for loans which is really depressing the velocity of money, the banks all know they are going to need those reserves just to stay alive when the rest of the garbage on their books blow up, and they will (on both counts!). Unfortunately for them, no amount of reserves they possess is going to keep them alive when the bond market blows up. Their loans to the fracking industry alone is going to sink half of them, the other half when commercial real estate blows up…
option expiry next week and then BOJ and Fed meeting week after that. So maybe some volatility then
First!! What I’d give for a few consecutive good candles in either direction in any time frame!
Well done Ron 🙂
And yes. I think we all would be very thankful for some volatility and range to return to this market.
Mr Market is looking very dead indeed.
I would give just as much…lol. Just trend….please…one direction or another.