
A little upwards movement was expected for Friday, but it was not expected to move above 2,183.48.
Summary: A little downwards movement to end above 2,157.09 is now expected to complete this consolidation, and it may end in just one day. Thereafter, it is expected that price will break out of this range upwards. The upwards breakout may be relatively short and brief.
Last monthly chart for the main wave count is here.
New updates to this analysis are in bold.
MAIN WAVE COUNT
WEEKLY CHART
Click chart to enlarge.
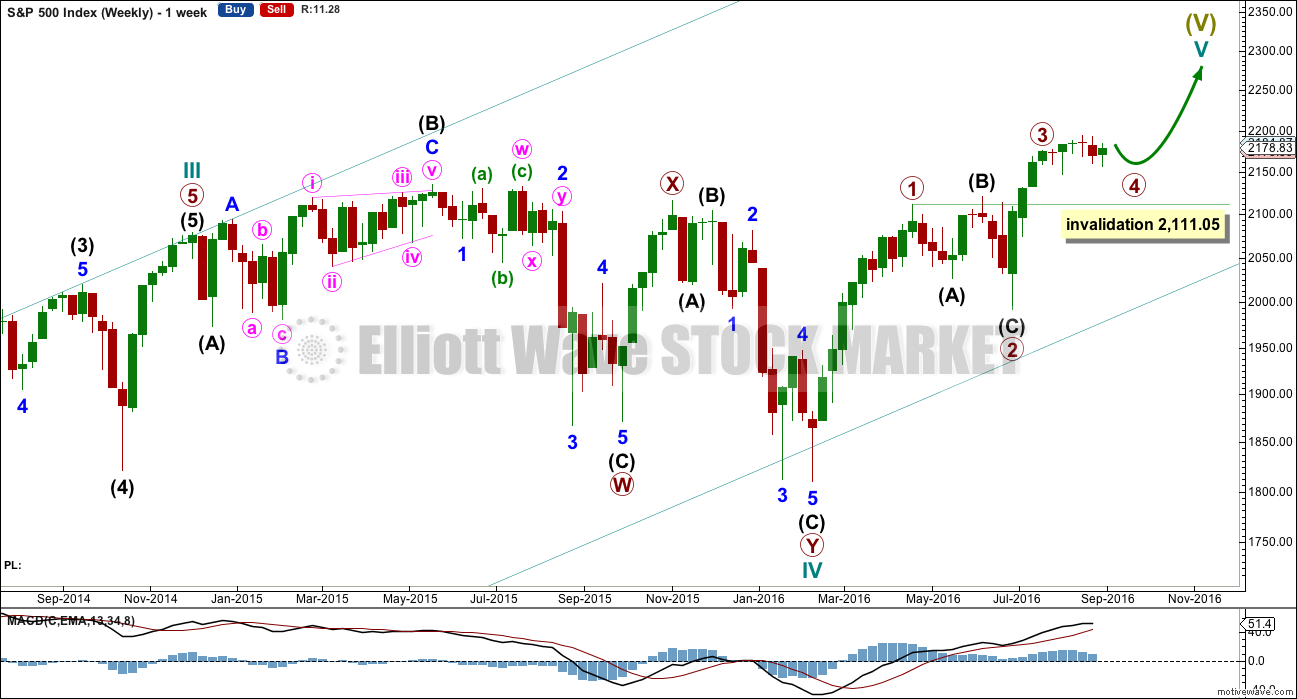
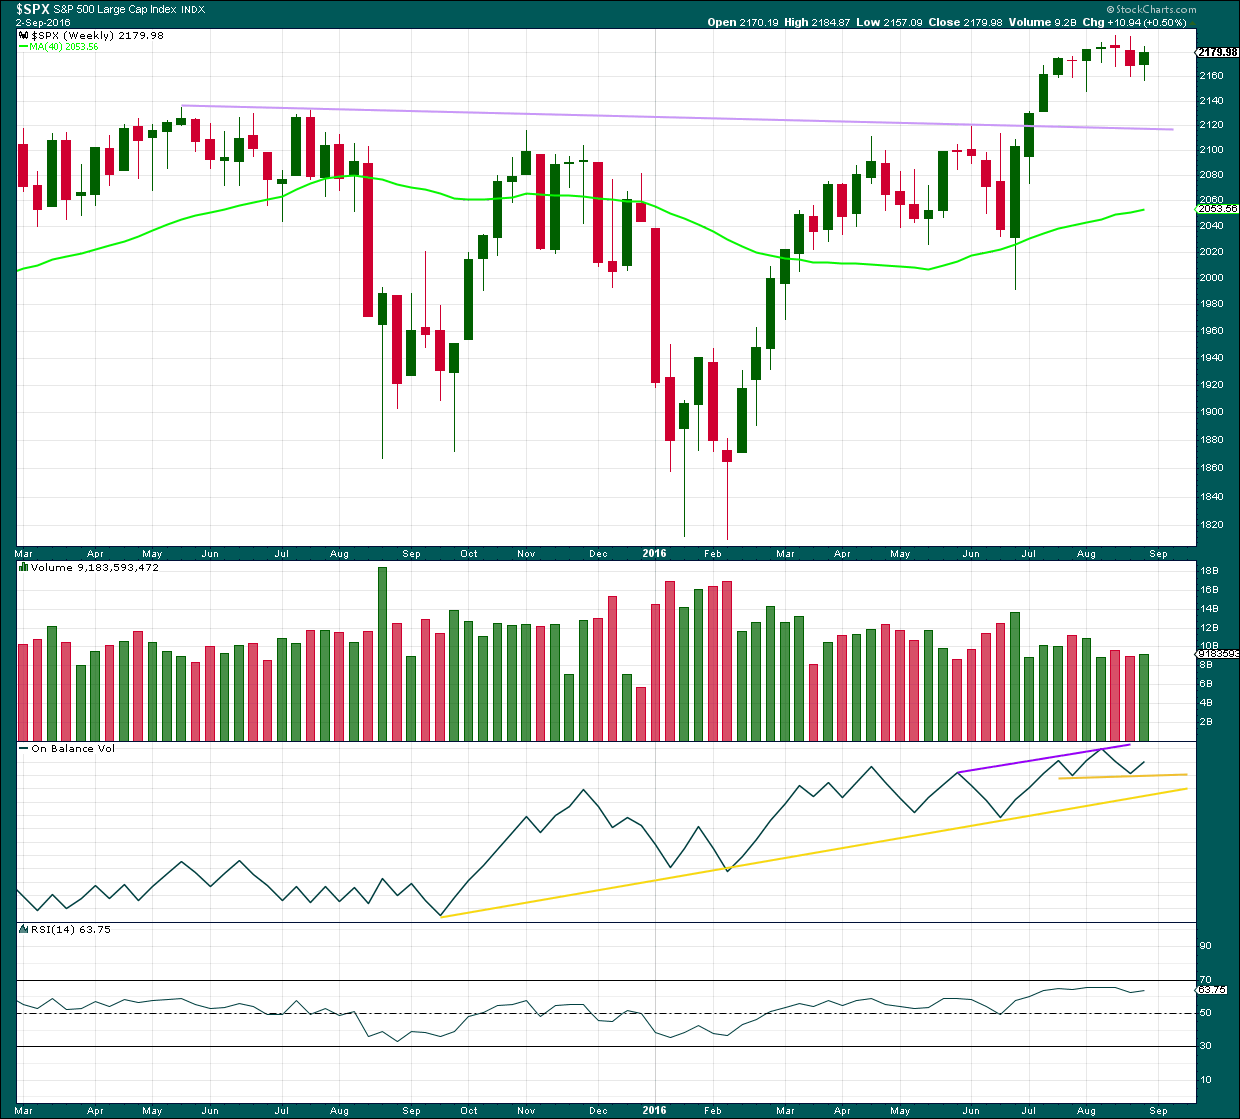
Cycle wave V must subdivide as a five wave structure. So far upwards movement is unfolding as an impulse with the fourth wave completing. This may be primary waves 1, 2, 3 and now 4, with primary wave 5 upwards still to come.
Primary wave 3 is shorter than primary wave 1, but shows stronger momentum and volume as a third wave normally does. Because primary wave 3 is shorter than primary wave 1 this will limit primary wave 5 to no longer than equality in length with primary wave 3, so that the core Elliott wave rule stating a third wave may not be the shortest is met. Primary wave 5 will be limited to no longer than 183.95 points in length.
Primary wave 2 was a shallow 0.40 expanded flat correction. Primary wave 4 may be exhibiting alternation as a more shallow triangle.
Primary wave 4 may not move into primary wave 1 price territory below 2,111.05.
DAILY CHART
Click chart to enlarge.
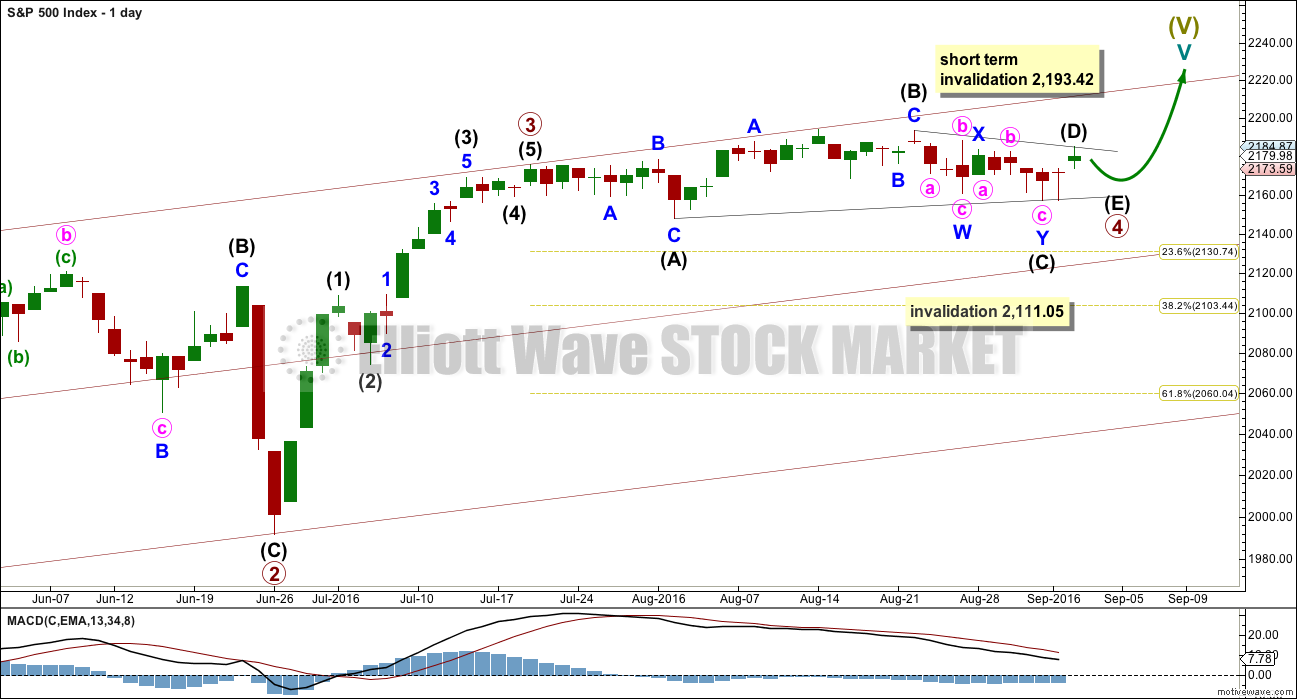
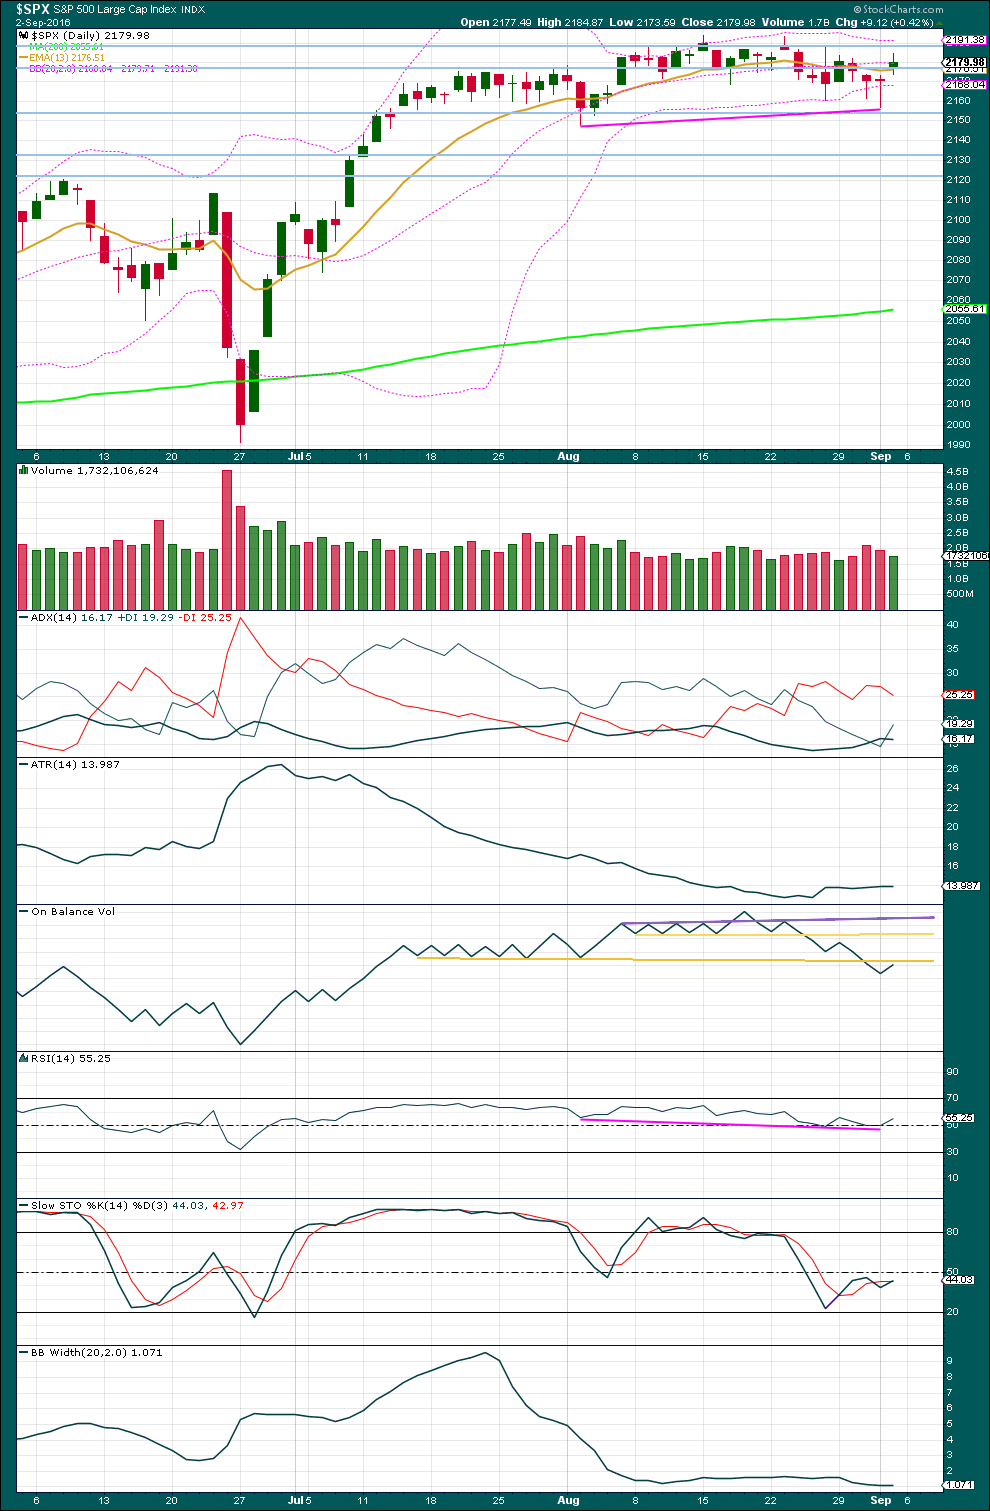
Primary wave 2 lasted 47 days (not a Fibonacci number). Primary wave 3 lasted 16 days (not a Fibonacci number). So far primary wave 4 has lasted 33 days. So far the proportion between primary waves 2 and 4 give this wave count the right look, especially if primary wave 4 continues further.
If primary wave 4 exhibits a Fibonacci number in days of duration, then the next Fibonacci number in the sequence is 34. It may end in another one day.
The structure of primary wave 4 as a double combination no longer fits. Downwards movement from the high labelled intermediate wave (B) will not fit as a five wave structure. Primary wave 4 may be unfolding as a running contracting triangle. Within the triangle, if the downwards wave labelled intermediate wave (C) is seen as a double zigzag, then the subdivisions will fit on the hourly chart.
Only the final zigzag downward for intermediate wave (E) would now be required to complete the whole structure of primary wave 4. It is possible that this may complete in just one more day for primary wave 4 to total a Fibonacci 34 days. Intermediate wave (E) would be most likely to fall a little short of the (A)-(C) trend line.
When primary wave 4 is complete, then a target may be calculated for primary wave 5 to end. That cannot be done yet.
Fifth waves to follow triangles can sometimes be remarkably short and brief. Primary wave 5 may be as short as the widest part of the triangle, which is just under 46 points. Primary wave 5 would be limited to no longer than 183.95 points. It may be over very quickly.
The maroon channel is redrawn at the end of this week. Draw it first from the end of primary wave 1 (this can be seen on the weekly chart) to the end of primary wave 3, then place a parallel copy on the end of primary wave 2. If primary wave 5 comes up to touch the upper edge of this channel, then look out for a possible end to this structure there.
HOURLY CHART
Click chart to enlarge.
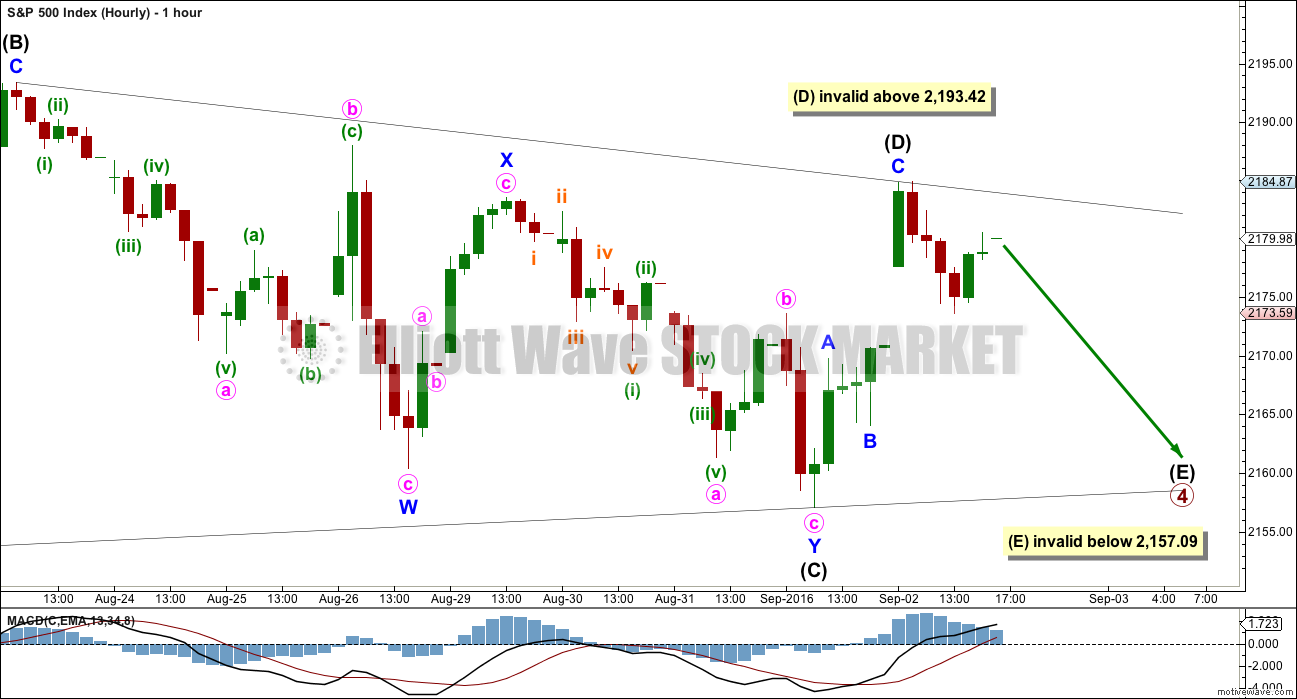
Intermediate wave (C) fits well as a double zigzag. One of the five sub-waves of a triangle should be a double.
Intermediate wave (D) fits as a completed zigzag. If it continues any higher, then it may not move substantially above the end of intermediate wave (B) at 2,193.42.
If primary wave 4 is a contracting triangle, then intermediate wave (D) may not move beyond the end of intermediate wave (B).
If primary wave 4 is a barrier triangle, then intermediate wave (D) should end about the same level as intermediate wave (B), so that the (B)-(D) trend line is essentially flat. Unfortunately, this means that intermediate wave (D) may end slightly above the end of intermediate wave (B). This rule is not black and white.
Intermediate wave (E) is most likely to end short of the (A)-(C) trend line. The next likely point for it to end would with an overshoot of the (A)-(C) trend line. Intermediate wave (E) may not move beyond the end of intermediate wave (C) below 2,157.09. This invalidation point for the triangle is black and white.
I have tried to see alternate ideas for the structure of primary wave 4. At this stage, all alternates considered would require the downwards wave beginning at the high labelled intermediate wave (B) at 2,193.42 to be seen as a five wave structure. This will not fit.
This does not mean another structure is not possible, only that so far I cannot see how it would fit.
ALTERNATE WAVE COUNT
WEEKLY CHART
Click chart to enlarge.
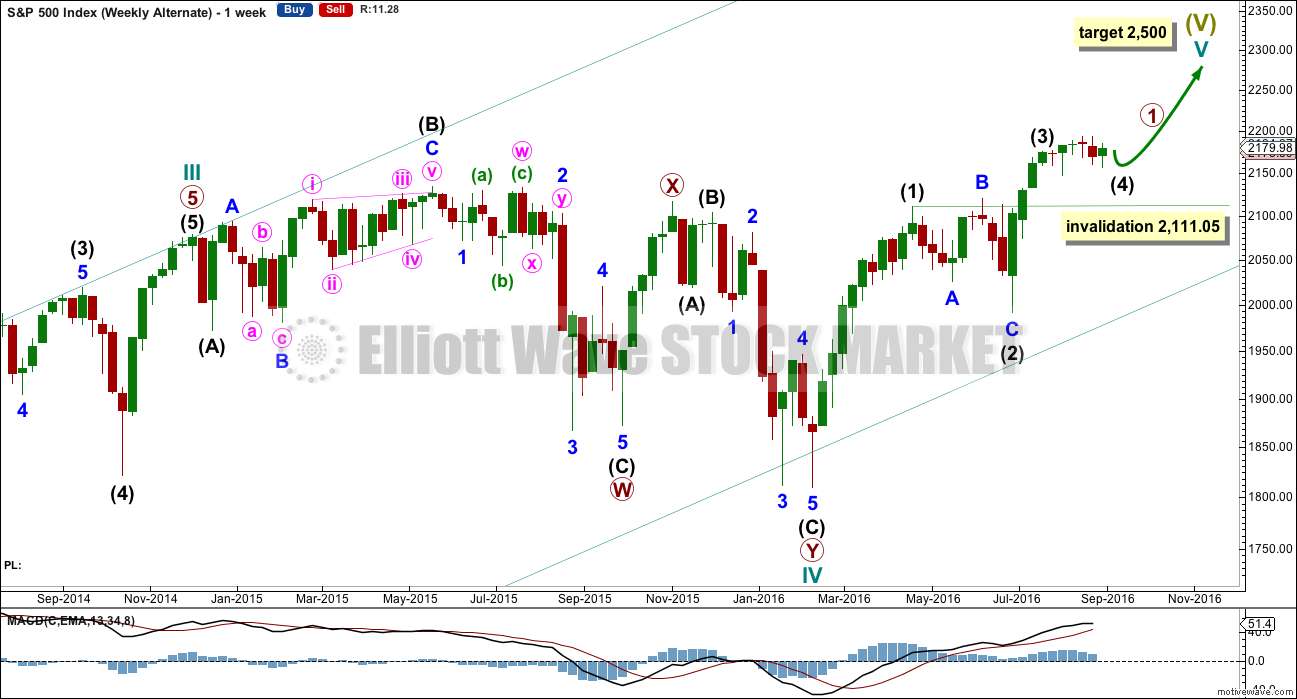
This alternate is identical to the main wave count with the exception of the degree of labelling within cycle wave V.
Here the degree of labelling is moved down one degree. It is possible that only primary wave 1 is completing as a five wave impulse. When it is complete, then primary wave 2 would be expected to be a deep pullback which may not move beyond the start of primary wave 1. At that stage, the invalidation point would move down to the start of cycle wave V at 1,810.10. At that stage, a new low below this point would confirm a bear market for both Elliott wave and Dow Theory.
At 2,500 cycle wave V would reach equality in length with cycle wave I. This is the most common ratio for a fifth wave, so this target has a good probability.
At this stage, this alternate wave count differs only in the degree of labelling to the main wave count, so subdivisions for daily and hourly charts would be labelled the same.
TECHNICAL ANALYSIS
WEEKLY CHART
Click chart to enlarge. Chart courtesy of StockCharts.com.
Last week completed an Evening Doji Star and Bearish Engulfing candlestick pattern. But these patterns were not supported by volume, which weakened the reversal signal. Now this week completes a green weekly candlestick, which does have some support from volume, so the prior reversal signal has not been confirmed.
The small increase in volume for this week’s green candlestick is bullish. The long lower wick is bullish.
On Balance Volume has found support at the first yellow support line and turned up from there. This is a small bullish signal.
RSI is not extreme. There is room for price to rise or fall.
DAILY CHART
Click chart to enlarge. Chart courtesy of StockCharts.com.
Friday’s small green candlestick is a spinning top. This is not a reversal signal within a consolidation because there is nothing to reverse. The several doji and spinning tops within this consolidation represent a balance of bulls and bears, as would be expected during a consolidation.
Price has been range bound with resistance about 2,190 and support about 2,155 since 14th of July. During this period, it is a downwards day of 27th of July that has strongest volume suggesting a downwards breakout as more likely than upwards. However, this signal has recently proven to be unreliable for this market, so it is given no weight in this analysis.
Friday’s small upwards day comes with a decline in volume. In the short term, this signal has proven to be effective in indicating direction for the following session. This indicates downwards movement is most likely when markets open next week.
ADX is flat after Friday’s session, again indicating the market is not trending. ATR remains flat in agreement with ADX.
On Balance Volume gave a bearish signal with a break below the lower yellow support line. Now OBV has come up to touch this line. It should be expected to provide resistance and stop price from rising further here.
There is now divergence between price and OBV from the low of 2nd of August to the low of 1st of September. OBV has made a lower low but price has made a higher low. This divergence is bullish and indicates weakness in price. This is given a little weight in this analysis as divergence has again been shown to sometimes be working.
RSI also now exhibits some divergence with price from 2nd of August to 1st of September (pink lines). This divergence is also bullish and indicates weakness in price. This divergence is given only a little weight in this analysis.
Stochastics may be returning from almost oversold. An upwards swing from price in a range bound market would be a reasonable expectation about here.
Bollinger Bands remain very tightly contracted and make no comment on price direction. There is almost no volatility in this market.
Overall, there is still persistent weakness in this market. Price continues to drift sideways, and when it is able to rise and make new highs it is more due to a lack of selling pressure and overhead resistance than it is due to buying power. Bear markets can begin suddenly, and currently Bollinger Band contraction is very worrying. If the Elliott wave count that sees a triangle almost complete is correct, then it may end quickly and be followed by a quick short final wave up. The bear market may possibly begin then, sooner than expected.
At this stage though a deeper more sustained downwards movement in price would require sellers to enter the market. So far that has not happened.
VOLATILITY – INVERTED VIX CHART
Click chart to enlarge. Chart courtesy of StockCharts.com.
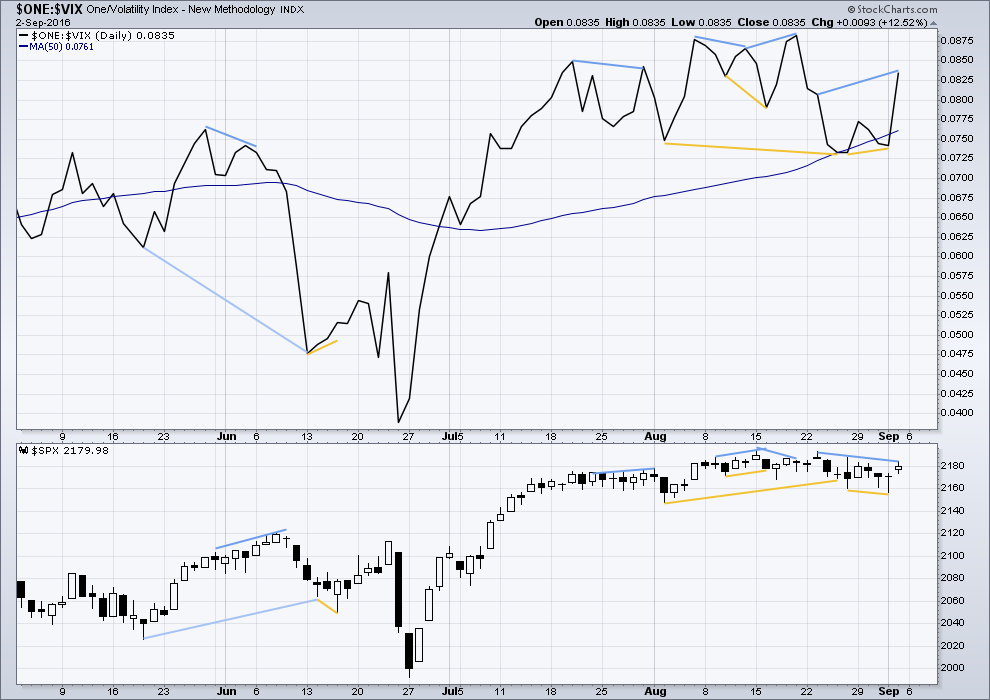
Volatility is declining as price is rising. This is normal for an upwards trend.
There are a few instances of multi day divergence between price and inverted VIX noted here. Bearish divergence is blue. Bullish divergence is yellow. Each of these instances was followed by expected price movement if only for two days. Divergence with VIX and price is not always working, but it is still sometimes working. So it will be noted.
It appears so far that divergence between inverted VIX and price is again working to indicate short term movements spanning one or two days.
At the end of the week, there is some bearish divergence between price and VIX from the highs of 23rd of August to 2nd of September: VIX has made a higher high but price has made a lower high. This divergence indicates weakness in price. It is bearish and may be followed by one or two days of downwards movement. This supports the Elliott wave count short term.
BREADTH – AD LINE
Click chart to enlarge. Chart courtesy of StockCharts.com.
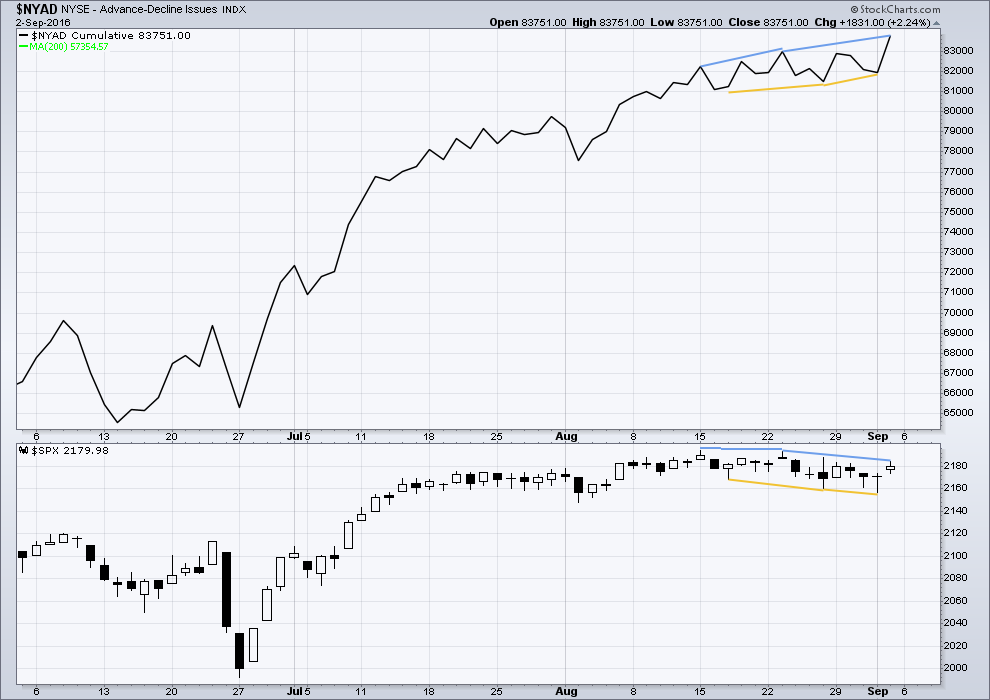
There is support from market breadth as price is rising.
Short term bullish and bearish divergence is again working between price and the AD line to show the direction for the following one or two days.
Some mid term bearish divergence is noted between the AD line and price at the end of this week: from the high of 23rd August to the high of 2nd September, the AD line has made a higher high but price has made a lower high. This indicates weakness in price. This bearish divergence may be expected to be followed by one or two days of downwards movement. This supports the Elliott wave count short term.
DOW THEORY
Major lows within the prior bull market:
DJIA: 15,855.12 (15th October, 2014) – closed below on 25th August, 2015.
DJT: 7,700.49 (12th October, 2014) – closed below on 24th August, 2015.
S&P500: 1,821.61 (15th October, 2014) – has not closed below this point yet.
Nasdaq: 4,117.84 (15th October, 2014) – has not closed below this point yet.
Major highs within the new bear market:
DJIA: 17,977.85 (4th November, 2015) – closed above on 18th April, 2016.
DJT: 8,358.20 (20th November, 2015) – has not closed above this point yet.
S&P500: 2,116.48 (3rd November, 2015) – closed above this point on 8th June, 2016.
Nasdaq: 5,176.77 (2nd December, 2015) – closed above this point on 1st August, 2016.
Dow Theory Conclusion: Original Dow Theory still sees price in a bear market because the transportations have failed to confirm an end to that bear market. Modified Dow Theory (adding S&P and Nasdaq) has failed still to confirm an end to the old bull market, modified Dow Theory sees price still in a bull market.
This analysis is published @ 2:20 a.m. EST on 3rd September, 2016.
Some thoughts….the working group that was set up by Reagan using his executive privilige will some day be put under the microscope. Treasury Lew, Yellen, and others are all part of this group, with Lew in charge. His job is to maintain market stability by using methods untraceable to the laymen. Sooner or later someone will wise up and track down what is going on here. If the treasury is printing money to buy stocks to put Clinton and the Dems in a favorable spot this would be criminal. The justice department needs to investigate this. This would be like giving the incumbent a free tax on the people for their objectives of being re elected. The people have to pay for this and so what the treasury doing with the working group, aka the plunge protection team, needs to be transparent to the people who pay for it, I.e. Taxpayers. This group would give huge wins for banks in the know of their process. Let’s talk to our senators/congressmen about this to get some visibility.
When stocks go down when trump gets the lead and after the elections we will have a pretty good idea what is going on. Others in the press have brought this up, but no follow up.
The PPT is made up of democrats by the way.
One of the unfortunate outcomes of this election is that one of them will win….arrrggghhh!
News from Europe…
I don’t know if this was the implicit goal displayed by the European Central Bank (ECB) when it presented, in january 2015 , its asset purchase programme, to address the risks of a too prolonged period of low inflation. Monthly purchases in public and private sector securities amount to €80 billion on average (from March 2015 until March 2016 this average monthly figure was €60 billion)
This monday, the loans exceeded the symbolic threshold of 1,000 billion euros. With mixed results !!!!
The launch of this “bazooka money ” by the ECB was intended to revive growth and inflation in the euro area. 18 months later, a slight recovery of bank credit and the beginning of rising prices has been witnessed, but we are still far from expectations of monetary institution. Inflation painfully reached 0.2% in August. In the mean time the ECB increased in March its monthly purchases to 80 billion euros and also decided to pick up the debt of highly rated companies…. Where are we going? Doubts remain about the ability of the ECB to ultimately reach his goal. Officially, the program is expected to end in March 2017, but markets expect an extension. This will pose the question of available resources.
http://archyworldys.com/the-ecb-has-bought-more-than-1000-billion-euros-of-debt-2/
Invisible hand…down to 2175 and then …up!
Parabolic curve day after day….
Day after day… parabolic curve…down and then … invisible hand at workand ..up!
Everybody’s talking about risks, black swans (CNBC), economic problems, but our beloved SP is ingesting blue pill over blue pill and maintains a long lasting bull-virility…
Maybe for 4 hours… Then off to the emergency room.
AND it begins…
The promotion of the Narrative to do away with CASH… Starting with the $100 Bill!
The ground work being laid by Kenneth S Rogoff with the book The Curse of Cash! An Obama and Clinton Crony from Harvard.
He is spewing his garbage on CNBC this morning and the Federal Reserve Lovers on that station are playing along with the Narrative like a bunch of foolish children!
Negative Interest Rates will be arriving in the USA in 2017/2018! So you will be paying anywhere from .5% to 2.0% in negative interest on any dollars held in checking or savings accounts.
ALL these people laying the foundation of this narrative should be thrown into jail for life… ALL of them!
Wake up people! Don’t Buy the Sales Pitch!!!
Right on Joseph!
First!!!