
Price moved sideways to complete another small daily doji candlestick.
Both Elliott wave counts remain valid. The S&P is today giving conflicting signals from volume, On Balance Volume, and VIX.
Summary: On Balance Volume today is giving a bearish signal and VIX is giving a bullish signal. The signal from OBV is judged to be slightly stronger; lately, it has been more reliable. A new high above 2,193.42 would indicate a third wave up is underway, target 2,230. A new alternate wave count has a good probability and expects a little more downwards movement. If price moves below 2,168.50, then expect more downwards movement to a target at 2,152 but not below 2,111.05.
Last monthly chart for the main wave count is here.
New updates to this analysis are in bold.
MAIN WAVE COUNT
WEEKLY CHART
Click chart to enlarge.
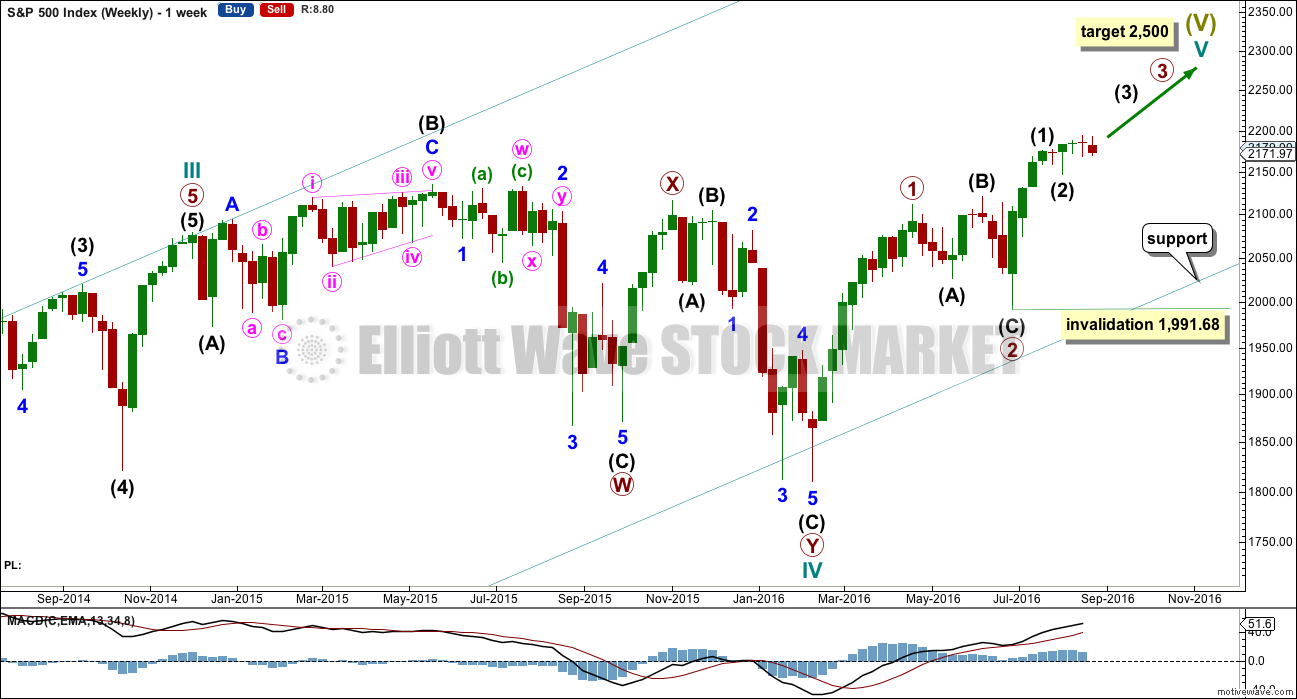
Cycle wave II was a shallow 0.41 zigzag lasting three months. Cycle wave IV is seen as a more shallow 0.28 double combination lasting 15 months. With cycle wave IV five times the duration of cycle wave II, it should be over there.
Cycle wave I lasted 28 months (not a Fibonacci number), cycle wave II lasted a Fibonacci 3 months, cycle wave III lasted 38 months (not a Fibonacci number), and cycle wave IV lasted 15 months (two more than a Fibonacci 13).
If the target for cycle wave V is for it to be equal in length with cycle wave I, then it may also be expected to be about equal in duration. So far cycle wave V is in its sixth month. After this month, a further 22 months to total 28 seems a reasonable expectation, or possibly a further 15 months to total a Fibonacci 21.
This first weekly wave count expects the more common structure of an impulse is unfolding for cycle wave V. Within cycle wave V, primary waves 1 and now 2 should be over. Within primary wave 3, no second wave correction may move beyond its start below 1,991.68. If price makes a new high above 2,203.68, then that would provide enough confidence that intermediate wave (2) should be over to move the invalidation point on the weekly chart up to 2,147.58.
There is one other possible structure for cycle wave V, an ending diagonal. This alternate will still be charted and considered, but will not be published at this time. A new alternate that has a higher probability will be published.
DAILY CHART
Click chart to enlarge.
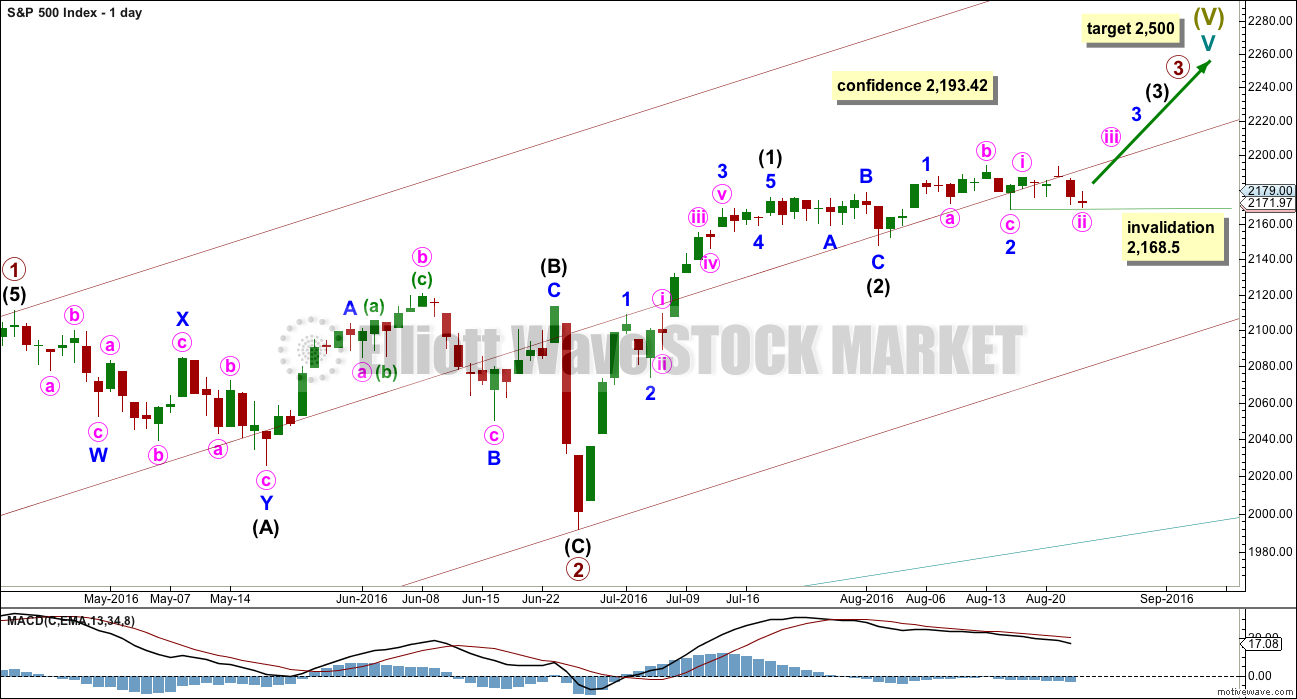
Primary wave 2 is complete as a shallow regular flat correction. Primary wave 3 is underway.
Within primary wave 3, intermediate wave (1) is a complete impulse. Intermediate wave (2) may now be a complete flat correction.
Within intermediate wave (3), minor waves 1 and 2 should be complete. Within minor wave 3, if minute wave ii moves any lower, it may not now move below the start of minute wave i at 2,168.50.
Add a mid line to the base channel drawn about primary waves 1 and 2. Draw this channel from the start of primary wave 1 (seen on the weekly chart) to the end of primary wave 2, then place a parallel copy on the end of primary wave 1. The mid line is not providing support now, price is below it. It may provide some resistance if price turns up from here.
At this stage, it looks most likely that intermediate wave (3) has begun for this wave count. It should be expected to show the subdivisions of minor waves 2 and 4 clearly on the daily chart with one to a few red daily candlesticks or doji. With minor wave 2 now showing as two red candlesticks, one doji and a green candlestick with a long lower wick, this wave count so far has a typical look. Within minor wave 3, it would also be normal to see the subdivisions of minute waves ii and iv. So far minute wave ii is showing up clearly and the proportion is still good. Minute wave ii does not last as long as minor wave 2.
HOURLY CHART

Click chart to enlarge.
Minute wave ii fits as an expanded flat that should now be complete. Within minute wave ii, minuette wave a is a three, minuette wave b is a three, and the triangle is subminuette wave b within minuette wave b. Minute wave b is a 1.63 length of minute wave a. This is longer than the common length of up to 1.38, but within allowable convention of up to 2.
There is no Fibonacci ratio between minute waves a and c.
Short and mid term targets remain the same for this wave count. At 2,230 minor wave 3 would reach 1.618 the length of minor wave 1.
At 2,332 intermediate wave (3) would reach equality in length with intermediate wave (1). If price gets to the first target and the structure is incomplete, or if price keeps rising through this first target, then the second target would be used. At 2,445 intermediate wave (3) would reach 1.618 the length of intermediate wave (1).
Minute wave ii may not move beyond the start of minute wave i below 2,168.50. There is almost no room left for price to move lower for this wave count. If this wave count is invalidated with a new low below 2,168.50, then it will be discarded. At that stage, the alternate would be the only wave count published.
This wave count expects to see an increase in upwards momentum, which should be supported by stronger volume.
ALTERNATE WAVE COUNT
WEEKLY CHART
Click chart to enlarge.
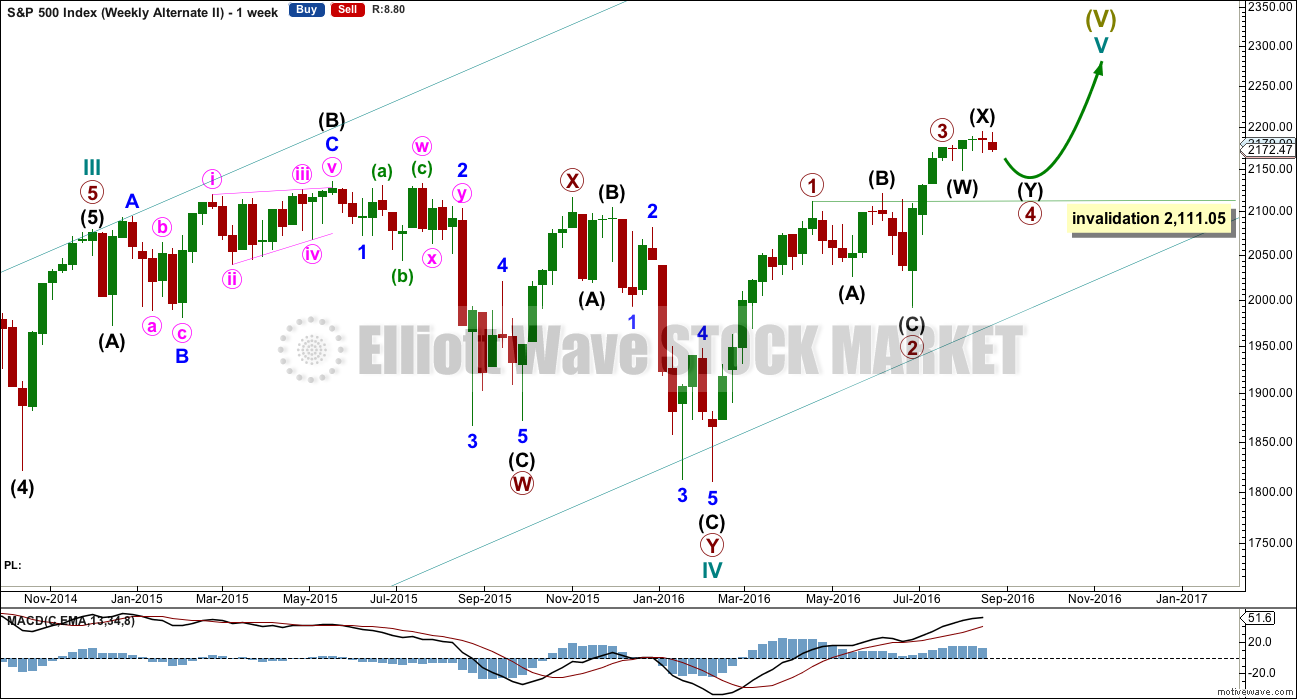
This alternate has a good probability. Overall, it has the right look and explains sideways movement for the last few weeks nicely. The probability is about even with the main wave count at this stage, in my judgment. If this alternate is correct, then it should be confirmed within the next day or so.
If the degree of labelling within primary wave 3 is simply moved up one degree, then it is possible that primary wave 3 is over. Primary wave 3 may have been 2.04 points short of 0.618 the length of primary wave 1. With primary wave 3 shorter than primary wave 1, the upcoming length of primary wave 5 is limited to no longer than equality with primary wave 3 at 183.95 points, so that the core rule stating a third wave may not be the shortest is met. Primary wave 5 should also be weaker than primary wave 3, so that primary wave 3 is not the weakest wave.
Current sideways movement may be primary wave 4. When primary wave 4 is complete, then a final target for primary wave 5 may be calculated. That cannot be done yet. The target for the main wave count at 2,500 would be far too high.
Primary wave 2 fits as an expanded flat. Primary wave 4 may be a double combination exhibiting some alternation in structure with primary wave 3.
Primary wave 4 may not move into primary wave 1 price territory below 2,111.05.
DAILY CHART
Click chart to enlarge.
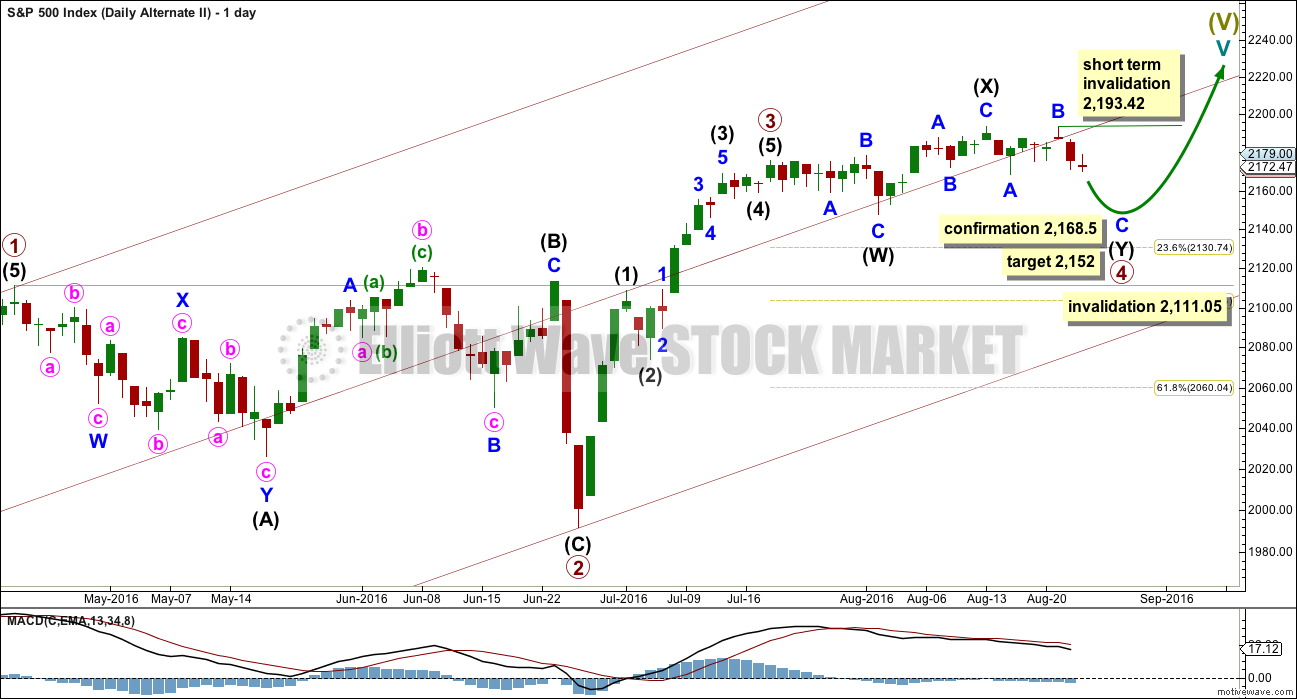
Primary wave 2 was a shallow 0.40 expanded flat correction lasting 47 days. Primary wave 4 may be unfolding as a more shallow double combination that has so far lasted 26 days. The structure is incomplete.
Within primary wave 4, the first structure in the double is an expanded flat labelled intermediate wave (W). The double is joined by a three, a zigzag in the opposite direction, labelled intermediate wave (X). There is no maximum limit for X waves. They may make new price extremes beyond the start of wave W in the same way that B waves within flats may do.
The second structure in the double would be a zigzag labelled intermediate wave (Y).
A new low now below 2,168.50 should be taken as invalidation of the main wave count and confirmation of this alternate. At that stage, expect more downwards movement.
At 2,152 minor wave C would reach 1.618 the length of minor wave A.
Within minor wave C, no second wave correction may move beyond the start of its first wave above 2,193.42.
HOURLY CHART

Click chart to enlarge.
Minor wave C must subdivide as a five wave structure. There is more than one way to see downwards movement from the high at 2,193.42. This labelling and the labelling on the main wave count hourly chart both work for this wave count.
If only minute wave i is complete, then minute wave ii may either be over at today’s high or may continue higher as an expanded flat correction. Minute wave ii may not move beyond the start of minute wave i above 2,193.42. If it does move higher, then a reasonable target for it would be the 0.618 Fibonacci ratio about 2,185.
When minute waves i through to iv are complete within minor wave C, then the target may be calculated at two wave degrees. At that stage, the target at 2,152 may change or widen to a small zone.
The final target at 2,152 would see intermediate wave (Y) end slightly above the end of intermediate wave (W) at 2,147.58. If the target at 2,152 is wrong, it may be a little too high. The whole structure of the combination should take up time and move price sideways.
TECHNICAL ANALYSIS
WEEKLY CHART
Click chart to enlarge. Chart courtesy of StockCharts.com.
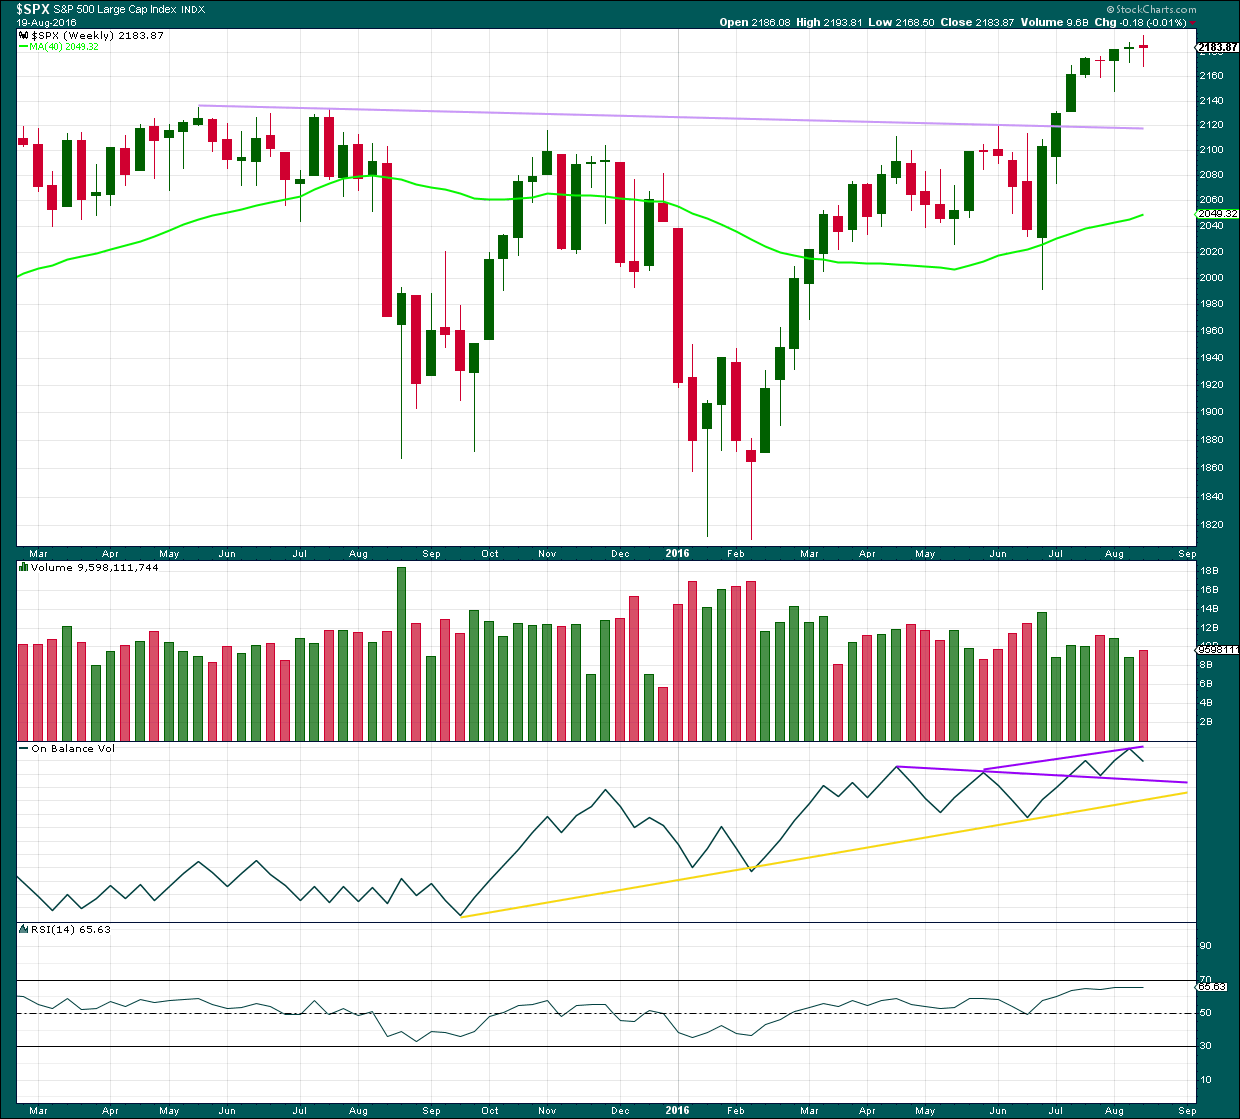
Last week completes another doji candlestick, this time with a slightly wider range than the week before. Overall, this doji represents a balance between bulls and bears with the bears very slightly stronger to complete a red candlestick. A slight increase in volume is slightly bearish, but in this instance because the candelstick is a doji we should look inside at the daily volume bars for a clearer picture.
On Balance Volume remains bullish while it is above the longer purple trend line. A new trend line is added. A break above this shorter and steeper line would be another bullish signal.
RSI is still not extreme. There is room for price to rise further.
DAILY CHART

Click chart to enlarge. Chart courtesy of StockCharts.com.
Price has broken below the short term light blue trend line and now moved up for a throw back to test resistance at the line.
Three days in a row of downwards movement to print red daily candlesticks comes with slightly increasing volume for each day. There is some support for this fall in price, although volume remains lighter than prior upwards days.
ADX has indicated a potential trend change from up to down. If the black ADX line again increases, it would be indicating a downwards trend in place.
ATR is still overall declining to flat disagreeing with ADX. If this is a downwards trend, then at this stage it looks like a smaller trend within a larger consolidation.
On Balance Volume is today giving a bearish signal with a break below the lower yellow support line. Trend lines often (not always) work well with OBV. This signal supports the alternate wave count over the main wave count. Even though recently OBV did not work for a bullish signal with a break above the purple line, it may still work for a bearish signal here. This signal is given reasonable weight in today’s analysis.
RSI is neutral. There is room for price to rise or fall.
Stochastics is not yet oversold. With price range bound, a continuation of a downwards swing here to end only when price finds support and Stochastics reaches oversold should be expected. Price may find support about 2,155.
Bollinger Bands remain tightly contracted. The market is not trending at this time.
VOLATILITY – INVERTED VIX CHART
Click chart to enlarge. Chart courtesy of StockCharts.com.
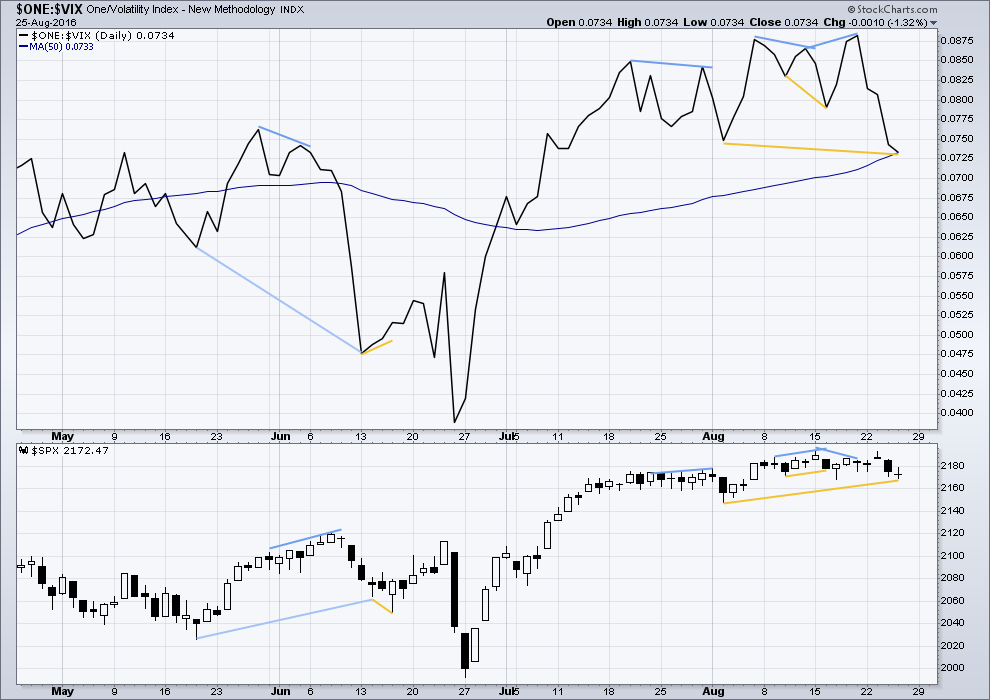
Volatility is declining as price is rising. This is normal for an upwards trend.
There are a few instances of multi day divergence between price and inverted VIX noted here. Bearish divergence is blue. Bullish divergence is yellow. Each of these instances was followed by expected price movement if only for two days. Divergence with VIX and price is not always working, but it is still sometimes working. So it will be noted.
It appears so far that divergence between inverted VIX and price is again working to indicate short term movements spanning one or two days.
There is today a slightly longer term divergence noted between VIX and price: VIX made a new low below the prior low of 2nd of August but price has made a higher low. This is hidden bullish divergence and indicates weakness in price. This signal contradicts the bearish signal given by On Balance Volume.
It will be my judgement that on balance the signal from On Balance Volume is likely to be stronger than this signal from VIX.
BREADTH – AD LINE
Click chart to enlarge. Chart courtesy of StockCharts.com.
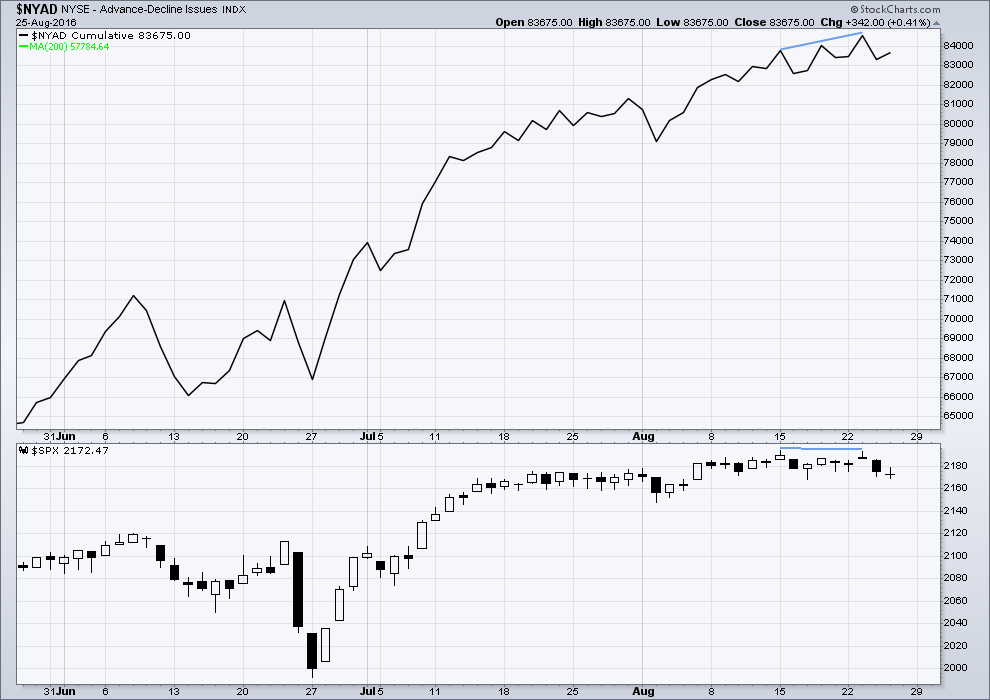
There is support from market breadth as price is rising.
There is a slightly longer term hidden bearish divergence between price and the AD line (blue lines). The AD line made a new high above the prior high of 15th of August, but price made a slightly lower high. This indicates some weakness in price. So far this divergence has been followed by two days of downwards movement, so as a bearish indicator it was accurate. It may yet be followed by more downwards movement, or not. Unfortunately, this divergence makes no comment on by how much or for how long price may subsequently move.
DOW THEORY
Major lows within the prior bull market:
DJIA: 15,855.12 (15th October, 2014) – closed below on 25th August, 2015.
DJT: 7,700.49 (12th October, 2014) – closed below on 24th August, 2015.
S&P500: 1,821.61 (15th October, 2014) – has not closed below this point yet.
Nasdaq: 4,117.84 (15th October, 2014) – has not closed below this point yet.
Major highs within the new bear market:
DJIA: 17,977.85 (4th November, 2015) – closed above on 18th April, 2016.
DJT: 8,358.20 (20th November, 2015) – has not closed above this point yet.
S&P500: 2,116.48 (3rd November, 2015) – closed above this point on 8th June, 2016.
Nasdaq: 5,176.77 (2nd December, 2015) – closed above this point on 1st August, 2016.
Dow Theory Conclusion: Original Dow Theory still sees price in a bear market because the transportations have failed to confirm an end to that bear market. Modified Dow Theory (adding S&P and Nasdaq) has failed still to confirm an end to the old bull market, modified Dow Theory sees price still in a bull market.
This analysis is published @ 08:46 p.m. EST.
Nice to see we have just one wave count today. And I am hugely thankful to Peter R again for pointing out the idea.
It does have a better fit with the weakness we are seeing in this market.
Now for the short term situation… Minor C must be a five. So far minute i and ii are complete. Minute iii isn’t complete because it has not moved far enough below the end of minute i to allow room for a subsequent minute iv to unfold and remain below minute i territory.
Crikey. I hope that all makes sense!
I’m adding a base channel about minute i and ii. Now that it’s been breached the lower edge may provide resistance. Short term target for minute iii = 1.618 X minute i at 2,150.
The final target at 2,152 is removed for now. When minute iii and iv are complete then I’ll calculate the final target at two degrees. 2,152 looks like it may be a bit too high.
Yes ma’am. I sure hope you are having a wonderful day Lara! 🙂
Futures ought to be interesting Sunday evening. Hope everyone is properly hedged. Have a fabulous week-end everyone; many thanks to Peter for the new wave count, and Russell for the stimulating conversation! Bye all! 🙂
Is anyone else seeing these monstrous candles on the 5 and 15 minute charts? I’m talking about 100 point spikes down in DJI that ends up being one giant green candle!
I’m seeing some pretty big candles of DJI 5 min chart, about 60 points.
Impulse down completed on the 15 minute chart. Now let’s see what the banksters have left in the tank…. 🙂
If the alternate count is right, I think we need a fourth wave now at minute degree, and one more wave down to complete C of Y of Primary 4.
Yep!
Can’t be a fourth wave (just crossed minute 1), so maybe overlapping 1st and 2nd waves, in which case we have quite a ways to go on the down side as we wait for a third of third of C of Y. We’ll have to see how this unfolds next week
Starting to look a bit deep for a fourth wave; could be a second….
UVXY BBs are STILL compressed. Not even a hint of expansion. Talk about mid-term complacency…!!!
Speaking of the bond market, interest rates and investing erudition, Porter Stansberry has been asserting that the place where very serious money will be made in the coming crisis is in corporate bonds. When I first started reading about what he was advocating I thought he had completely lost his mind. There is however a method to his madness and although his new service is crazy expensive, I am actually thinking about giving it a try.
Here’s the thesis:
Of course there is going to be massive corporate bond failure as rates go through the roof because of cascading defaults. The trick is going to be finding the babies thrown out with the bathwater as it were. Many of the companies issuing massive bond floats are going to simply default and go out of business. Folk who bought those bonds are going to loose hundreds of billions, but here’s the thing, some of them are going to survive the carnage. Porter thinks that the greatest transfer of wealth in our generation will be figuring out which of these distressed bonds issued by companies who survive the carnage, to buy for literally pennies on the dollar. That in a nutshell is the method to the madness. My only question is if that research is worthh five figures! 🙂
Here we go. The question is whether the banksters will be successfull in arresting the waterfall and we have a completed impulse intraday. The BBs say probably not….
Five wave impulse up in VIX…
Robots cutting salad in farms(picking lettuce) in Salinas Ca, to self driving cars/trucks in the not too distant future and all other automation and technological efficiencies are real reasons why inflation, GDP and growth subdued. Yes regulation and other things do affect productivity and growth but the real silent job killer has been technology. And that trend is only accelerating. Next 10 years will be quite telling. Wonder if people here see it the way I do or I am a looney bin silicon valley investor.
Agree Russell and Vern.
On another note, we will have minimum 1 rate hike this year and if we get a strong job number next week, then maybe even September could be back on the table. Financials should benefit
So, it appears the alternate bull is in play with further downside action to 2152. This fits as there is now a higher risk of a rate rise this year. The rest of the world hasn’t had a chance to sell the market to this level, so I suspect this will happen Sunday night into Monday morning EST. I suspect the bottom will be around 1130 EST.
If the VIX breaks above 15, we could have further down to go. But the fact that the SPY is holding above 217 tells me that this is not the real drop and it’s several weeks in the future–as long as we hold it today. I will aim to use this drop as an opportunity to enter the long side (small position). I hope that SPX will pull down to the 2120 area for a strong bounce as I see it as an area of support.
You may be right Russell. The BB compression is very ominous and suggests something bigger may be unfolding. We should have a better sense of what’s going on by the close and what VIX does as well.
One thing I am sure you are not right about -the rate hike is definitely NOT going to happen. I am truly bewildered by why anyone even remotely considers this as a possibility. At the risk of sounding like a broken record, the next FED move is a rate cut. If you paid attention to Yellen’s speech, she also hinted at the possibility of buying other “instruments” as the BOJ is admittedly doing. The only reason the FED is not openly doing this is because it is illegal. Of course legality has never been a constraint on this bunch in the past…
Well, if Clinton can do it, why can’t the Fed?
Anyway, a rate rise may or may not happen…I don’t know and nor do you, though you may have a better idea about it then I. I’m not here to argue on that point. I only see a rate rise as helping the economy in the long run, short run it would probably kill the market. Who knows at this point?
That is a very scary point you bring up about the Fed wanting to buy “instruments”. The semblance of a free market has almost completely disappeared.
Verne and Russell, I love all this friendly and knowledgeable banter! For a greenhorn like myself who’s still paying “tuition”, I find it very informative and enlightening. A nice complement to Lara’s great analyses.
Thanks, Ron, and thanks to you, too, Verne. I have learned a lot from you. I have studied micro and macro economics, but they don’t always work in the market. There are so many variables that I don’t know about. Anyway, always good to have input.
And thanks, Lara. This is not an easy market and nobody knows where it will be. I can’t wait for summer trading to be over.
Glad you find it interesting. And thanks to Russell for the friendly banter. I really enjoy hearing his viewpoint.
You are right none of us knows for sure. I do know what will happen if they do raise rates and the effect is going to be more than just short term as you suggest. The reason I am so certain they are not going to raise is that their own survival depends on avoiding the exact consequences of what would be ushered in by any such rate hike. Therefore, to the extent that I am convinced the FED is not suicidal, to that extent I am confident a rate hike will not happen. Of course, I could be completely wrong! 🙂
Wow, in that case, if one could predict the timeframe with high accuracy, a straddle or strangle option strategy on the index that moves the most would be a high probability way to make money. The problem is knowing the timeframe.
Or we could just wait for the break to happen and then hop on the trend with a stop.
I have spent a lot of time thinking about that inflection point and I have two great fears.
First, that bids will disappear from the market.
Second, that bids will disappear from the market.
Of course I am being quite tongue in cheek but if you think about it, when you cannot get into a trade, or out of it…get my drift?! 🙂
If the degree of BB compresssion we have had means what I think it means, this party is just getting started folks. That was something we have not seen for decades…literally!
It is amazing how little volume there is today. The market is falling with few sellers!
Freakish!!
If you are long this market, I strongly suggest that you hedge your positions…..
Looks like corrective ZZ underway so we go a bit higher…
Freakish candles on the five minute chart. Bucket-loads of cash being dumped into the market the last few days in an attempt to arrest the decline, and even with low selling pressure, we’re breaking to the downside. Is this market about to get away from the erstwhile banksters??!!
Buying next week’s expiration UVXY 20 strike calls @ 2.00 per contract.
Adding to bearish SPY call credit spread….
Adding short positions on the next three wave bounce…
If VIX clears 14 we going South…Beware the compression!! 🙂
Yikes! I stepped away from my computer for 20 minutes and come back to DJI in the red??!!! Uh, Oh…!!! Batten down the hatches maties…!
This arrived in my inbox today. It is something I have been expecting.
“As of October 14, 2016, the Securities Exchange Commission will mandate changes to IRA accounts throughout the U.S. with “Money Market Reform”. These changes appear to be a prelude to forced U.S. Government securities (T-Bonds & T-bills) investments by existing retirement accounts.
The Vanguard Group and TIAA-CREF, who together manages nearly $5 trillion in assets, recently wrote plan holders that their investment options were now limited to investment in U.S. Government securities and all changes will happen by October 14, 2016.
They further stated that during times of extreme market volatility that they can temporarily prevent investors from making withdrawals and impose fees. ”
This is the most ominous thing I have read in quite some time. It is criminal and tyrannical conduct running amuck! Unbelievable!!
We may be closer to a top than we think. 🙁 🙁 🙁
This is crazy. Can you direct me to a place where I can see the statement? I looked on Vanguard’s website, but I couldn’t find anything (I do not have a Vanguard account).
Are you saying that investments in stock will no longer be allowed after October 14th in an IRA account?
This sounds incredibly scary!
The alert came from a newsletter I subscribe to and after I did a bit of checking, it looks like the initial order has specifically to do with money market accounts. I agree with their conclusion that is the “camel’s nose under the tent” syndrome and just the beginning of the government’s telling us how to invest our retirement funds. There was a huge furor during the financial crisis when several money market funds “broke the buck”.
https://institutional.vanguard.com/VGApp/iip/site/institutional/investments/MoneyMarketReform
It looks to me like a fade is developing folks. These compressed BBs remain a huge cautionary tale. If there were going to be a news event coincident break to the upside it would have been the Jackson Hole speech imo. The compression is still intact and so is the implication of a big move. If it is not happening to the upside, there is only one other possibility….holding bearish credit spread…
2180 really should hold, a break of 2176 bearish imo…
Break to the downside from yesterday’s triangle reversed upwards today. The bullish case would be confirmed with a pull back to test triangle lines then on to new highs today…price needs to remain above yesterday’s low…
Any move above 2190 and I will be buying back 219 SPY calls of bearish call 219/220 credit spread….
The moment the market has been breathlessly ( and listlessly) waiting for has arrived. I am curious to know if anyone thinks we will see a big market move today. While Elliotticians do not think news events affect the waves, so far as causation is concerned, it is undeniable that they often co-incide. It is undeniable how often the past few years interim tops have co-incided with FED announcements. EWT of course postulates that social mood is what drives the waves as well as the news and not the other way around. I think the most bearish thing that can happen today is a market pop after the speech that is then faded with a lower close. It would strongly suggest that whatever supposedly bullish news the speech contained was not being bought, so to speak, by the trading and investing crowd. This of course makes perfect sense. It is arguably only the perception of the crowd of the invincibility of the central banksters that accounts for markets trading at these levels in view of the global economic realities. A waning of that confidence would in my view be the most bearish of developments. Have a great trading day!
Hello Vern,
I do agree with you. Just because you show there’s a relationship between two correlated events doesn’t mean it’s a causal one. It’s possible that there is some other variable or factor that is causing the outcome. In maths, this is sometimes referred to as the “third variable” or “missing variable” problem and it’s at the heart of the issue of internal validity of the process…
nice Vern —
1st! 🙂