
Downwards movement invalidated the hourly Elliott wave count when price crossed the near by invalidation point.
The daily Elliott wave count remains valid.
Summary: A new high above 2,193.42 would indicate a third wave up is underway, target 2,230. A new alternate wave count has a good probability and expects a little more downwards movement. If price moves below 2,168.50, then expect more downwards movement to a target at 2,152 but not below 2,111.05.
Last monthly chart for the main wave count is here.
New updates to this analysis are in bold.
MAIN WAVE COUNT
WEEKLY CHART
Click chart to enlarge.
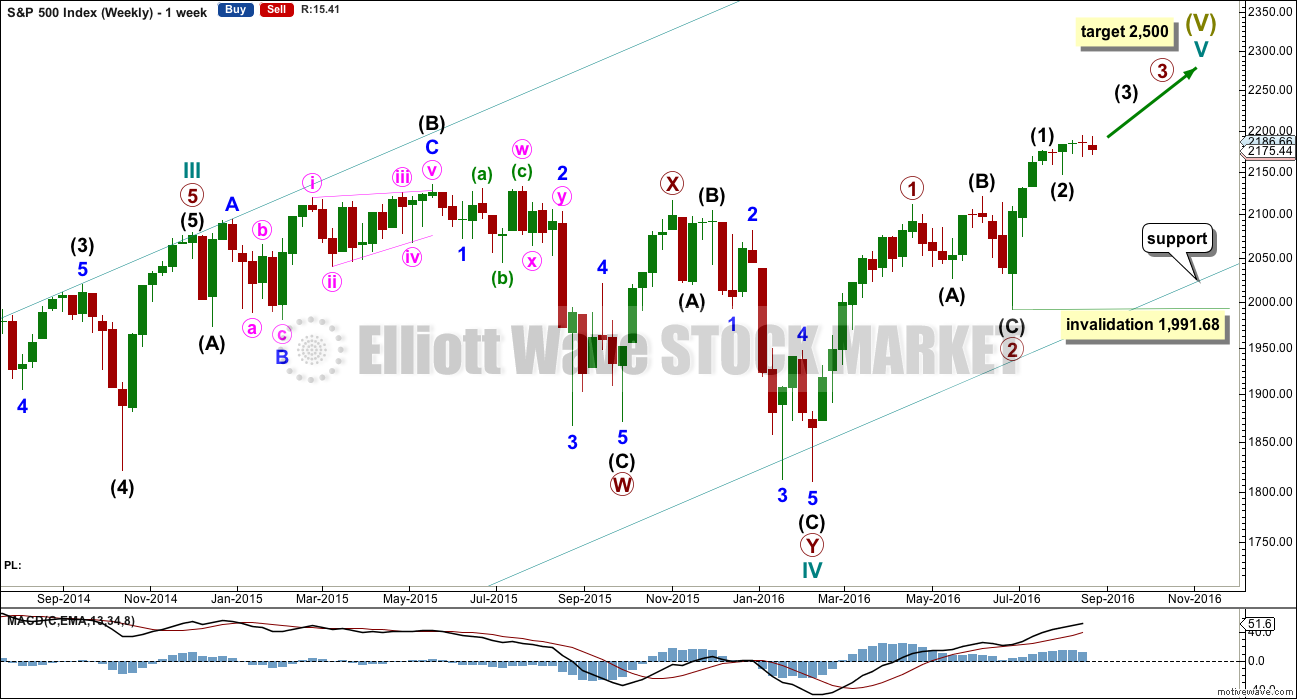
Cycle wave II was a shallow 0.41 zigzag lasting three months. Cycle wave IV is seen as a more shallow 0.28 double combination lasting 15 months. With cycle wave IV five times the duration of cycle wave II, it should be over there.
Cycle wave I lasted 28 months (not a Fibonacci number), cycle wave II lasted a Fibonacci 3 months, cycle wave III lasted 38 months (not a Fibonacci number), and cycle wave IV lasted 15 months (two more than a Fibonacci 13).
If the target for cycle wave V is for it to be equal in length with cycle wave I, then it may also be expected to be about equal in duration. So far cycle wave V is in its sixth month. After this month, a further 22 months to total 28 seems a reasonable expectation, or possibly a further 15 months to total a Fibonacci 21.
This first weekly wave count expects the more common structure of an impulse is unfolding for cycle wave V. Within cycle wave V, primary waves 1 and now 2 should be over. Within primary wave 3, no second wave correction may move beyond its start below 1,991.68. If price makes a new high above 2,203.68, then that would provide enough confidence that intermediate wave (2) should be over to move the invalidation point on the weekly chart up to 2,147.58.
There is one other possible structure for cycle wave V, an ending diagonal. This alternate will still be charted and considered, but will not be published at this time. A new alternate that has a higher probability will be published today.
DAILY CHART
Click chart to enlarge.
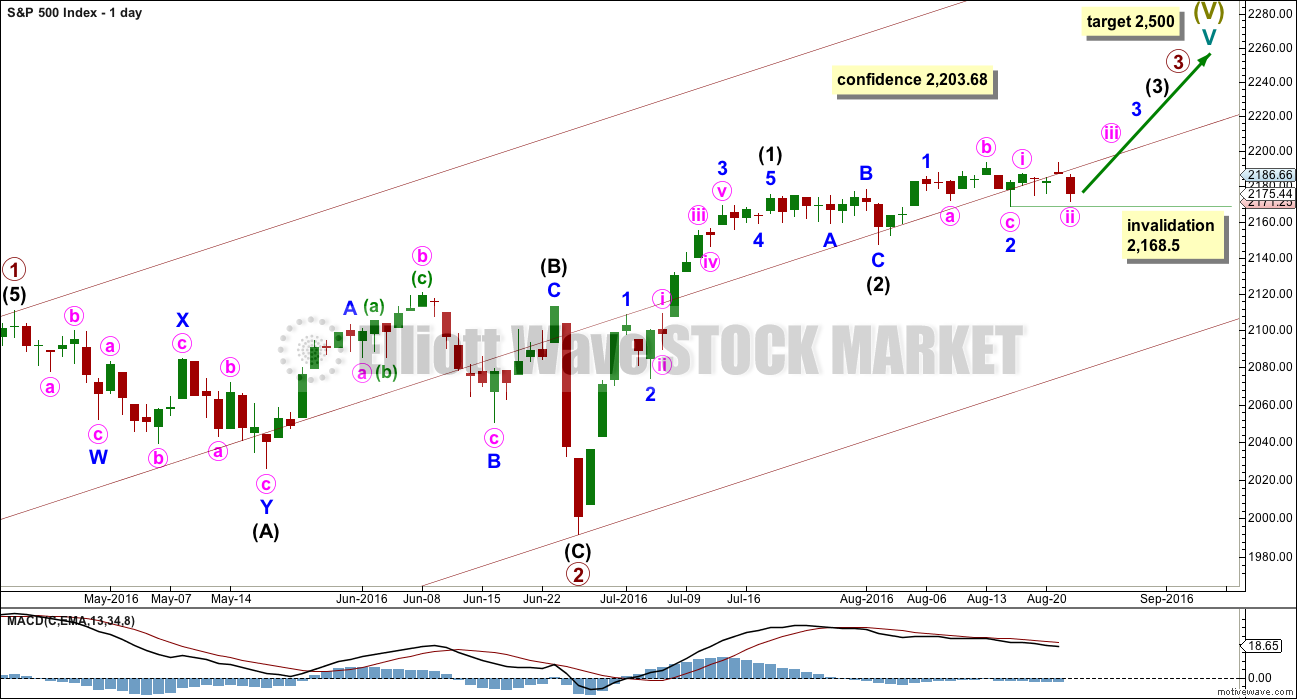
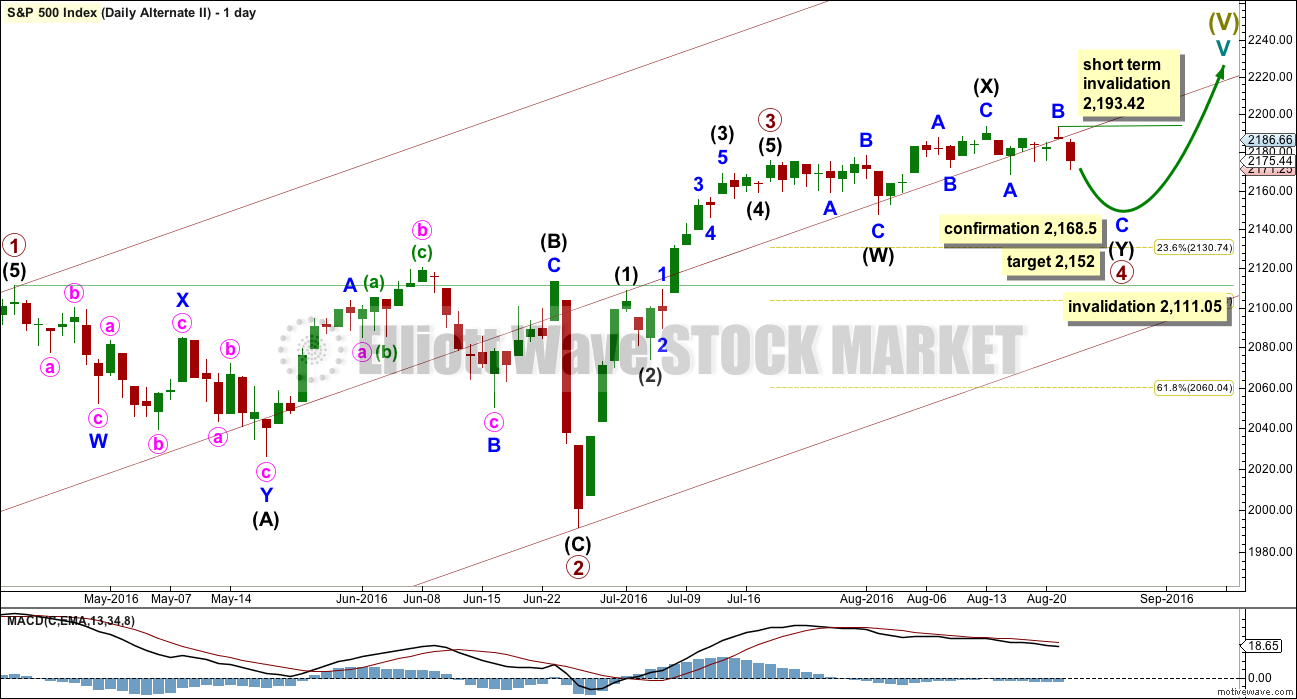
Primary wave 2 is complete as a shallow regular flat correction. Primary wave 3 is underway.
Within primary wave 3, intermediate wave (1) is a complete impulse. Intermediate wave (2) may now be a complete flat correction.
Within intermediate wave (3), minor waves 1 and 2 should be complete. Within minor wave 3, if minute wave ii moves any lower, it may not now move below the start of minute wave i at 2,168.50.
Add a mid line to the base channel drawn about primary waves 1 and 2. Draw this channel from the start of primary wave 1 (seen on the weekly chart) to the end of primary wave 2, then place a parallel copy on the end of primary wave 1. The mid line may provide some support along the way up.
At this stage, it looks most likely that intermediate wave (3) has begun. It should be expected to show the subdivisions of minor waves 2 and 4 clearly on the daily chart with one to a few red daily candlesticks or doji. With minor wave 2 now showing as two red candlesticks, one doji and a green candlestick with a long lower wick, this wave count so far has a typical look.
HOURLY CHART
Click chart to enlarge.
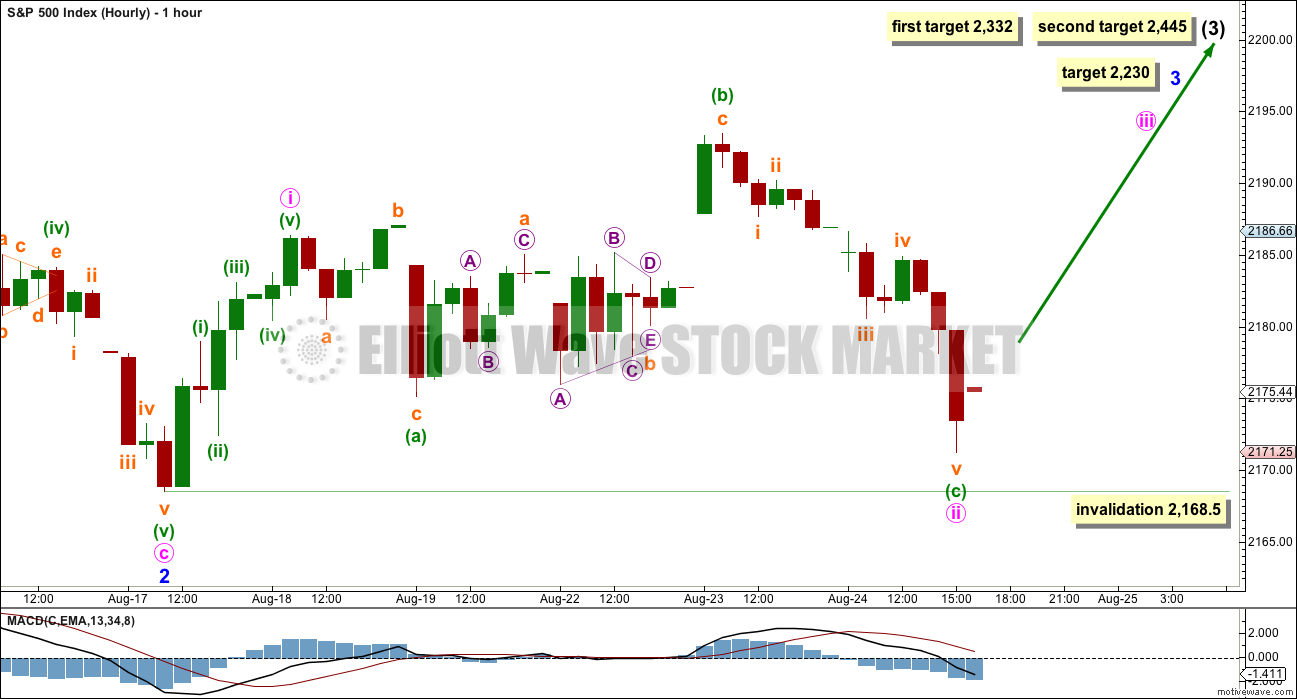
Minute wave ii fits as an expanded flat that should now be complete. Within minute wave ii, minuette wave a is a three, minuette wave b is a three, and the triangle is subminuette wave b within minuette wave b. Minute wave b is a 1.63 length of minute wave a. This is longer than the common length of up to 1.38, but within allowable convention of up to 2.
There is no Fibonacci ratio between minute waves a and c.
Short and mid term targets remain the same for this wave count. At 2,230 minor wave 3 would reach 1.618 the length of minor wave 1.
At 2,332 intermediate wave (3) would reach equality in length with intermediate wave (1). If price gets to the first target and the structure is incomplete, or if price keeps rising through this first target, then the second target would be used. At 2,445 intermediate wave (3) would reach 1.618 the length of intermediate wave (1).
Minute wave ii may not move beyond the start of minute wave i below 2,168.50.
This main wave count expects to see an increase in upwards momentum, which should be supported by stronger volume.
ALTERNATE WAVE COUNT
WEEKLY CHART
Click chart to enlarge.
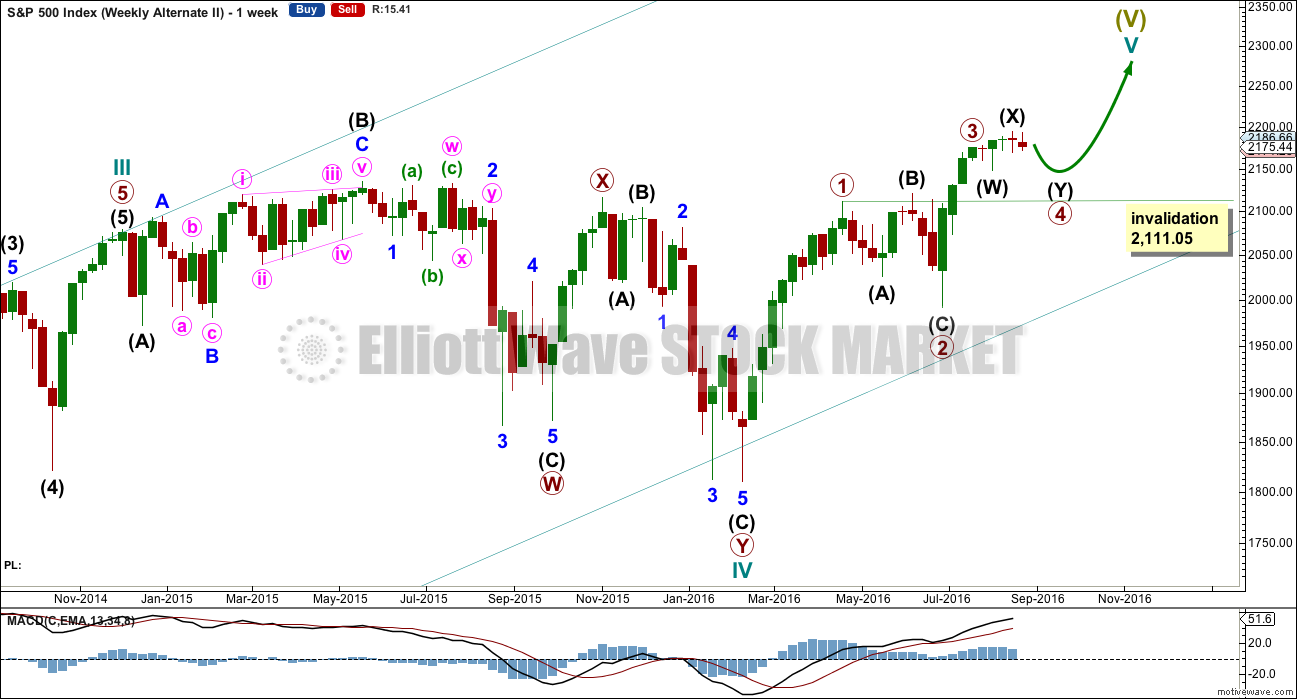
This alternate is new. Thank you to our member Peter R. for pointing out this idea.
This alternate has a good probability. Overall, it has the right look and explains sideways movement for the last few weeks nicely. The probability is about even with the main wave count at this stage, in my judgment. If this alternate is correct, then it should be confirmed within the next day or so.
If the degree of labelling within primary wave 3 is simply moved up one degree, then it is possible that primary wave 3 is over. Primary wave 3 may have been 2.04 points short of 0.618 the length of primary wave 1. With primary wave 3 shorter than primary wave 3, the upcoming length of primary wave 5 is limited to no longer than equality with primary wave 3 at 183.95 points, so that the core rule stating a third wave may not be the shortest is met. Primary wave 5 should also be weaker than primary wave 3, so that primary wave 3 is not the weakest wave.
Current sideways movement may be primary wave 4. When primary wave 4 is complete, then a final target for primary wave 5 may be calculated. That cannot be done yet. The target for the main wave count at 2,500 would be far too high.
Primary wave 2 fits as an expanded flat. Primary wave 4 may be a double combination exhibiting some alternation in structure with primary wave 3.
Primary wave 4 may not move into primary wave 1 price territory below 2,111.05.
DAILY CHART
Click chart to enlarge.
Primary wave 2 was a shallow 0.40 expanded flat correction lasting 47 days. Primary wave 4 may be unfolding as a more shallow double combination that has so far lasted 25 days. The structure is incomplete.
Within primary wave 4, the first structure in the double is an expanded flat labelled intermediate wave (W). The double is joined by a three, a zigzag in the opposite direction, labelled intermediate wave (X). There is no maximum limit for X waves. They may make new price extremes beyond the start of wave W in the same way that B waves within flats may do.
The second structure in the double would be a zigzag labelled intermediate wave (Y).
A new low now below 2,168.50 should be taken as invalidation of the main wave count and confirmation of this alternate. At that stage, expect more downwards movement.
At 2,152 minor wave C would reach 1.618 the length of minor wave A.
Within minor wave C, no second wave correction may move beyond the start of its first wave above 2,193.42.
HOURLY CHART
Click chart to enlarge.
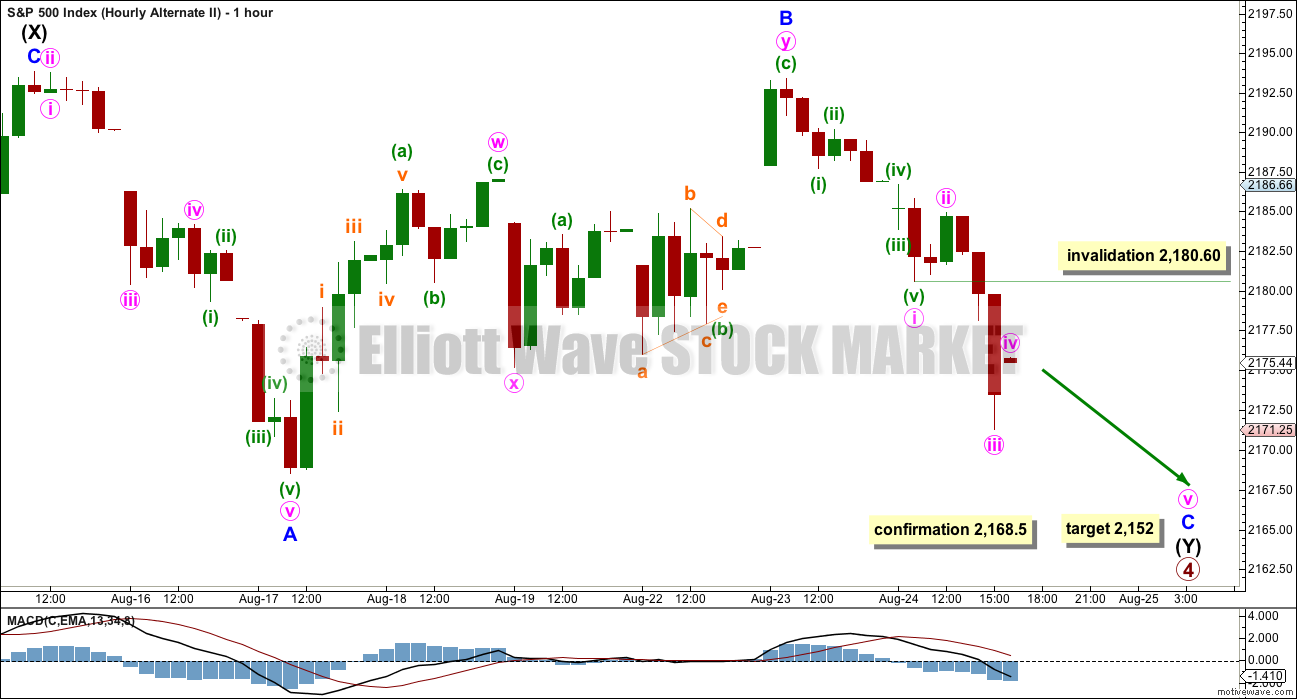
Intermediate wave (Y) fits best as a zigzag because minor wave A downwards fits best as a five and minor wave B ended below the start of minor wave A.
Minor wave C must subdivide as a five wave structure. So far minute waves i and ii may be complete. Minute wave iv may not move into minute wave i price territory above 2,180.60.
The final target at 2,152 would see intermediate wave (Y) end slightly above the end of intermediate wave (W) at 2,147.58. If the target at 2,152 is wrong, it may be a little too high. The whole structure of the combination should take up time and move price sideways.
TECHNICAL ANALYSIS
WEEKLY CHART
Click chart to enlarge. Chart courtesy of StockCharts.com.
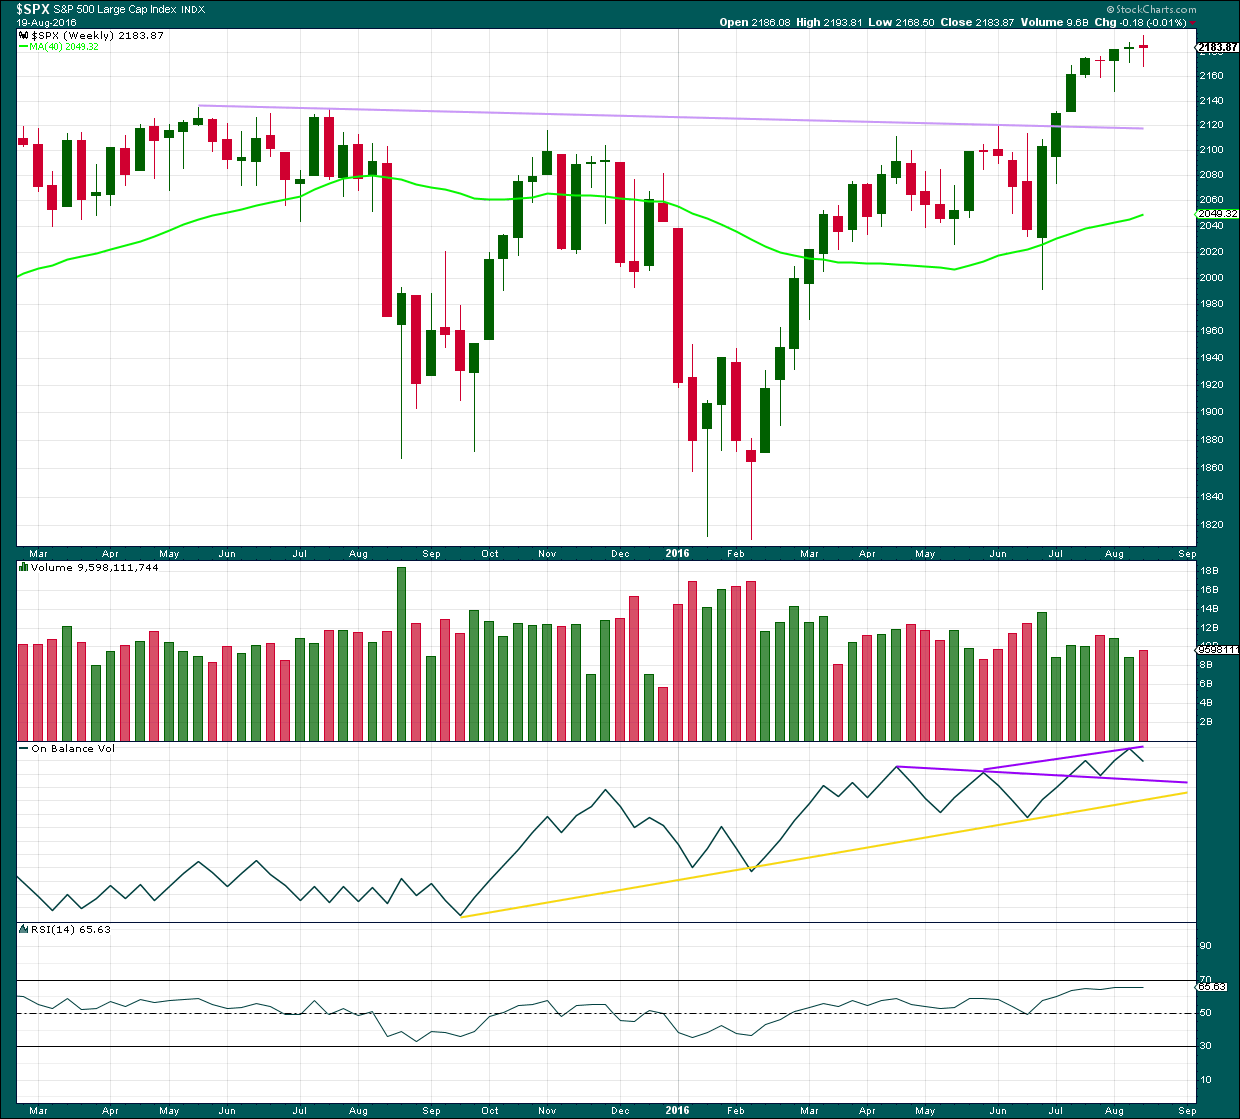
Last week completes another doji candlestick, this time with a slightly wider range than the week before. Overall, this doji represents a balance between bulls and bears with the bears very slightly stronger to complete a red candlestick. A slight increase in volume is slightly bearish, but in this instance because the candelstick is a doji we should look inside at the daily volume bars for a clearer picture.
On Balance Volume remains bullish while it is above the longer purple trend line. A new trend line is added. A break above this shorter and steeper line would be another bullish signal.
RSI is still not extreme. There is room for price to rise further.
DAILY CHART
Click chart to enlarge. Chart courtesy of StockCharts.com.
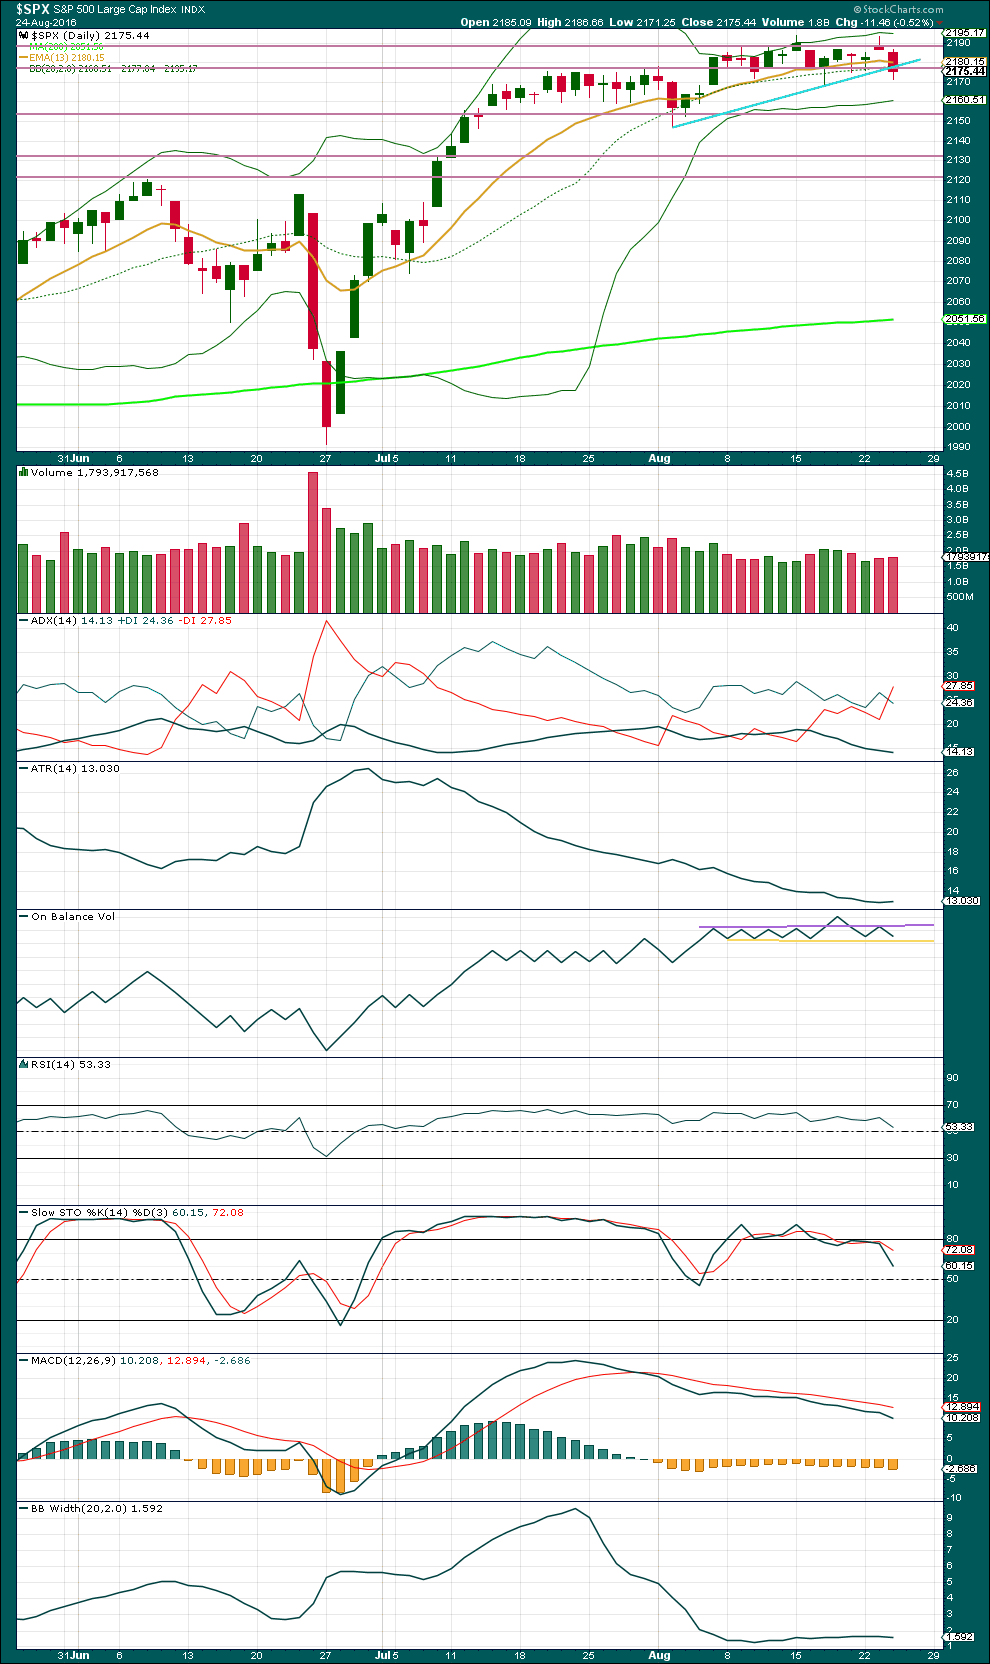
Price has closed just below the short term light blue trend line. This line is no longer offering support.
Two downwards days in a row come with slightly increasing volume. In the short term, the volume profile is slightly bearish. This supports the alternate wave count over the main.
ADX today indicates a possible trend change from up to down, for the first time since 8th of July. At this stage, if the black ADX line turns upwards, then a downwards trend would be indicated. For now the ADX line is still declining, indicating the market is consolidating and not trending.
ATR remains overall flat in agreement with ADX that this market is consolidating.
Bollinger Bands are still tightly contracted, typical of a consolidating market.
RSI is approaching neutral. There is room for price to rise or fall. There is some bullish divergence today between the lows of price and RSI from 16th of August to 24th of August: RSI today made a lower low but price has made a higher low. This divergence is hidden bullish and indicates weakness in price. This favours the main Elliott wave count over the alternate.
Stochastics is returning to neutral from overbought. A range bound trading approach would expect to see a continuation of downwards movement from here until price finds support and Stochastics is oversold at the same time. Price may be expected to find support about 2,145. This approach fits with the alternate wave count.
VOLATILITY – INVERTED VIX CHART
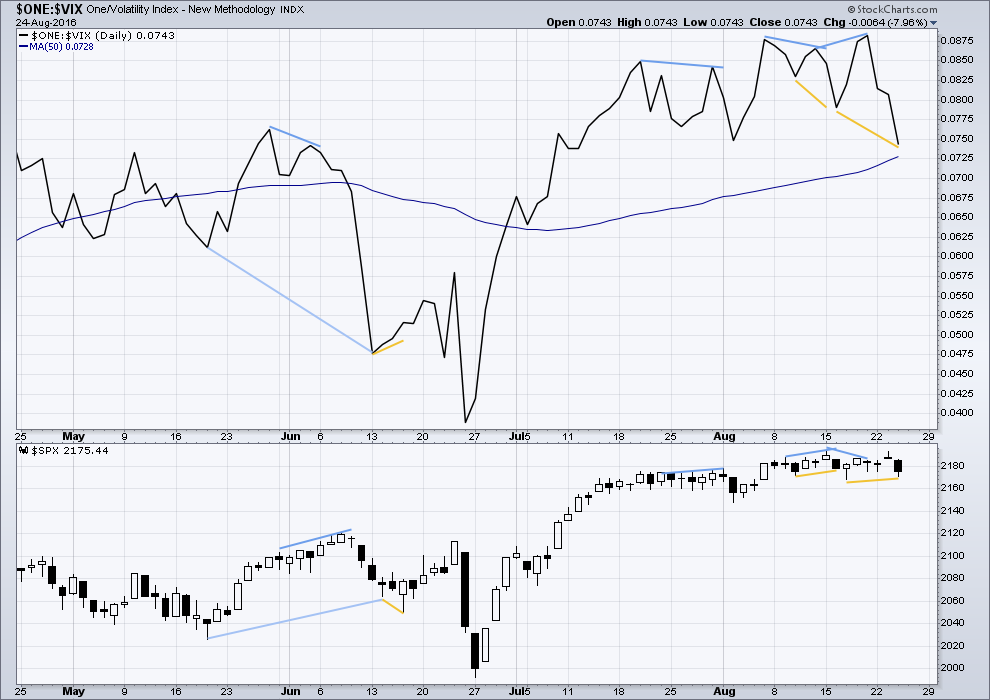
Click chart to enlarge. Chart courtesy of StockCharts.com.
Volatility is declining as price is rising. This is normal for an upwards trend.
There are a few instances of multi day divergence between price and inverted VIX noted here. Bearish divergence is blue. Bullish divergence is yellow. Each of these instances was followed by expected price movement if only for two days. Divergence with VIX and price is not always working, but it is still sometimes working. So it will be noted.
It appears so far that divergence between inverted VIX and price is again working to indicate short term movements spanning one or two days.
There is no divergence noted today between price and inverted VIX. VIX has made a new low below the prior low of 16th of August and price has also made a new low below its low of 16th of August.
BREADTH – AD LINE
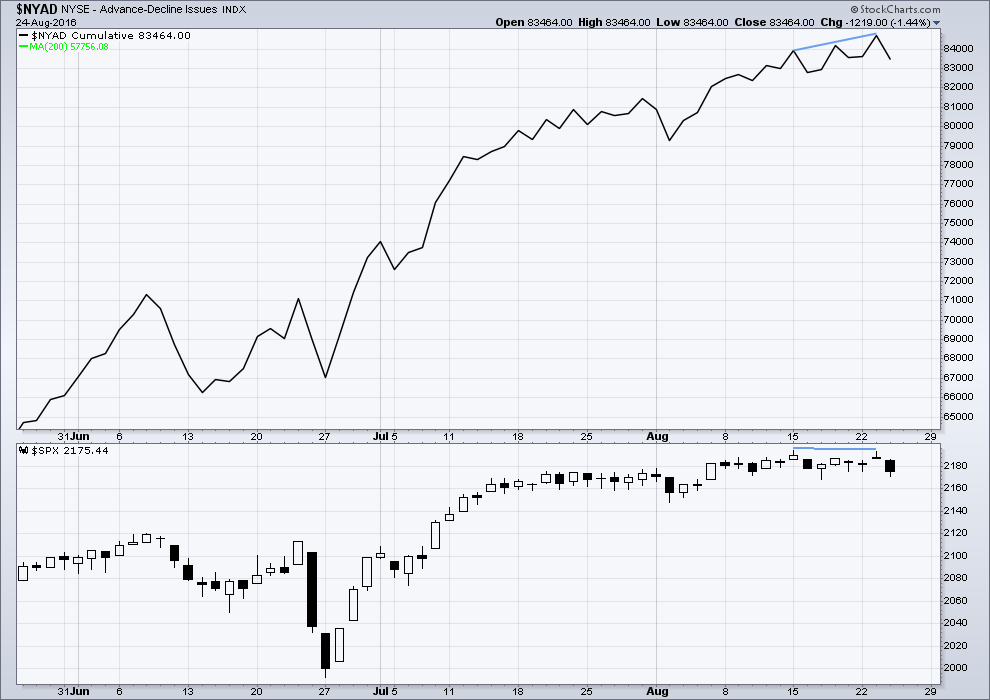
Click chart to enlarge. Chart courtesy of StockCharts.com.
There is support from market breadth as price is rising.
From yesterday, there is a slightly longer term hidden bearish divergence between price and the AD line. The AD line made a new high above the prior high of 15th of August, but price made a slightly lower high. This indicates some weakness in price. So far this divergence has been followed by a day of downwards movement, so as a bearish indicator it was accurate. It may yet be followed by more downwards movement, or not. Unfortunately, this divergence makes no comment on by how much or for how long price may subsequently move.
DOW THEORY
Major lows within the prior bull market:
DJIA: 15,855.12 (15th October, 2014) – closed below on 25th August, 2015.
DJT: 7,700.49 (12th October, 2014) – closed below on 24th August, 2015.
S&P500: 1,821.61 (15th October, 2014) – has not closed below this point yet.
Nasdaq: 4,117.84 (15th October, 2014) – has not closed below this point yet.
Major highs within the new bear market:
DJIA: 17,977.85 (4th November, 2015) – closed above on 18th April, 2016.
DJT: 8,358.20 (20th November, 2015) – has not closed above this point yet.
S&P500: 2,116.48 (3rd November, 2015) – closed above this point on 8th June, 2016.
Nasdaq: 5,176.77 (2nd December, 2015) – closed above this point on 1st August, 2016.
Dow Theory Conclusion: Original Dow Theory still sees price in a bear market because the transportations have failed to confirm an end to that bear market. Modified Dow Theory (adding S&P and Nasdaq) has failed still to confirm an end to the old bull market, modified Dow Theory sees price still in a bull market.
This analysis is published @ 08:33 p.m. EST.
Well, it looks like the banksters have managed to drag out the impulse down until tomorrow’s FED spiel. Hopefully it completes in the am and we get the start of the final wave up. ‘By all! Nitey Nite; Sleep tighty tight! 🙂
Attempts at price manipulation seems to be developing into a larger triangle. Ultimate drop should be harder and deeper…
Break is to the downside. It should complete intra-day…
Selling SPY Sep 2 219/220 bearish call spread
Which way will it break?
Looks to me like another fourth wave triangle developing for minute wave four of the alternate. We will probably get strung along the remainder of the day before it breaks to the downside to complete the possible impulse either by the close for first thing tomorrow. It will be interesting to see if it again breaks to the upside before completing a fifth wave down.
Waiting for move below 2168.60 per analysis. I think the move down will complete intra-day so any trade on the short side will obviously have to be quite nimble. If we get a move below 2168.50, I will be making the most confident trade I have made in many months and here is how I am going to do it. I will be selling the SPY 219/220 bearish call credit spread and the move down to the target of around 2152 should easily provide enough profit to allow exit from the spread cost free, while remaining positioned with the 220 calls for the final wave up.
If you don’t know how to trade credit spreads it is worth taking the effort to learn the basics as they are one of the lowest risk trades you can make. In low volatility environments, there is really no better way to trade the market. A single contract with a one point spread risks only 100.00 per trade and is a good way to get a feel for the trade. Here’s to a final wave up very soon! 🙂
Thanks very much for the lesson there on credit spreads Verne.
I like the sound of low risk.
Most welcome Lara! We traders need all the advantage we can get these days!
The bond market is apparently about to plumb new depths of insanity. Saudi Arabia wants to float an offering in dollars of about 10 billion. The bonds will presumably be collateralized by their oil reserves. Has anyone noticed that oil is a wasting asset, both in terms of the depletion of their stated ( or should I say OVER-stated reserves) and a steep price decline that will likely continue in clearly slowing global demand growth?
Who, in their right minds, are going to buy these bonds???!!
I don’t care how much basis points above T-bills they are yielding.
Then again, by the time the float is lauched, folk may well be willing to pay the Saudis to buy their bonds! Now folks, that is true insanity!
Lara,
Thanks for recognizing me in your analysis last night. Not necessary, but much appreciated. My family got a kick out of it.
Peter
Thanks for the suggestion Peter. I think I can finally see some light at the end of the tunnel with that possible count. Most Elliotticians see us in a final wave up at multiple degrees of trend- some in a minor five of an intermediate five, some a primary one (the ED option), and some a primary three. Most agree that we are in the final inning. As Lara said, the wave four possibility does explain a lot and makes planning trades a lot less uncertain, at least for me.
LOL You’re very welcome.
Thank you again for the great idea! Once I charted it and looked into the subdivisions, it looked really good.
The intense BB compression may also be a cautionary note for at least short term long positions. It is now clear that the upward break-out was a false one. The implication is that since a very strong move is still being indicated by the bands, this move down could be longer and stronger that most folk are expecting…
The new wave count is absolutely fascinating! It requires a primary five that is shorter than primary three and that can certainly be completed by this Fall.
Yes. Yes it could.
First.