
Upwards movement was again expected for Friday’s session.
Price moved overall sideways, the low remaining comfortably above the invalidation point on the hourly Elliott wave chart.
Summary: The trend remains the same, until proven otherwise. Assume the trend is up while price is above 2,147.58. The mid term targets are 2,332 or 2,445. If price makes a new low below 2,147.58, then overall sideways movement for a continuation of a longer consolidation would be expected. At this stage, a deeper pullback looks increasingly unlikely. There is not enough selling pressure which would be required to push price lower.
Last monthly chart for the main wave count is here.
New updates to this analysis are in bold.
MAIN WAVE COUNT
WEEKLY CHART
Click chart to enlarge.
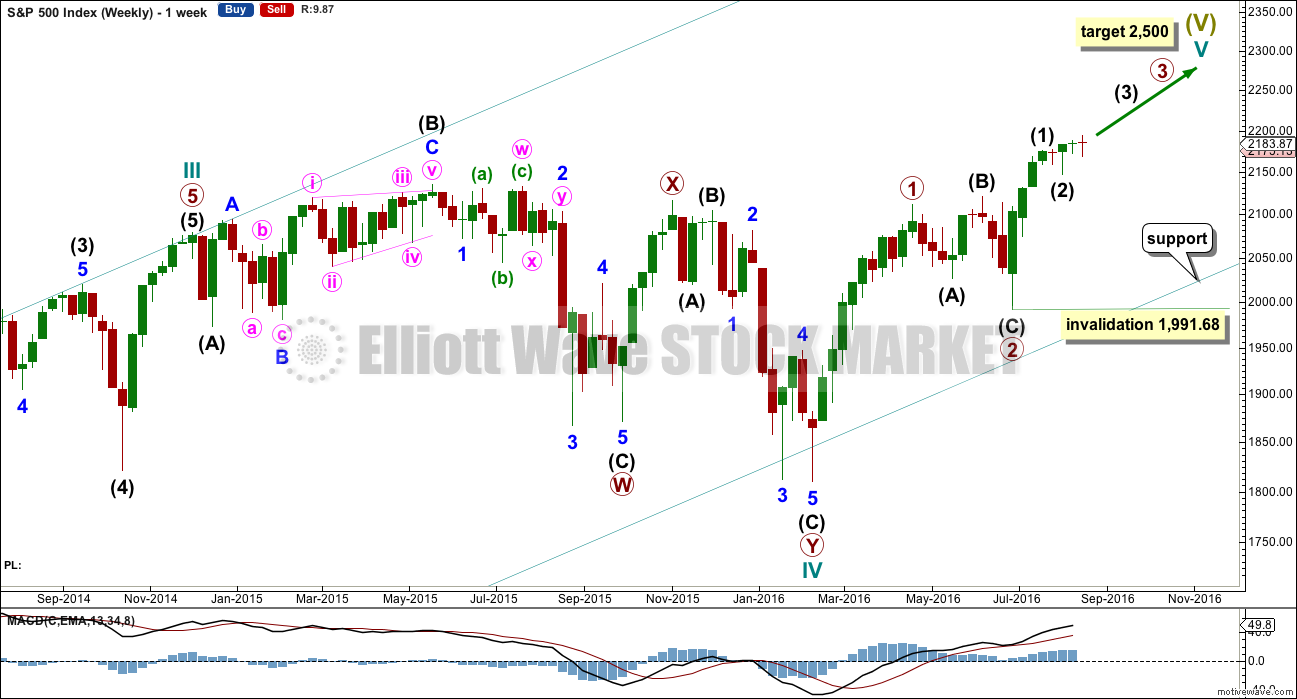
Cycle wave II was a shallow 0.41 zigzag lasting three months. Cycle wave IV is seen as a more shallow 0.28 double combination lasting 15 months. With cycle wave IV five times the duration of cycle wave II, it should be over there.
Cycle wave I lasted 28 months (not a Fibonacci number), cycle wave II lasted a Fibonacci 3 months, cycle wave III lasted 38 months (not a Fibonacci number), and cycle wave IV lasted 15 months (two more than a Fibonacci 13).
If the target for cycle wave V is for it to be equal in length with cycle wave I, then it may also be expected to be about equal in duration. So far cycle wave V is in its sixth month. After this month, a further 22 months to total 28 seems a reasonable expectation, or possibly a further 15 months to total a Fibonacci 21.
This first weekly wave count expects the more common structure of an impulse is unfolding for cycle wave V. Within cycle wave V, primary waves 1 and now 2 should be over. Within primary wave 3, no second wave correction may move beyond its start below 1,991.68. If price makes a new high above 2,203.68, then that would provide enough confidence that intermediate wave (2) should be over to move the invalidation point on the weekly chart up to 2,147.58.
There is one other possible structure for cycle wave V, an ending diagonal. This is covered in an alternate.
DAILY CHART
Click chart to enlarge.
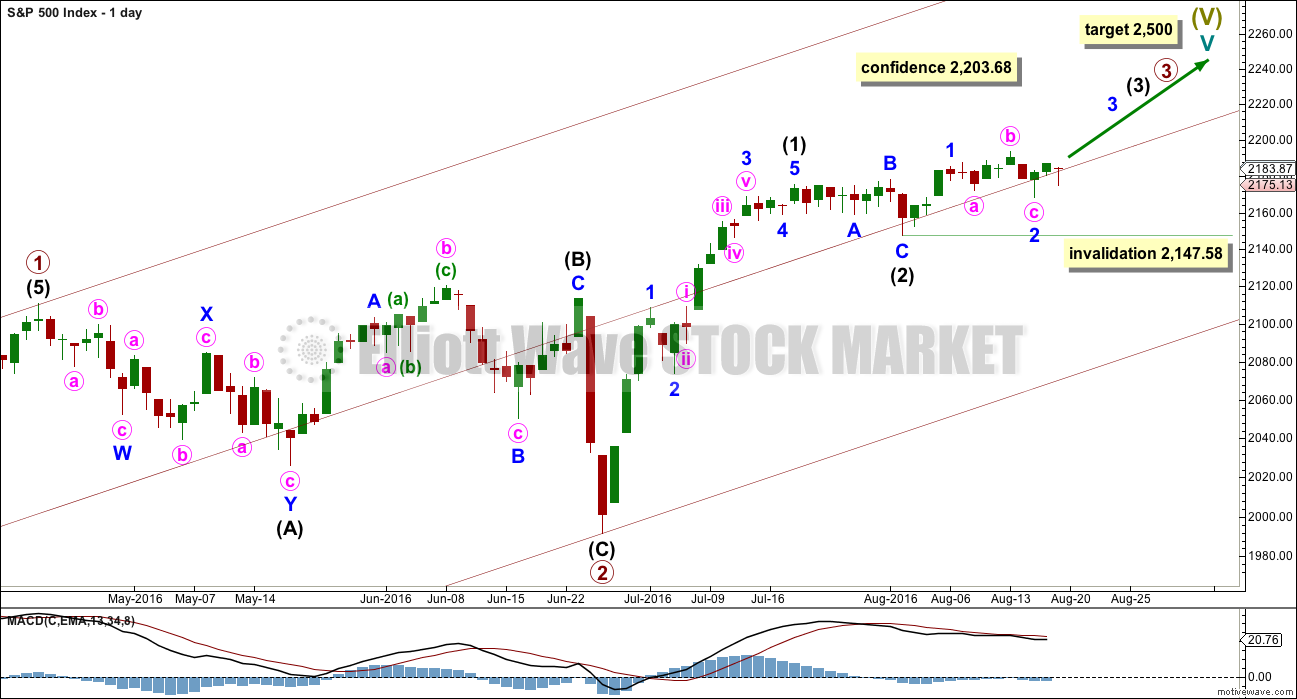
Primary wave 2 is complete as a shallow regular flat correction. Primary wave 3 is underway.
Within primary wave 3, intermediate wave (1) is a complete impulse. Intermediate wave (2) may now be a complete flat correction.
It is still just possible that intermediate wave (2) may not be complete and could continue sideways and a little lower. A deep pullback would not be expected, only a sideways combination, double flat or slightly lower expanded flat would be indicated. If price moves above 2,203.68, then upwards movement from the low at 2,147.58 would be more than twice the length of intermediate wave (2). At that stage, the probability that upwards movement is a B wave within intermediate wave (2) would be so low the idea should be discarded. A new high above 2,203.68 would add confidence in the upwards trend.
If price moves below 2,147.58, then this main wave count would change to see intermediate wave (2) continuing further sideways. The alternate would remain an alternate. The invalidation point would move down to the start of intermediate wave (1).
Within intermediate wave (3), no second wave correction may move beyond its start below 2,147.58.
Add a mid line to the base channel drawn about primary waves 1 and 2. Draw this channel from the start of primary wave 1 (seen on the weekly chart) to the end of primary wave 2, then place a parallel copy on the end of primary wave 1. The mid line may provide some support along the way up.
At this stage, it looks most likely that intermediate wave (3) has begun. It should be expected to show the subdivisions of minor waves 2 and 4 clearly on the daily chart with one to a few red daily candlesticks or doji. With minor wave 2 now showing as two red candlesticks, one doji and a green candlestick with a long lower wick, this wave count so far has a typical look.
HOURLY CHART
Click chart to enlarge.
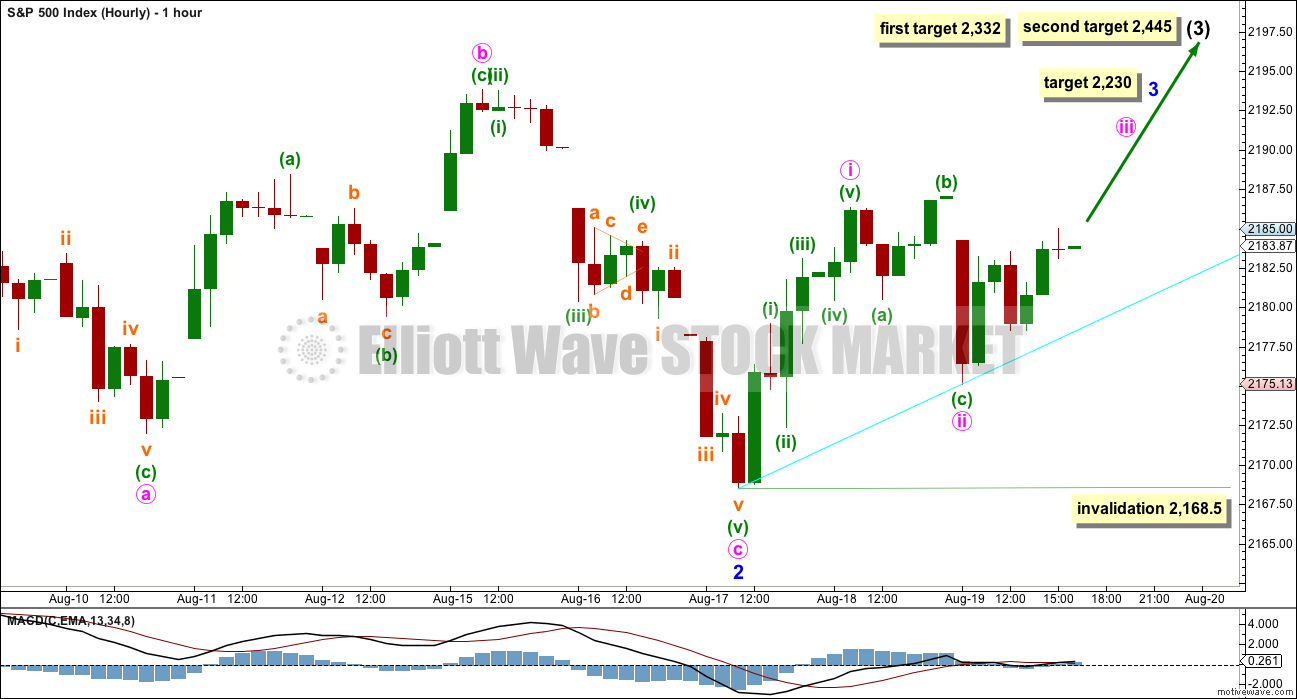
Minor wave 2 now looks to be a complete expanded flat correction. It is relatively shallow at 0.45 the depth of minor wave 1. Minor wave 1 lasted four days and now minor wave 2 has lasted seven days. It is extremely likely to be over here if this wave count is correct.
At 2,230 minor wave 3 would reach 1.618 the length of minor wave 1. This target fits nicely with mid term targets for intermediate wave (3) to end.
Minor wave 3 may only subdivide as an impulse. Within minor wave 3, minute waves i and now ii look likely to be complete. Minute wave ii may not move below the start of minute wave i at 2,168.50.
Minute wave ii is very likely to be complete as an expanded flat correction. There is now a series of three expanded flat corrections in a row: primary wave 2, minor wave 2, and now minute wave ii.
The cyan trend line is redrawn. It may provide some support along the way up. This line is less steep, so it has slightly higher technical significance.
If price begins Monday’s session by moving upwards, then the invalidation point may be moved upwards to the end of minute wave ii.
Mid term targets for intermediate wave (3) remain the same. At 2,332 intermediate wave (3) would reach equality in length with intermediate wave (1). If price keeps rising through this first target, or if when it gets there the structure is incomplete, then the second target would be used. At 2,445 intermediate wave (3) would reach 1.618 the length of intermediate wave (1).
ALTERNATE WAVE COUNT
WEEKLY CHART
Click chart to enlarge.
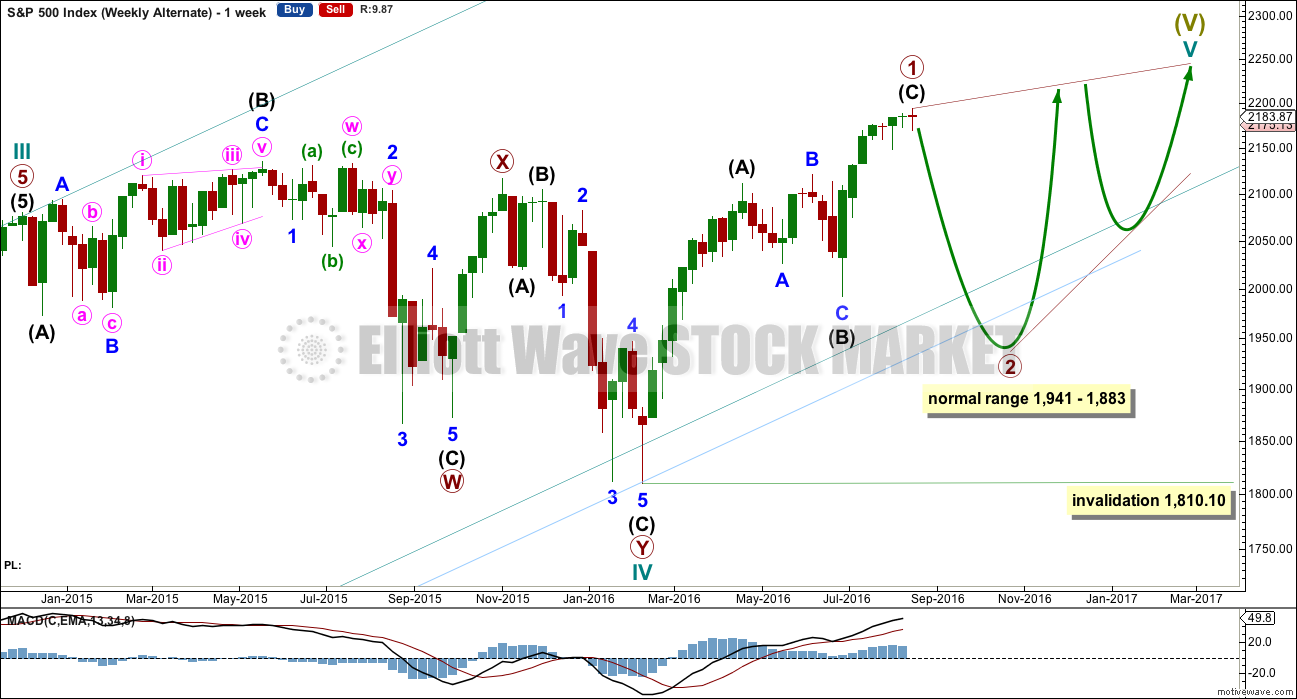
This alternate may diverge from the main wave count.
The other structural possibility for cycle wave V is an ending diagonal. Ending diagonals are more often contracting than expanding, so that is what this alternate will expect.
Ending diagonals require all sub-waves to subdivide as zigzags. Zigzags subdivide 5-3-5. Thus primary wave 1 may now be a complete (or almost complete) zigzag, labelled intermediate waves (A)-(B)-(C) which subdivides 5-3-5.
The normal depth for second and fourth waves of diagonals is from 0.66 to 0.81 the prior actionary wave. Primary wave 2 may end within this range, from 1,941 to 1,883.
Primary wave 2 may not move beyond the start of primary wave 1 below 1,810.10.
When primary wave 2 is a complete zigzag, then another zigzag upwards for primary wave 3 must make a new high above the end of primary wave 1. It would most likely be shorter than primary wave 1 as diagonals are more commonly contracting. If primary wave 3 is longer than primary wave 1, then an expanding diagonal would be indicated.
The psychology of diagonals is quite different to impulses. Diagonals contain corrective characteristics and subdivide as a series of zigzags. When diagonals turn up in fifth wave positions, they take on some of the properties of the correction which inevitably follows them. The deterioration in fundamentals and underlying technicals is more extreme and more evident. There is some support for this idea at this time.
The final target of 2,500 would not be able to be reached by an ending contracting diagonal. The final target for this alternate would be calculated only when primary wave 4 is complete.
The classic pattern equivalent is a rising wedge.
DAILY CHART
Click chart to enlarge.
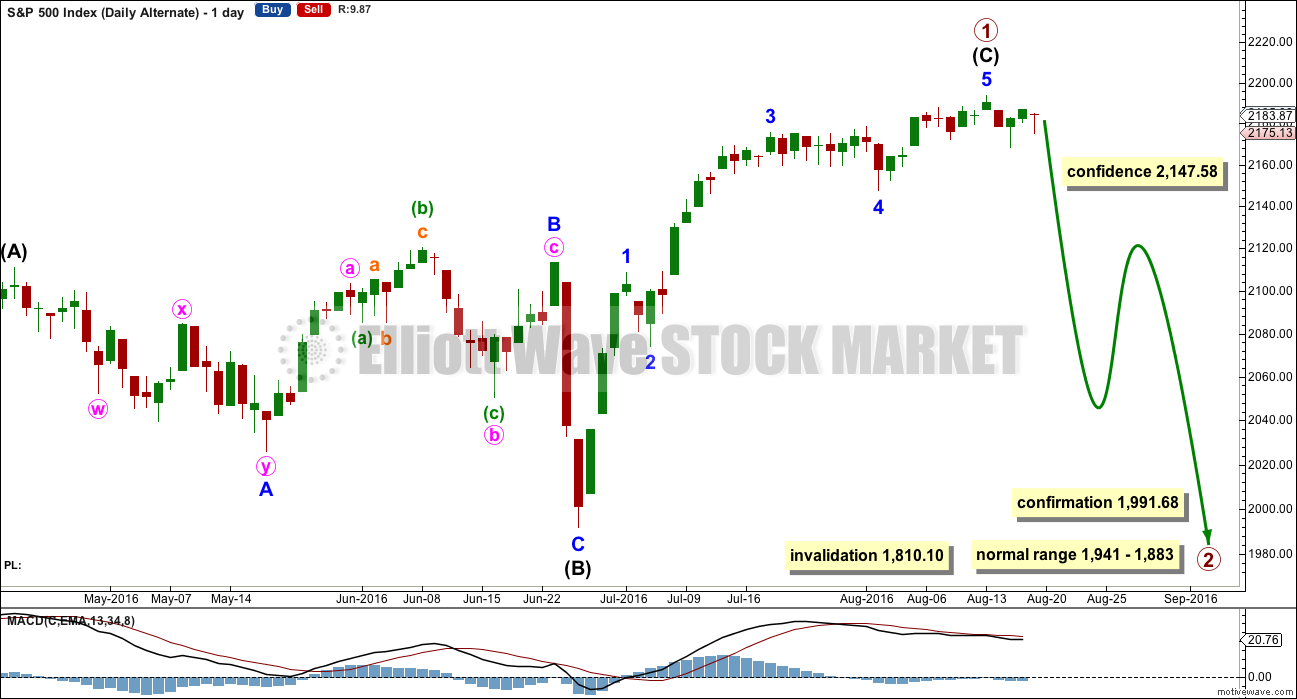
It is possible now that intermediate wave (C) is a complete five wave impulse. However, this wave count suffers from disproportion between minor waves 2 and 4 which gives this possible impulse an odd look. It looks like a three where it should look like a five. However, the S&P just does not always have waves which look right at all time frames.
Because this wave count expects to see a substantial trend change here from bull to bear for a multi week deep pullback, it absolutely requires some indication from price before confidence may be had in it. A new low below 2,147.58 would add confidence.
At this stage, there is not enough selling pressure to support this wave count. When the market has fallen recently, it has fallen of its own weight. For a deep pullback sellers would have to enter the market and be active enough to push price lower. That is not happening at this time.
TECHNICAL ANALYSIS
WEEKLY CHART
Click chart to enlarge. Chart courtesy of StockCharts.com.
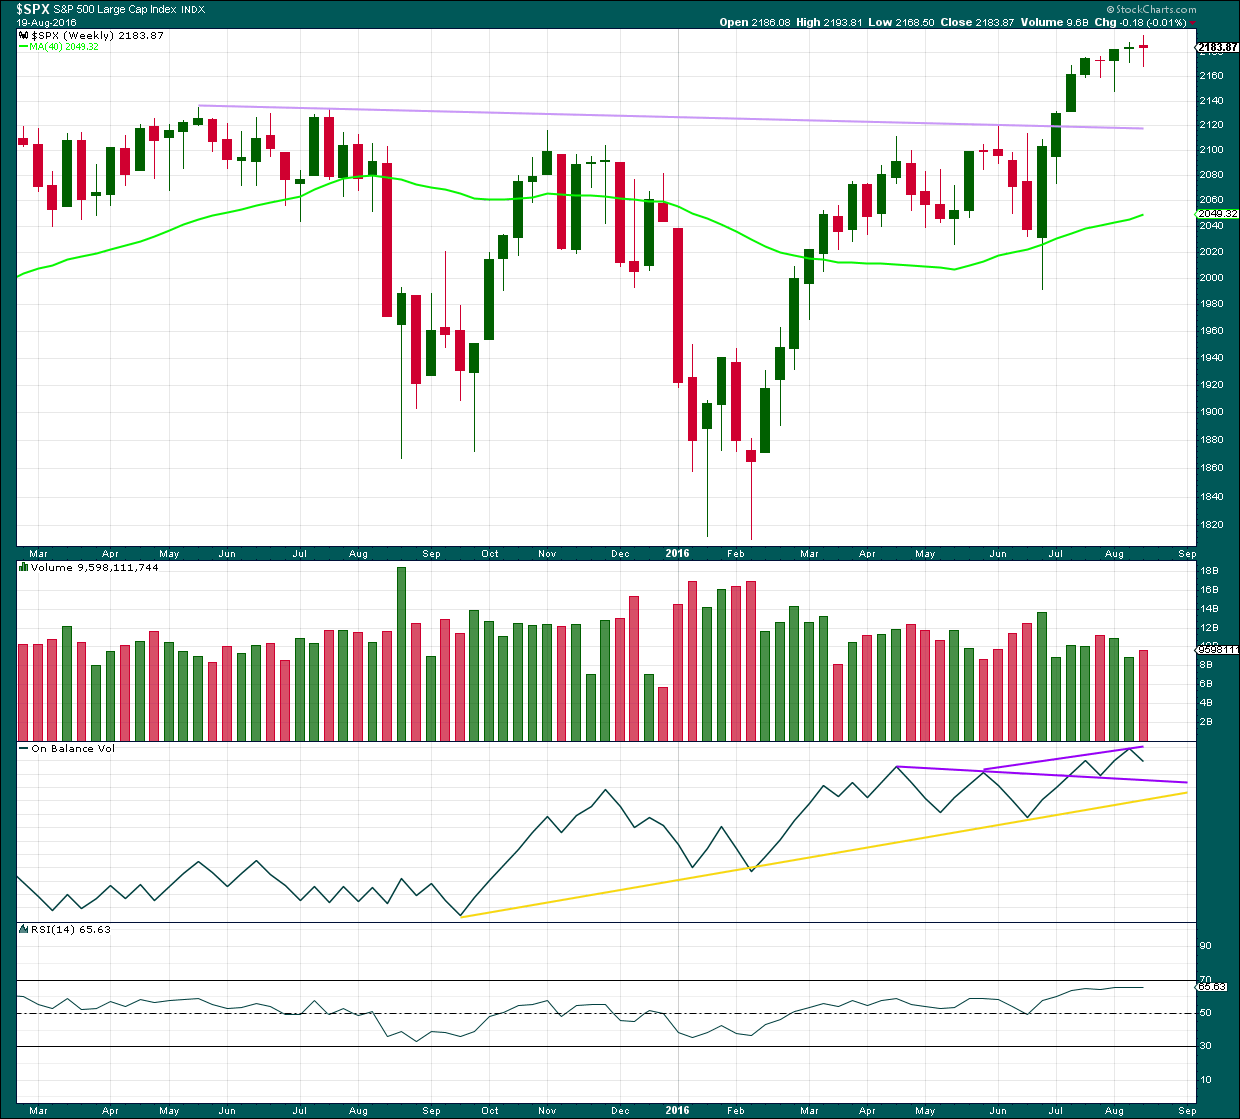
This week completes another doji candlestick, this time with a slightly wider range than last week. Overall, this doji represents a balance between bulls and bears with the bears very slightly stronger to complete a red candlestick. A slight increase in volume is slightly bearish, but in this instance because the candelstick is a doji we should look inside at the daily volume bars for a clearer picture.
On Balance Volume remains bullish while it is above the longer purple trend line. A new trend line is added this week. A break above this shorter and steeper line would be another bullish signal.
RSI is still not extreme. There is room for price to rise further.
DAILY CHART
Click chart to enlarge. Chart courtesy of StockCharts.com.
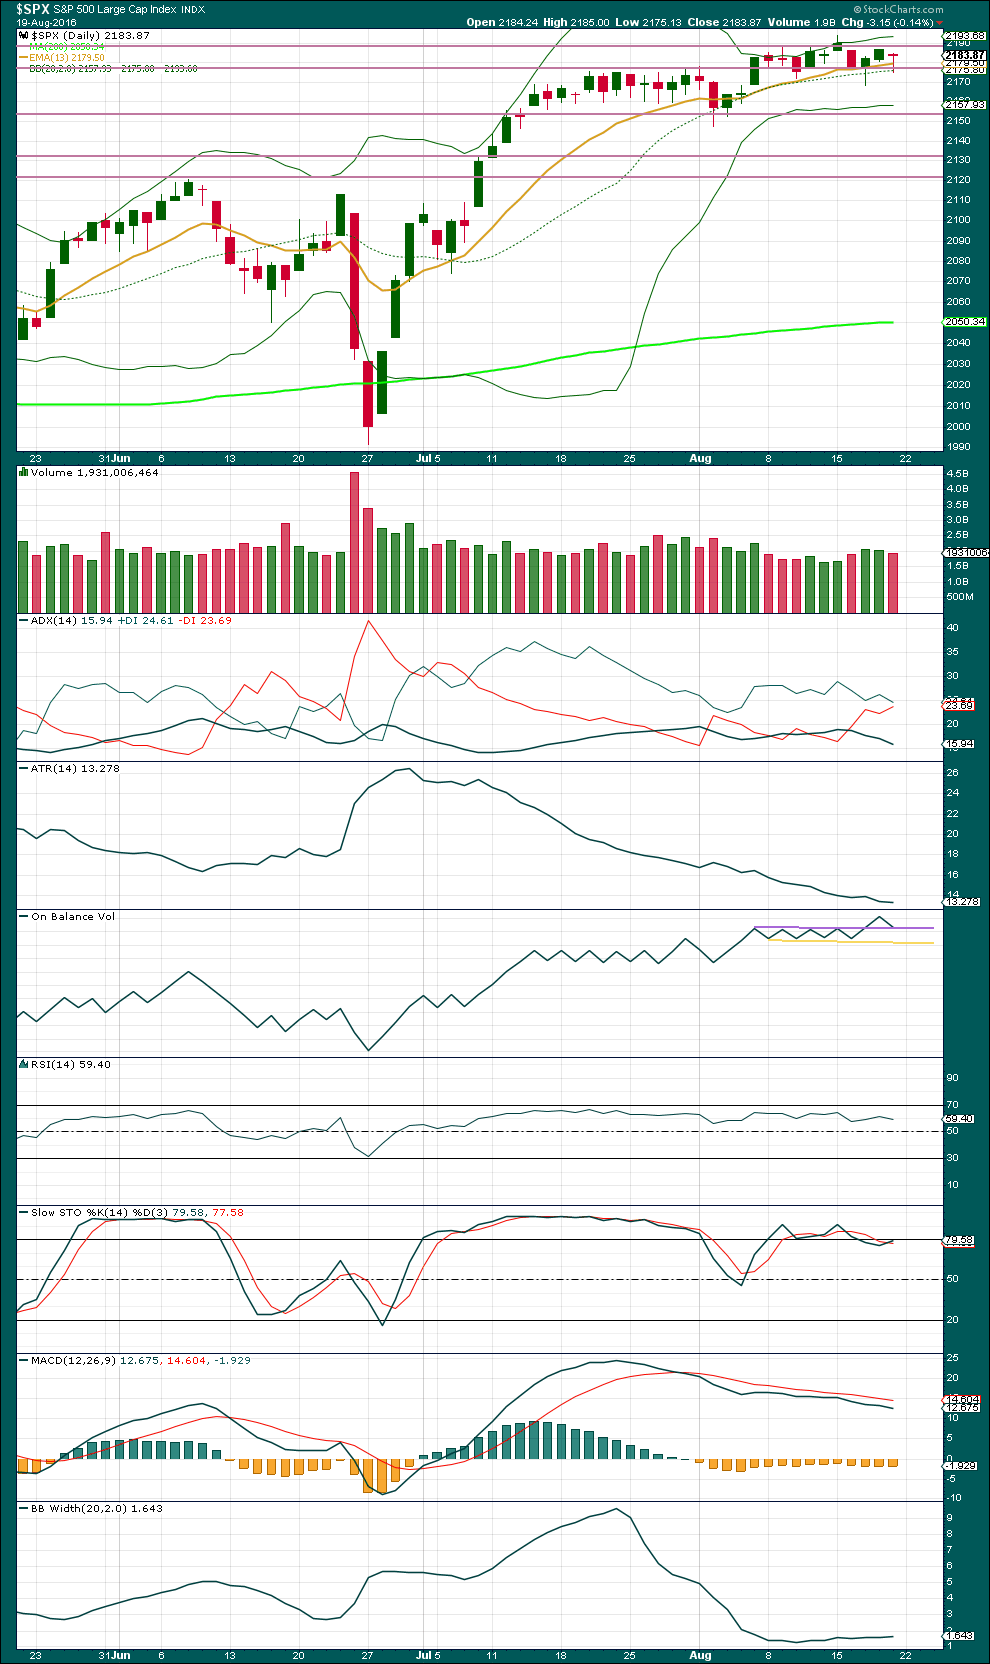
Friday’s red candlestick comes with slightly lighter volume than the prior two upwards days. The short term volume profile is slightly bullish.
Friday’s candlestick completes a dragonfly doji. As price is essentially still range bound, moving sideways with a slight upwards bias, and there are two other recent doji in this small range, this doji for Friday indicates slight caution. It does not signal a reversal.
The long lower wicks of Friday’s and Wednesday’s sessions now indicate some bullishness, where previously the longer upper wicks of 9th and 15th of August indicated some bearishness.
Price may be finding some resistance at the horizontal trend line about 2,185. A break above resistance on a day with some increase in volume would add further confidence to the wave count.
While price has essentially been moving sideways since about 14th of July (with an upwards bias), ATR is declining. It should be expected that ATR will again start to increase as a trend becomes stronger and clearer.
ADX is still declining, but during this entire time the +DX line has remained above the -DX line. No trend change has been indicated from ADX; the trend remains up. ADX may be indicating an interruption to the upward trend by some sideways consolidation, which is what has been happening.
The bullish signal from On Balance Volume with a break above the purple trend line remains. OBV has now come down to find support at that line. If Monday’s session prints a green daily candlestick and OBV moves up and away from this line, that would provide another strong bullish signal.
RSI is not yet extreme. There is room for price to rise or fall. There is no divergence at this stage between price and RSI to indicate weakness, but even if there was it would not be given much weight. The absence of divergence offers some slight support to this analysis today.
Stochastics is close to overbought, but this oscillator may remain extreme for reasonable periods of time during a trending market. If the market is still consolidating, a downwards swing from price would be expected here. But in this instance the signal from OBV is stronger than this expectation from Stochastics.
Momentum has been declining as price has been moving overall sideways. There is divergence between price and MACD, but this is unreliable at this time and is still not given any weight in this analysis.
Bollinger Bands remain tightly contracted but may be beginning to widen a little. It would be normal to expect them to again expand as some volatility returns to this market and price starts to more clearly trend. That is what the Elliott wave count expects to happen today. It remains to be seen if this market can behave normally at this time though.
VOLATILITY – INVERTED VIX CHART
Click chart to enlarge. Chart courtesy of StockCharts.com.
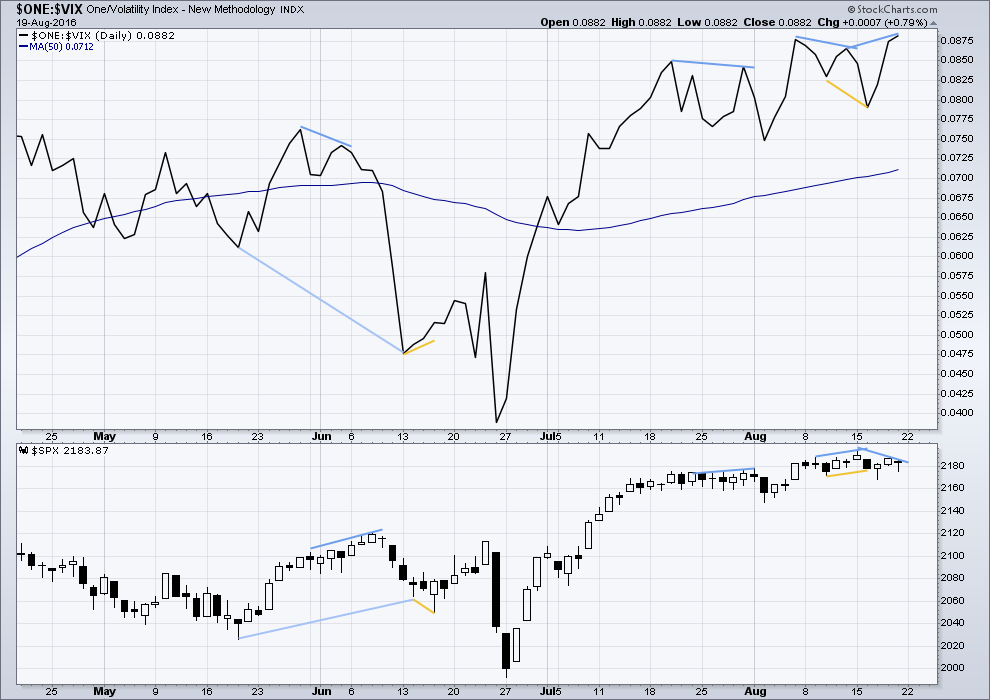
Volatility is declining as price is rising. This is normal for an upwards trend.
There are a few instances of multi day divergence between price and inverted VIX noted here. Bearish divergence is blue. Bullish divergence is yellow. Each of these instances was followed by expected price movement if only for two days. Divergence with VIX and price is not always working, but it is still sometimes working. So it will be noted.
Most recently two examples are noted: one of regular bearish divergence and one of hidden bullish divergence. In each case this was followed by the indicated direction for price for two days.
There is a more recent signal of hidden bearish divergence between price and VIX. From the high of 15th of August to the high of 18th of August, price has made a lower high but inverted VIX has made a higher high (recent blue lines). This indicates weakness to upwards movement from price. It is possible that this hidden bearish divergence was resolved by the red daily candlestick and new low for Friday, so Friday’s downwards movement may have been the result and may now have resolved this.
It appears so far that divergence between inverted VIX and price is again working to indicate short term movements spanning one or two days.
BREADTH – AD LINE
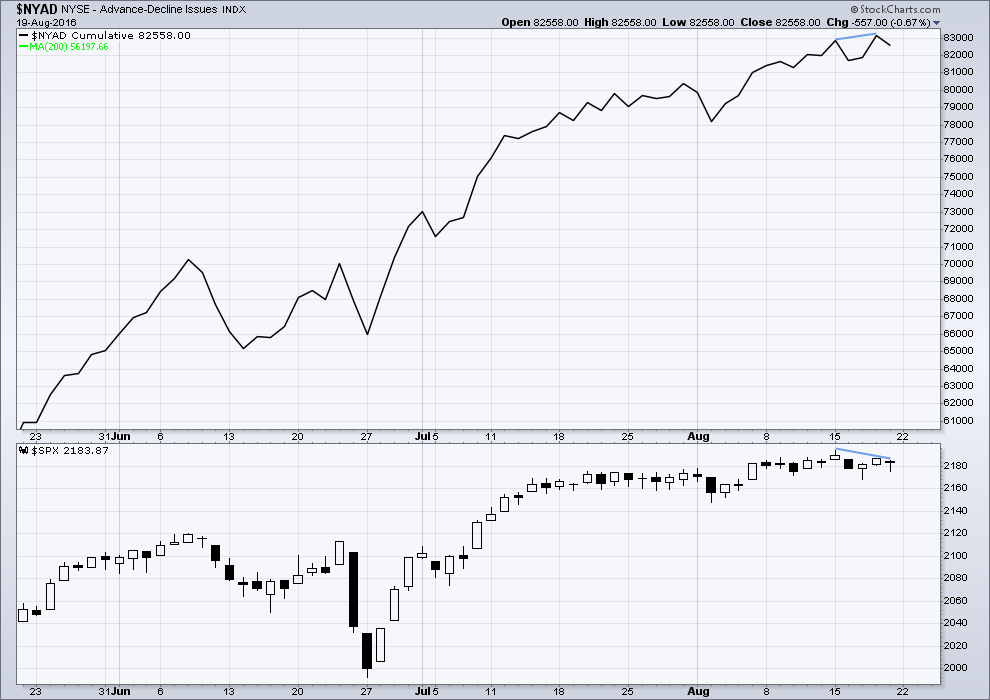
Click chart to enlarge. Chart courtesy of StockCharts.com.
There is support from market breadth as price is rising.
Hidden bearish divergence between price and the AD line has now been followed by a red daily candlestick, which made a new low below the day before. This divergence may again be working, like VIX, to indicate short term movements for the next one or two days.
DOW THEORY
Major lows within the prior bull market:
DJIA: 15,855.12 (15th October, 2014) – closed below on 25th August, 2015.
DJT: 7,700.49 (12th October, 2014) – closed below on 24th August, 2015.
S&P500: 1,821.61 (15th October, 2014) – has not closed below this point yet.
Nasdaq: 4,117.84 (15th October, 2014) – has not closed below this point yet.
Major highs within the new bear market:
DJIA: 17,977.85 (4th November, 2015) – closed above on 18th April, 2016.
DJT: 8,358.20 (20th November, 2015) – has not closed above this point yet.
S&P500: 2,116.48 (3rd November, 2015) – closed above this point on 8th June, 2016.
Nasdaq: 5,176.77 (2nd December, 2015) – closed above this point on 1st August, 2016.
Dow Theory Conclusion: Original Dow Theory still sees price in a bear market because the transportations have failed to confirm an end to that bear market. Modified Dow Theory (adding S&P and Nasdaq) has failed still to confirm an end to the old bull market, modified Dow Theory sees price still in a bull market.
This analysis is published @ 10:00 p.m. EST on 20th August, 2016.
Anyone got a defibrillator? This market looks dead. Everything is flatlining.
Range just below 13 points… that’s pathetic.
This won’t last forever…. but it sure is testing our patience 🙁
The calm before the storm. Take a look at this wedge. I think it portends quite a big move just ahead. The bullish move may break above, retest, then head for the moon. It could break above, then fall right back through it; it could break below, retest, and continue heading South. The second option is the most bearish imo…
I noticed something else interesting today. An incredible amount of buying power (from TRIN) was expended keeping the market from declining, and this in the absence of any real selling pressure. Unless buyers appear, it is going to be a lonely, pathetic (as you say),and limping completion of this impulse up…
Well folks, it looks like Mr Market is going to make us wait to see just exactly what he is up to next. The Bollinger bands on VIX remain freakish close. Whatever is going to happen next is sure to be interesting- never seen anything quite like this. Does VIX now fall completely out of the lower band on a move higher, or does it do a moon shot??!! ‘Bye!
This sideways chop may well be a continuation of minute ii.
The invalidation point (and stops) will remain at 2,168.50.
The analysis will change very little if at all today.
This thing cannot possibly get wound any tighter….
This move should be sharp whatever it is. The problem is it could be an initial head-fake and suddenly reverse and bolt in the opposite direction. I am happy to watch from the sidelines for now…
Joseph – – OMG really — take gold and cash out and bury is somewhere? Wow the end times are here. Man take a chill pill. The world will end some day, but not now or next few years. Fear mongering does no good and def. not a trading strategy. Having said that, is a correction possible in the markets — sure. So is a rally.
When the powers that be start with this nonsense… Yes, it’s Over! *Edit: no cursing please. – Lara
Now instead of economic data to determine how the economy is doing… they now want to use a POLL of how Happy People Are… “The Happiness Index” to decide Fed Action and Fiscal Policy!!!
That is the most MORONIC and INSAINE BS I ever heard in my life!
Wedge approaching an apex. Break up or down should be just ahead….
Looks to me like bearish rising wedges in the indices on the 15 minute chart. There is absolutely nothing bullish about what is going on in the markets right now. Something is REALLY rotting in Denmark…
So the VIX is UP 1.09 to 12.43 so far today???
It hit a high of 13.02 this morning. If it’s telegraphing trouble ahead, it should take out that high before the close. I am expecting it to drift back below 12.00 and will reload at 11.50.
I think volatility will continue to percolate regardless of what the market does. Traders are not entirely brain dead apparently….
*Edit: cursing removed. Please tone down the comments Joe. – Lara
Now instead of economic data to determine how the economy is doing… they now want to use a POLL of how Happy People Are… “The Happiness Index” to decide Fed Action and Fiscal Policy!!!
That is the most MORONIC and INSAINE BS I ever heard in my life!
The people SPEWING that garbage should be locked up for life!
NOW I know for sure that the World as we know it… will in fact END!
You should all take your cash and gold out from wherever it is stored and Bury it somewhere!
What is the point of burying cash that will become worthless?
Might as well keep it handy to burn it to keep warm in the winter. It will still have that value.
Whatever you think will store value then! The point is… if you don’t have physical control over it and 100% unencumbered access to it… IT IS NOT YOURS to have!
Yep. The next target is the 17 or so trillion of private and public pension funds. The fact is only the private funds are likely viable and with all the lying and scamming that has been going on even that is questionable. No question the vast majority of public pension schemes are insolvent, regardless of that the paper numbers tell you. Years of low interest rates have put the final nails in that coffin. They are all going to be wholly or in part exchanged for T bills and there is nothing the average citizen is going to be able to do to stop it. I am telling everyone I know to retire early, take the tax hit and get the hell out of Dodge while the getting is still good…and at least you will retain some of what you have saved…
I don’t think cash will be worthless. The money supply since the financial crisis of 2008 has nearly tripled, so I think if there is a severe crisis (my projection is a 20% chance) we will have bad hyperinflation. How bad? Well, within 6 months, the value of the USD could be cut to 35% based on the increased money supply. Foreigners would no longer see the dollar as a safe haven once high inflation is realized.
This will not be an isolated country affect as most hyperinflations in the past have been. We are talking about the world reserve currency here. I believe every single country in the world will suffer if the USD hyperinflates. It’s not a good thing, yet our stupid Fed policy is shifting us further in that direction.
So we haven’t seen it yet and the Fed wants more inflation then they’re getting now. If they misstep, it could very well get out of control. Confidence in the system is their only hope now. The trouble is getting the inflation going…what is the trigger?
In the US, people will still accept the USD as that is what they are trained to do…they will always do this for years after high inflation because they know no better. No one here has experienced really bad inflation, so it’s poo-pooed…
If one were to look at the US Debt clock, you would notice that metals are on there, and that the valuations for silver and gold are really high compared to where they are now. Decipher that however you want whether the metals are extraordinarily undervalued versus the USD or that the world no longer sees them as a monetary asset.
I feel that in the long run, silver is undervalued, but may not go as high as the debt clock infers.
The ONLY way out of this amount of Unsustainable Debt is Deflation!
40% to 70% hair cuts on all of it… before all is said & done!
High Yield Debt/Junk Bonds… all of it goes to ZERO!
The “GREAT CLEANSING”!
As we all know, Germany hyperinflated their currency to get out of debt after WWI. So, deflation is not the only way…
Our US government needs to become contractionary to contain the debt, but I don’t see any of our leaders going in that direction.
Yes, Deflation is the ONLY way out of Worldwide Unsustainable Debt!
THE ONLY WAY!
We’re going to have to have some agreement to disagree here folks.
Please tone it down Joe. Your POV isn’t the only one, and it’s not necessarily right.
Lets remain calm and polite with each other at all times. It encourages sharing.
And it’s my comments policy.
So, ok, work with me…if we have deflation, then oil will get obliterated, which I expect–a return to new lows and maybe a price of $10/barrel is a possibility. Agriculture could get destroyed some more, which I agree, there are too many producers in both areas.
Precious metals would find some pressure, but this is where it gets dicey…they have already been depressed and they’ve broken out this year. With deflation across the board, that would mean to me that the metals reach new multi-year lows and would finish their down move. People will want to own USD in this sort of environment and the dollar will go higher. However, there is fear and flight to safety…will that prevent the down move that we would expect in the metals?
What a way to ruin so many traders to have opposite moves in these markets during their historical strong seasonal period such as the metals…
You are right that the amount of dollars have increased substantially. The problem is that they are not yet in circulation, hence inflation relatively muted. This is evidenced by the historic low levels in the velocity of money. Debt destruction will actually initially increase the value of cash as it will reduce the number of dollars. The hyperinflation will come after the deflationary spiral causes the FED to pull out all the stops….
Verne, very true…the transition in money supply from M2 to M1 is beyond my understanding, but I know it could materialize somewhere. And when it does, inflation explodes.
Deflation…we’ve had quite a bit of deflation in commodities…or is it stagnation with very low inflation?
It’s the diminishing effect of money velocity…we have been expansionary in this economy for so long, our ________ leaders (fill in the blank with a nice or naughty word) don’t want to look bad. In other words, the Fed and our government only see forward as success, so five steps forward and none back is success to them. One step backward (a rate rise or the stock market falls 10-15%) would mean failure to the public. These people have huge egos and cannot admit that they were too supportive of the stock market–instead, they should have focused on the real economy…alas, hindsight 20/20 and egos that refuse to be dented. Maybe I’ll move to Canada as their policy doesn’t seem to be as destructive.
As for the rate rise, most think it won’t happen…still, I’m not so sure. There is a remote possibility that the Fed does not want total destruction of the monetary system in the future.
I think Verne went offline for the day, but this does not bode well for the long-term future…it’s getting harder for central bankers to pump up the market than before. Who knows when this will blow up…money velocity has been weakening for a long time.
Of course, Lara’s bull target is still on the table until it’s not…
It is now virtually impossible to wire funds from the US internationally without a mind boggling amount of paperwork explaining why you are not a drug kingpin or otherwise involved in some kind of money laundering. This is kind of stunning coming from a bank you have dealt with for decades that is so cowed by the the US government, they are terrified to provide perfectly legitimate banking services for fear of being fined or harassed. The window to get your assets out of reach of the clammy hands of a bankrupt and corrupt system is fast closing folks.
I have never looked at high value numismatic coins before but am now doing so because they provide means of high density value and relative ease of transportation. How much longer can the illusion be maintained, I wonder….
I am still convinced the breakout or breakdown is not going to come intra-day. It will happen via futures overnight. Trying to trade the market intra-day under the current circumstances is a fool’s errand in my view. We have to wait for the break to take place, and do so clearly and cleanly…
bloody hell this market is.
Be patient. Either they confirm the break to the upside with a new high above 2193.81, or this market completely gets away from them with a hellish break to the downside, confirming in my view the ED scenario. No point in fighting the chop short term. The smart thing to do is wait….
I ended up buying next week’s SPY calls.
This market is not at all to my liking so I am moving to the sidelines and taking a break. Selling calls for 1.10 and done for the day. Will reload VIX shares on any move below 11.50. Have fun! (if you can) 🙂
The market remains maddeningly range bound. If the market makers take out my stop (not in the market) at 0.50 for those calls I’m done trying to trade the short term. Not worth the aggravation…. 🙂
SPY 218.50 straddle not signaling a strong directional move. Calls and puts still roughly at parity showing trader uncertainty about which way market is going to move. This is really interesting and illustrates how dicey the current market situation is.
If SPX does not take out 2193.81 today I am back to the sidelines waiting for a VIX reload.
Filled on 219 SPY calls at 1.00.
Opened STC at 1.25 for upside scalp.
Stop at 0.50, a bit more generous than usual but the banksters have been relentless in shaking out both bulls and bears so one has to give them room to shake the trees…
This D*MN market sucks! Nothing like getting whipped out by a point only to see it turn in the direction you were trading! UGHHHH!!!!
The trend remains up for the time being. Give yourself a bit wider stop if you are trading upside scalps. If you place your stops in the market they will try to shake you out, and provably will more often than not…
Give it a little more room to move? Reduce position size to achieve this.
This move down looks corrective. Buying this week’s expiration SPY 219 strike calls for limit of 0.90 per contract, current bid/ask 94/95. Also opened buy stop price of 1.00 per contract, whichever gets filled first. If filled, will immediately open STC order at 1.25 per contract. Will switch order to roll into 120 strike calls if reversal occurs with strong volume and momentum…
Sold 1/2 VIX shares for 13.00 even.
Sold September 13.00 strike calls against remaining long position for 2.15 per contract.
Opened order to re-buy VIX shares at 11.50
Last time I capitulated and bought and 11.70 because of impatience. I need to learn to stick with my plan and price targets but that is easier said than done. This time I am sticking to it.
Thankfully for us, fear is the one variable that banksters cannot suppress, or manipulate….at least not indefinitely!
Continuing to trade volatility with good results. Will sell half position at the open for limit price of 12.75. Will sell 13.00 strike covered calls on remaining half for limit of 2.00 to reduce cost basis of shares to 9.5. If we are at the beginning of a third wave to the upside VIX could conceivably take out take out last year’s 10.88 low.
If VIX falls below 11.00, position will be defended with UVXY puts. I do not trust this market.
The charade gets even more bizarre. Now Blanchard of the IMF is talking about measuring economic growth using something other than GDP. In other words, when we can’t lie using the available data, lets find something we can manipulate at will and perpetuate this ridiculous illusion that all is well. The more I hear from these clowns, the more uneasy I become. As Joe often states, nothing is as it seems…
Things must be getting pretty desperate at the FED. They know that Stan Fischer is very well respected so they trot him out to continue their ridiculous lies about a rate hike this year. It is sad to see them use this man in this way, and even more surprising that he is willing to take part in the deception. It may buy them a few more days,or even week as gullible marketeers go for it hook like and sinker. I still maintain the next FED move will be a rate cut, not a hike.
PMs offering another great entry opportunity as the slide in response over the next few days or weeks.
Sometimes doing nothing is the hardest but best option… If we start to get some follow through into the US session looks like we might finally be trending
Good luck and thanks for all the comments and analysis
Vern,
This agrees with EW analysis as well as few other things I am seeing. Also remember QE will soon meet stimulus by governments -(Infrastructure etc globally). So this has more room for upside. However during the process, we will have corrections; some deep and some shallow. Market will give everyone a chance to make money, as long as we stay with the trend.
Someone on the Gold site shared a most interesting video by Chris Ciovacco on a possible extended bull run in the US stock market. He cites some compelling evidence based on the current reading in several moving averages, and based on historical performance, their current configuration has always presaged an extended bull run. I completely agree with Chris that as traders we have to rely on fact and not our opinion, and the facts he presents are quite persuasive. I must confess that even after watching the video I had mixed feelings. Considering the the facts of economic reality in the US, an extended bull run seems to defy logic. The current price levels we are seeing in equities is not due to robust economic growth (six straight quarters of declining earnings) but rather Q.E. and tens of billions in stock buybacks. Having said that, who is to say this cannot continue for another 100 weeks or more? His analysis comports well with the EW expectation of a third wave up, was well as the BB compression suggesting a huge move, which he obviously thinks could well be to the upside. I am curious to know what others think about his take.
http://seekingalpha.com/article/4000998-stock-market-signal-occurred-10-times-last-35-years-video
First.