
Upwards movement was expected for Thursday’s session.
A new high and a small green daily candlestick fits the expectations nicely. On Balance Volume is giving a strong signal today.
Summary: The trend remains the same, until proven otherwise. Assume the trend is up while price is above 2,147.58. The mid term targets are 2,332 or 2,445. If price makes a new low below 2,147.58, then probability will shift to a deep pullback beginning, target zone 1,941 to 1,883. At this stage, a deeper pullback looks increasingly unlikely. There is not enough selling pressure which would be required to push price lower.
Last monthly chart for the main wave count is here.
New updates to this analysis are in bold.
MAIN WAVE COUNT
WEEKLY CHART
Click chart to enlarge.
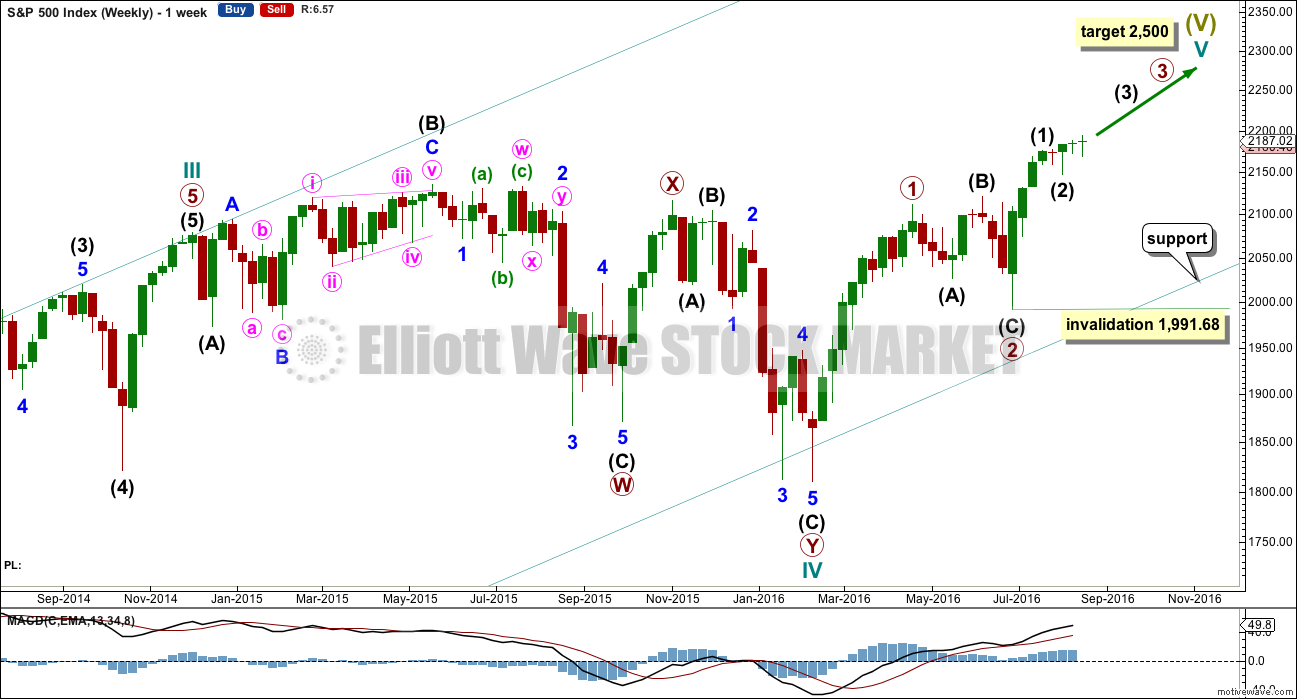
Cycle wave II was a shallow 0.41 zigzag lasting three months. Cycle wave IV is seen as a more shallow 0.28 double combination lasting 15 months. With cycle wave IV five times the duration of cycle wave II, it should be over there.
Cycle wave I lasted 28 months (not a Fibonacci number), cycle wave II lasted a Fibonacci 3 months, cycle wave III lasted 38 months (not a Fibonacci number), and cycle wave IV lasted 15 months (two more than a Fibonacci 13).
If the target for cycle wave V is for it to be equal in length with cycle wave I, then it may also be expected to be about equal in duration. So far cycle wave V is in its sixth month. After this month, a further 22 months to total 28 seems a reasonable expectation, or possibly a further 15 months to total a Fibonacci 21.
This first weekly wave count expects the more common structure of an impulse is unfolding for cycle wave V. Within cycle wave V, primary waves 1 and now 2 should be over. Within primary wave 3, no second wave correction may move beyond its start below 1,991.68. If price makes a new high above 2,203.68, then that would provide enough confidence that intermediate wave (2) should be over to move the invalidation point on the weekly chart up to 2,147.58.
There is one other possible structure for cycle wave V, an ending diagonal. This is covered in an alternate.
DAILY CHART
Click chart to enlarge.
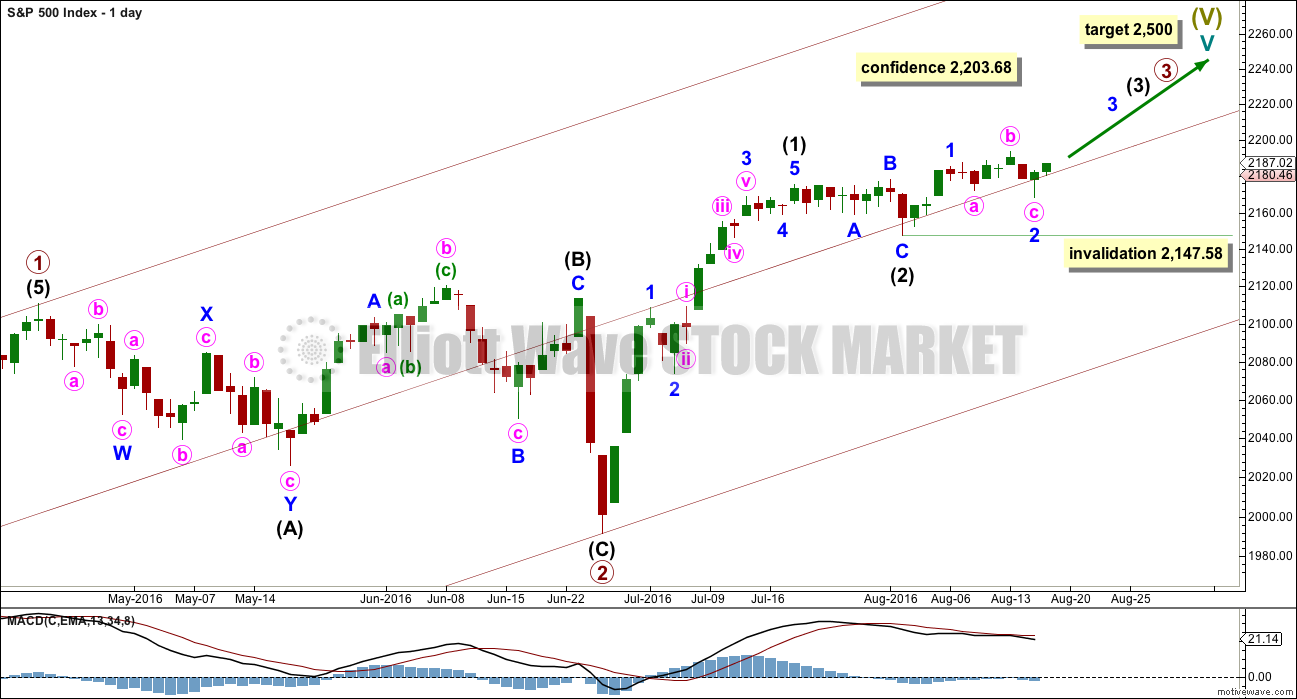
Primary wave 2 is complete as a shallow regular flat correction. Primary wave 3 is underway.
Within primary wave 3, intermediate wave (1) is a complete impulse. Intermediate wave (2) may now be a complete flat correction.
It is still possible that intermediate wave (2) may not be complete and could continue sideways and a little lower. A deep pullback would not be expected, only a sideways combination, double flat or slightly lower expanded flat would be indicated. If price moves above 2,203.68, then upwards movement from the low at 2,147.58 would be more than twice the length of intermediate wave (2). At that stage, the probability that upwards movement is a B wave within intermediate wave (2) would be so low the idea should be discarded. A new high above 2,203.68 would add confidence in the upwards trend.
Within intermediate wave (3), no second wave correction may move beyond its start below 2,147.58.
Add a mid line to the base channel drawn about primary waves 1 and 2. Draw this channel from the start of primary wave 1 (seen on the weekly chart) to the end of primary wave 2, then place a parallel copy on the end of primary wave 1. The mid line may provide some support along the way up.
At this stage, it looks most likely that intermediate wave (3) has begun. It should be expected to show the subdivisions of minor waves 2 and 4 clearly on the daily chart with one to a few red daily candlesticks or doji. With minor wave 2 now showing as two red candlesticks, one doji and a green candlestick with a long lower wick, this wave count so far has a typical look.
HOURLY CHART
Click chart to enlarge.
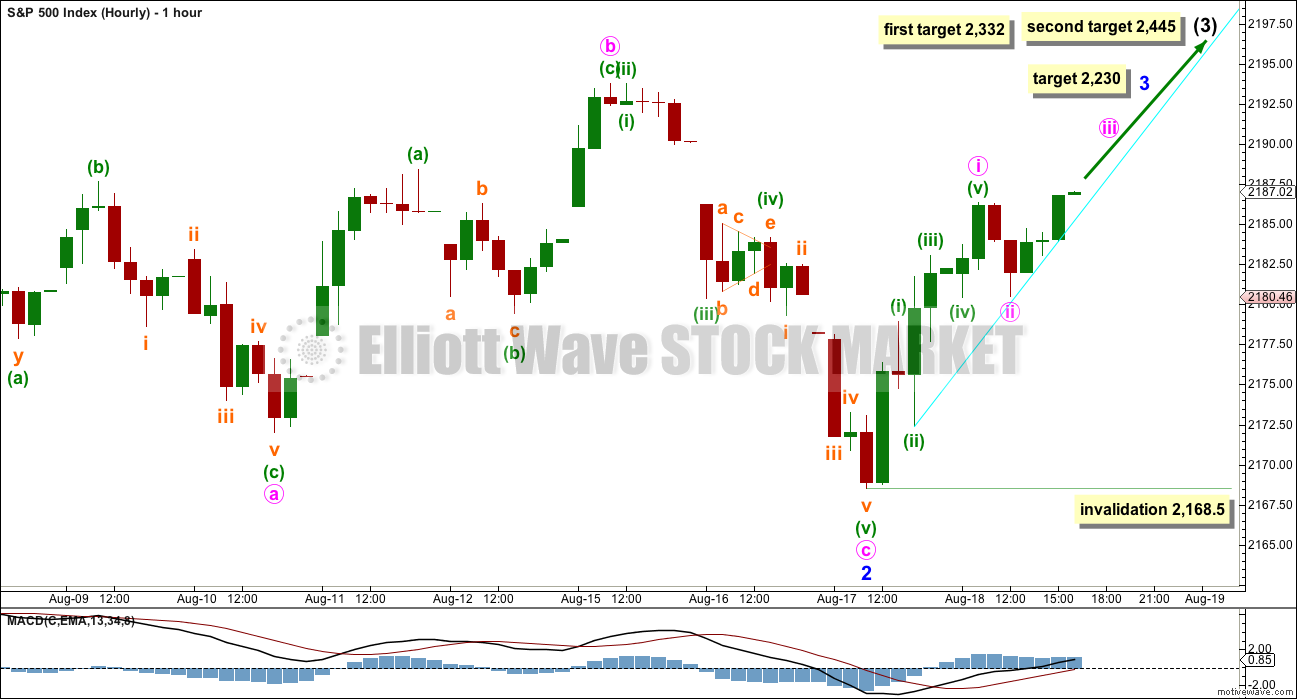
Minor wave 2 now looks to be a complete expanded flat correction. It is relatively shallow at 0.45 the depth of minor wave 1. Minor wave 1 lasted four days and now minor wave 2 has lasted seven days. It is extremely likely to be over here if this wave count is correct.
At 2,230 minor wave 3 would reach 1.618 the length of minor wave 1. This target fits nicely with mid term targets for intermediate wave (3) to end.
Minor wave 3 may only subdivide as an impulse. Within minor wave 3, minute waves i and now ii look likely to be complete. A steep trend line is drawn across the recent lows. This line is not very technically significant yet may still provide some support. If it is breached, then minute wave ii may be continuing further as a combination or expanded flat correction. Minute wave ii may not move below the start of minute wave i at 2,168.50.
If price starts to move up and away from this trend line early in tomorrow’s session, then the probability that minute wave ii is over and minute wave iii upwards has begun would increase. The strong bullish signal from On Balance Volume today supports this idea.
Mid term targets for intermediate wave (3) remain the same. At 2,332 intermediate wave (3) would reach equality in length with intermediate wave (1). If price keeps rising through this first target, or if when it gets there the structure is incomplete, then the second target would be used. At 2,445 intermediate wave (3) would reach 1.618 the length of intermediate wave (1).
ALTERNATE WAVE COUNT
WEEKLY CHART
Click chart to enlarge.
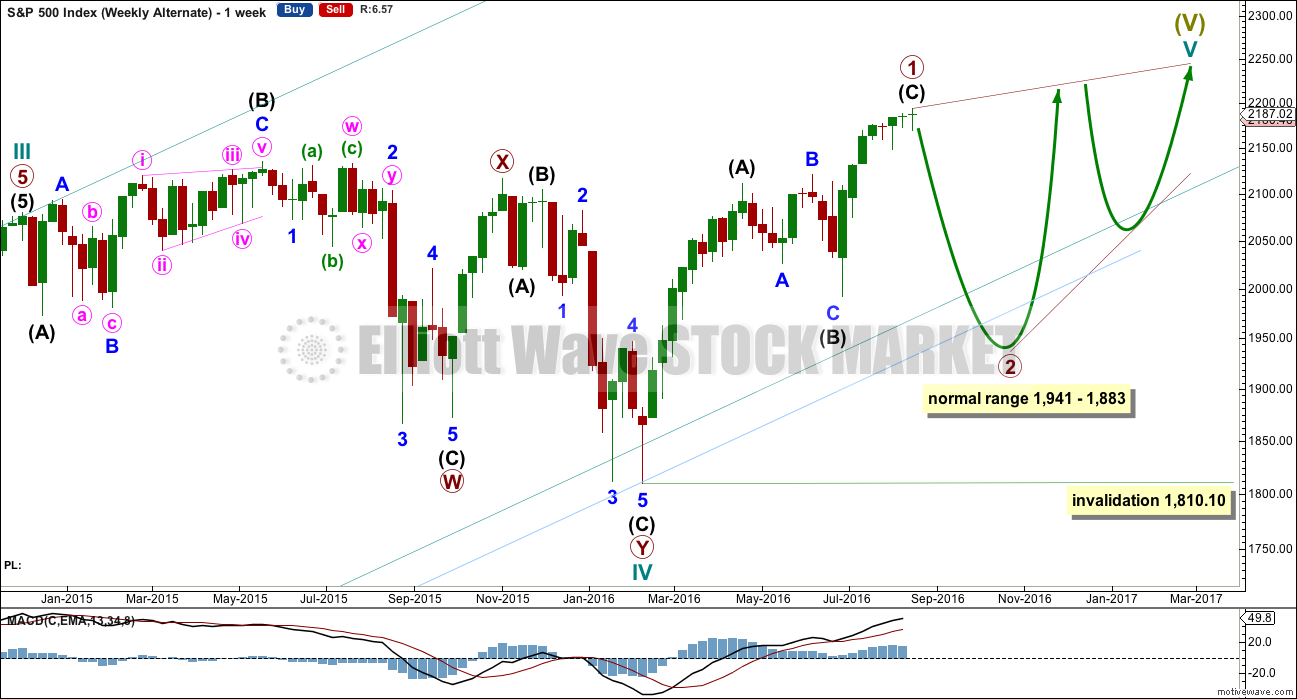
This alternate may diverge from the main wave count.
The other structural possibility for cycle wave V is an ending diagonal. Ending diagonals are more often contracting than expanding, so that is what this alternate will expect.
Ending diagonals require all sub-waves to subdivide as zigzags. Zigzags subdivide 5-3-5. Thus primary wave 1 may now be a complete (or almost complete) zigzag, labelled intermediate waves (A)-(B)-(C) which subdivides 5-3-5.
The normal depth for second and fourth waves of diagonals is from 0.66 to 0.81 the prior actionary wave. Primary wave 2 may end within this range, from 1,941 to 1,883.
Primary wave 2 may not move beyond the start of primary wave 1 below 1,810.10.
When primary wave 2 is a complete zigzag, then another zigzag upwards for primary wave 3 must make a new high above the end of primary wave 1. It would most likely be shorter than primary wave 1 as diagonals are more commonly contracting. If primary wave 3 is longer than primary wave 1, then an expanding diagonal would be indicated.
The psychology of diagonals is quite different to impulses. Diagonals contain corrective characteristics and subdivide as a series of zigzags. When diagonals turn up in fifth wave positions, they take on some of the properties of the correction which inevitably follows them. The deterioration in fundamentals and underlying technicals is more extreme and more evident. There is some support for this idea at this time.
The final target of 2,500 would not be able to be reached by an ending contracting diagonal. The final target for this alternate would be calculated only when primary wave 4 is complete.
The classic pattern equivalent is a rising wedge.
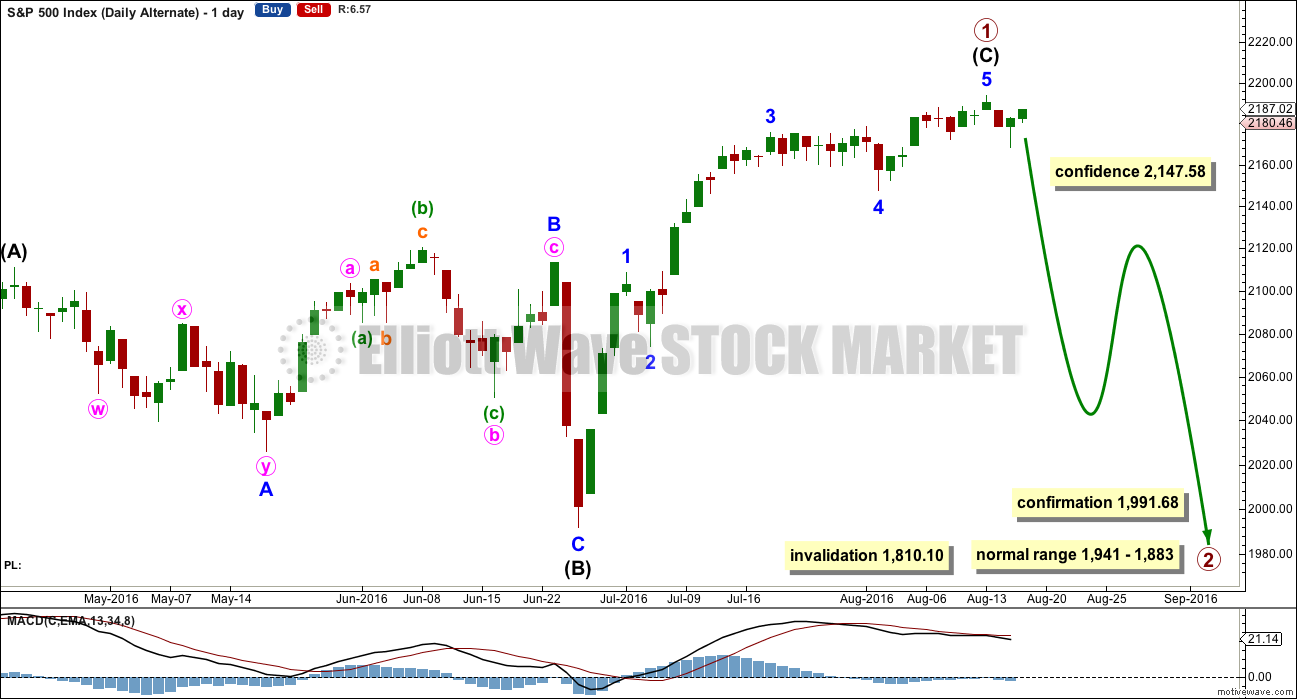
DAILY CHART
Click chart to enlarge.
It is possible now that intermediate wave (C) is a complete five wave impulse. However, this wave count suffers from disproportion between minor waves 2 and 4 which gives this possible impulse an odd look. It looks like a three where it should look like a five. However, the S&P just does not always have waves which look right at all time frames.
Because this wave count expects to see a substantial trend change here from bull to bear for a multi week deep pullback, it absolutely requires some indication from price before confidence may be had in it. A new low below 2,147.58 would add confidence.
At this stage, there is not enough selling pressure to support this wave count. When the market has fallen recently, it has fallen of its own weight. For a deep pullback sellers would have to enter the market and be active enough to push price lower. That is not happening at this time.
TECHNICAL ANALYSIS
WEEKLY CHART
Click chart to enlarge. Chart courtesy of StockCharts.com.
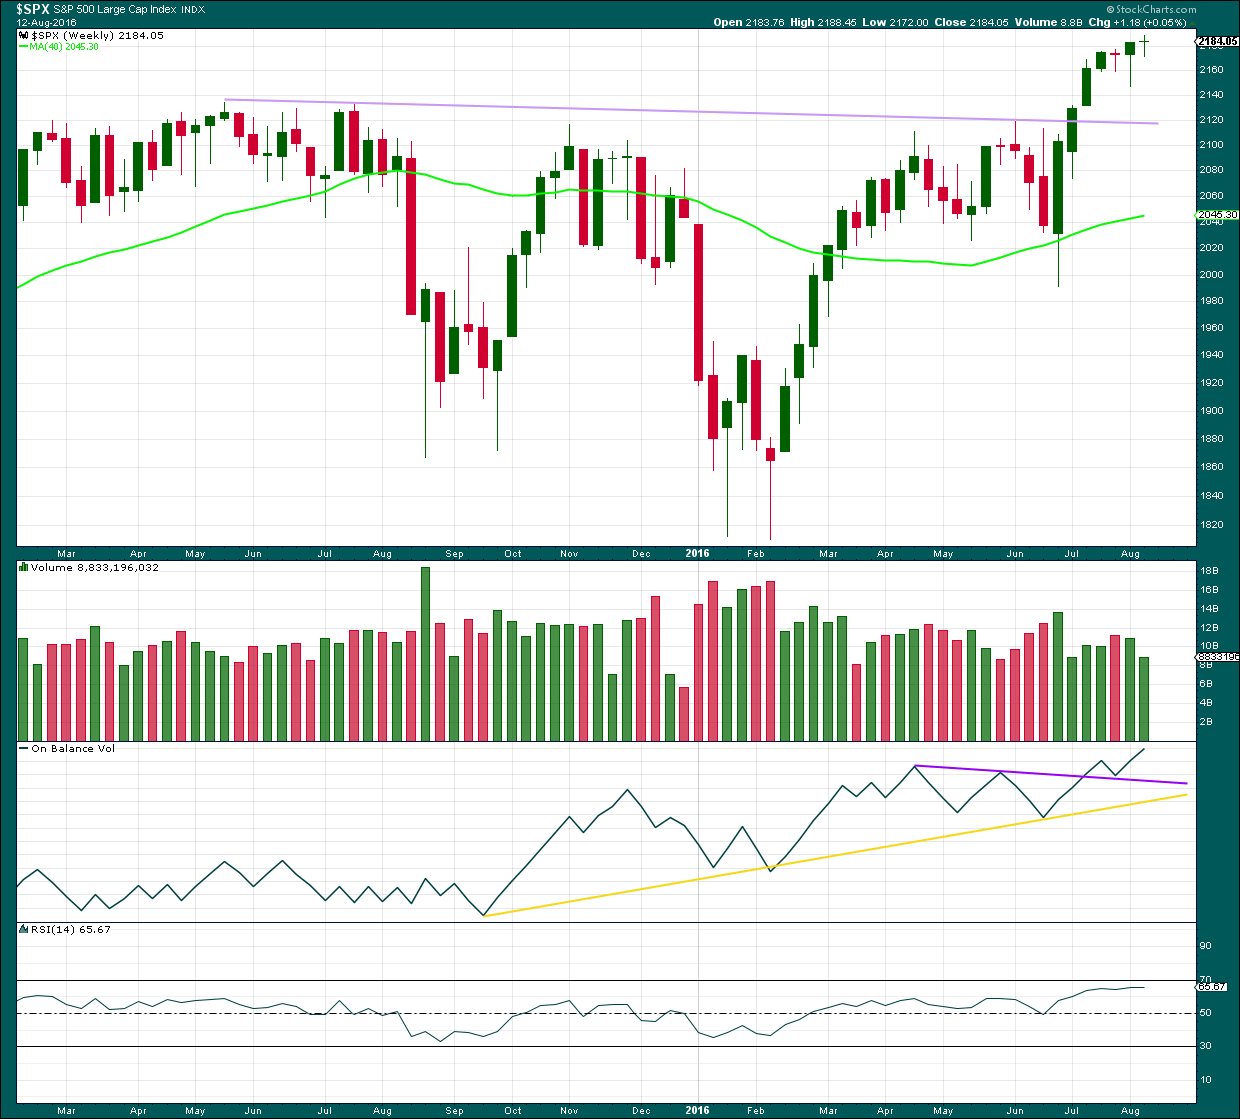
Last week ends with a small green doji candlestick. The week before completed a possible hanging man, but the green real body and the long lower wick (bullish) require bearish confirmation from the next candlestick before the pattern can be read as a bearish reversal pattern. That has not happened, so both weekly candlesticks should now be read as bullish.
Last weekly candlestick comes with lighter volume. A decline in volume along with a doji candlestick indicates that price movement for the week may have been more consolidation than trend.
On Balance Volume is bullish while it remains above both trend lines. There is no divergence between price and OBV last week to indicate any weakness in price, both made new highs.
RSI is flat and not extreme. There is room for price to rise further.
DAILY CHART
Click chart to enlarge. Chart courtesy of StockCharts.com.
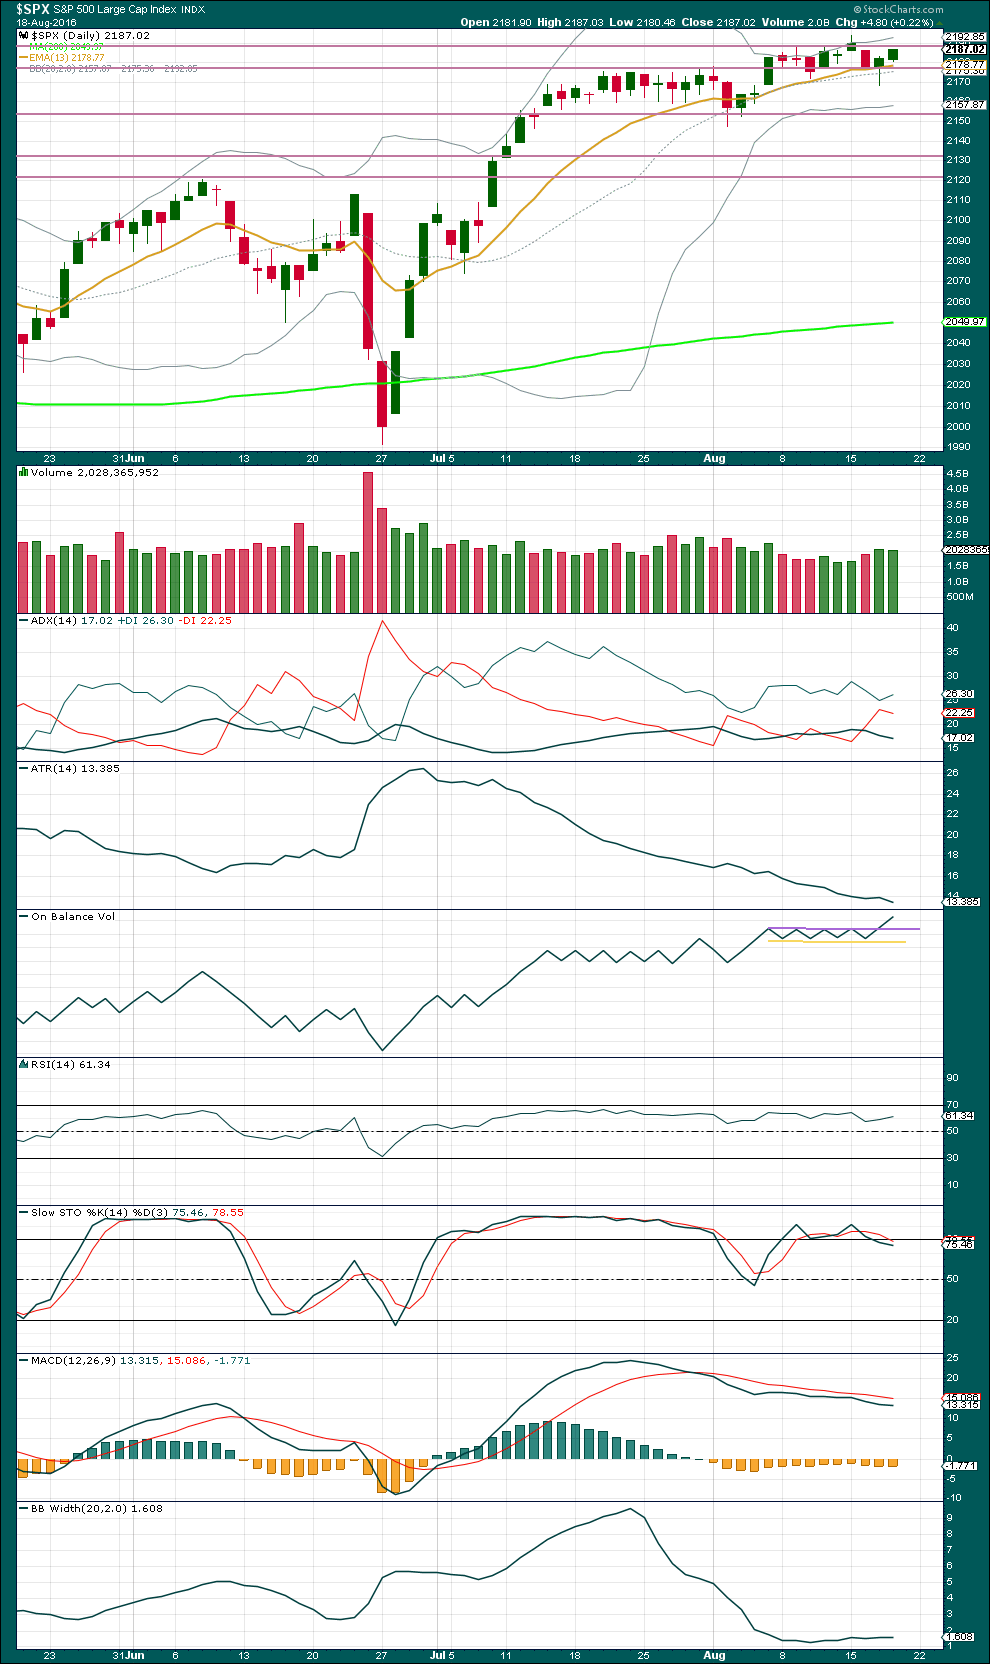
The long lower wick on yesterday’s candlestick was bullish. This is now followed by another green daily candlestick. Today’s candlestick comes on slightly lighter volume than yesterday, but volume for the last two upwards days is still stronger than the prior downwards day. Overall, there is still some support for the upwards movement in price.
Price may be finding some resistance at the horizontal trend line about 2,185. A break above resistance on a day with some increase in volume would add further confidence to the wave count.
While price has essentially been moving sideways since about 14th of July (with an upwards bias), ATR is declining. It should be expected that ATR will again start to increase as a trend becomes stronger and clearer.
ADX is still declining, but during this entire time the +DX line has remained above the -DX line. No trend change has been indicated from ADX; the trend remains up. ADX may be indicating an interruption to the upward trend by some sideways consolidation, which is what has been happening.
On Balance Volume has been tightly constrained until today. OBV today is giving a strong bullish signal with a break above the purple line that previously provided resistance. At this time, it has been noted that divergence between price and various oscillators and indicators has not been working well. One indicator that has been working well recently has been OBV. This signal is given reasonable weight in today’s analysis, and it adds confidence to the main wave count at all time frames.
RSI is not yet extreme. There is room for price to rise or fall. There is no divergence at this stage between price and RSI to indicate weakness, but even if there was it would not be given much weight. The absence of divergence offers some slight support to this analysis today.
Stochastics is close to overbought, but this oscillator may remain extreme for reasonable periods of time during a trending market. If the market is still consolidating, a downwards swing from price would be expected here. But in this instance the signal from OBV is stronger than this expectation from Stochastics.
Momentum has been declining as price has been moving overall sideways. There is divergence between price and MACD, but this is unreliable at this time and is still not given any weight in this analysis.
Bollinger Bands remain tightly contracted. It would be normal to expect them to again expand as some volatility returns to this market and price starts to more clearly trend. That is what the Elliott wave count expects to happen today. It remains to be seen if this market can behave normally at this time though.
VOLATILITY – INVERTED VIX CHART
Click chart to enlarge. Chart courtesy of StockCharts.com.
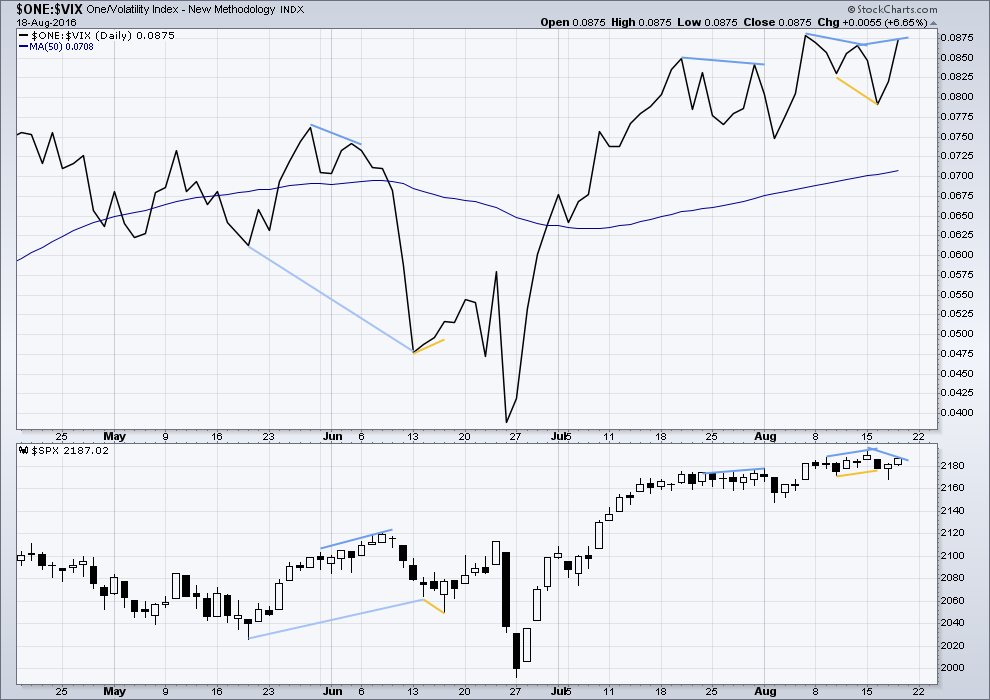
Volatility is declining as price is rising. This is normal for an upwards trend.
There are a few instances of multi day divergence between price and inverted VIX noted here. Bearish divergence is blue. Bullish divergence is yellow. Each of these instances was followed by expected price movement if only for two days. Divergence with VIX and price is not always working, but it is still sometimes working. So it will be noted.
Most recently two examples are noted: one of regular bearish divergence and one of hidden bullish divergence. In each case this was followed by the indicated direction for price for two days.
Now inverted VIX today shows hidden bearish divergence with price. From the high of 15th of August to the high today of 18th of August, price has made a lower high but inverted VIX has made a higher high (recent blue lines). This indicates weakness to upwards movement today from price. It remains to be seen if this divergence will simply disappear or if it will result in one or two days of downwards movement from price beginning tomorrow. It is given a little weight in today’s analysis. On Balance Volume has been working more reliable recently, so that is still given more weight.
BREADTH – AD LINE
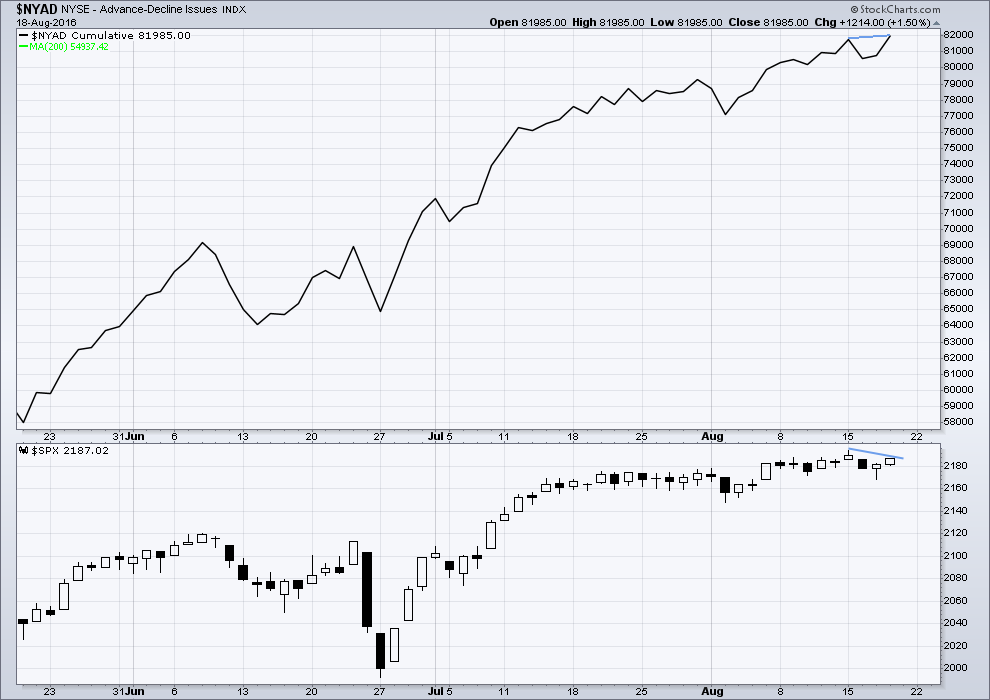
Click chart to enlarge. Chart courtesy of StockCharts.com.
There is support from market breadth as price is rising.
There is today some hidden bearish divergence between price and the AD line. As price has made a lower high below 15th of August, the AD line today made a higher high. This indicates weakness in price. Normally, this would be given some weight, but in recent weeks it has been noted that divergence between price and the AD line is unreliable. It is noted but will be given no weight in today’s analysis.
DOW THEORY
Major lows within the prior bull market:
DJIA: 15,855.12 (15th October, 2014) – closed below on 25th August, 2015.
DJT: 7,700.49 (12th October, 2014) – closed below on 24th August, 2015.
S&P500: 1,821.61 (15th October, 2014) – has not closed below this point yet.
Nasdaq: 4,117.84 (15th October, 2014) – has not closed below this point yet.
Major highs within the new bear market:
DJIA: 17,977.85 (4th November, 2015) – closed above on 18th April, 2016.
DJT: 8,358.20 (20th November, 2015) – has not closed above this point yet.
S&P500: 2,116.48 (3rd November, 2015) – closed above this point on 8th June, 2016.
Nasdaq: 5,176.77 (2nd December, 2015) – closed above this point on 1st August, 2016.
Dow Theory Conclusion: Original Dow Theory still sees price in a bear market because the transportations have failed to confirm an end to that bear market. Modified Dow Theory (adding S&P and Nasdaq) has failed still to confirm an end to the old bull market, modified Dow Theory sees price still in a bull market.
This analysis is published @ 11:13 p.m. EST.
[Note: Analysis is public today for promotional purposes. Member comments and discussion will remain private.]
Another expanded flat for minute wave ii to whipsaw and confuse us.
Let’s see what OBV does today. Test the trend line? That would be nice.
The wave counts will hardly change today. Up up up and away next week please Mr Market! Lets get a move on!
These small range days essentially drifting sideways are hard psychologically. And psychology is most of trading. I’ll be sticking with the plan, managing risk, and sleeping easy.
If I’m wrong and Mr Market whomps me again then my loss is contained and manageable. Less than 3% of equity long so far.
I expect we will see a big move next week but what direction remains unclear, at least to my myopic eyes. I will therefore enter a SPY 218.00 straddle at the close with expiration coming next week. I suspect the next big move should be at least a week or so and will allow sufficient time to add to one side or the other depending on which way the market breaks. Have a great week-end everybody!
Ordinarily I would not hesitate to short a rising wedge formation such as we are seeing today but these are not ordinary times. I have seen recent cases in which price broke to the upside of what looked like bearish rising wedge. We could be seeing the same thing here…
It just occurred to me to that today is standard August options expiration. The market makers have a vested interest in keeping the market in a narrow range so that as many puts and calls as possible expire worthless. I completely forgot about that.
VIX not making a very strong case for the short side. I think we have sideways consolidation ahead of an ultimate move higher. These spikes down look very much like price manipulation to me to shake out short term bulls and trap over eager bears. I for one am not biting…. 🙂
I’m getting short the es here. 2179.25. Placing a 3 point stop at 2182.25. Full position.
I would take any profits that materialize early and often!
The market makers are playing whack a mole today and will continue to do it into the close so you could possibly get a quick scalp…but you have to be quick! 🙂
If VIX goes red, even before your stop it could be a sign to bail….
Okay, but trying to pick a top isn’t a good idea.
The trend is up, not down.
Depends on time frame. I trade the 30 minute chart for the most part.
Market exhibiting schizoid characteristics. Way too erratic for my liking. Very content to watch this from a safe distance for the time being
It’s another expanded flat Verne. The B waves within them are pretty schitzoid
Tell me about it. These expanded flats seem to be the waves du juor – they say an awful lot about the psychology of the current market that we are seeing so little variation in the wave structures. I have a funny feeling that the low volume we are seeing and the predictable patterns speak to an awful lot of bot trading. Someone opined that a lot of bears (and I imaging bulls as well) got wiped out on the Brexit plunge and subsequent whipsaw. It is cause for extreme caution that the market has had every opportunity to move higher on little or no volume or selling pressure and yet has failed to do so. Apart from my VIX position which I want to hold for the duration, I have a strong disinclination to risk even a small 3% stake in this market overnight. It’s just that kind of feeling…I want to be sitting on a mountain of VIX shares at the top and my plan is to just keep adding to the pile….
Stopped out of calls at 0.55 for very small profit, hardly worth the effort, but again illustrating how unstable and unpredictable the market has become. I think its back to SOH until further notice…. 🙂
A ton of buying power expended to move us sharply up off this morning’s low but we have still not filled this morning’s open gap down. The longer that gap remains open, the more likely it is that it STAYS open. NDX already printing a green candle so the other indices really should be doing the same follow the leader routine. Looking for a sharp move one way or the other to put the matter to rest….calls up to bid of 0.59, moved stop to 0.55….
SPY 218 calls trading at 0.56. Moved stop to 0.50. I’ll give ’em another hour to boom or bust….at least that will cover broker’s com and fees…
O.K Mr Market, go ahead and print some green already so I can roll those calls will ya?
Why do I get the feeling that the rug is about to get pulled? 🙂
If we don’t fill that gap from this morning and soon, I am afraid we are going much lower folk…
The FED presidents may be devious but they are not dumb. All this jawboning about rate hikes is nothing more than an acknowledgement that an impending bursting of a multi-decade bond bubble is going to take the control of rates out of their hot little hands. They know a rise in rates is coming because of cascading defaults in the bond market and there is not a single thing on God’s green earth that they can to do prevent that. That is the real story folk. All the talking heads are totally clueless, or perhaps complicit.
Even if the market makers are playing with the bulls, they are going to have to make it look convincing so I’ll play along. Buying a small speculative contingent of SPY 18.00 strike calls expiring today for 0.45 apiece. Opened sell to close order at a limit of 0.90.
The emphasis being on speculative. If it goes in the money will roll into next week. Stop at 0.30 per contract or new high today in VIX whichever comes first.
Dreaming a Dream… CHA
I want to see this market actually print a green candle today, not just threaten to do so. So far things heading in the right direction with volatility declining but its got to show me the money. Europe has not reversed its slide so far so I am still a bit cautious….
Ouch! Bought next week’s calls near the close yesterday. Dork!
Going to follow Verne’s cautionary notes for awhile:
“It has to be quite clear to everyone that the market makers are engaged in an on-going game of “whack-a-mole” and unless you take profits intra-day, you are likely to get whacked!” Thanks Verne!
We are now in a position to post a bullish engulfing candle because of the new lows today. If we get a green print today, I think that would be a good sign to go long the market. I might even be induced to hold some calls over the week-end.
Egad! Did I actually say over the week-end!!! I must be getting bull fever! 🙂
Then again, if we get a nice enough ramp up through the close nothing wrong with taking some off the table…
It’s going to close with a shaven head doji. but red.
I’ll take a look at Mr Nison and see what he has to say about that….
Important level of 2176 broken. Unless this is a final fifth wave down with an imminent reversal, that could be significant. Watching action in VIX for clues. Will sell another 1/4 if price clears 13.00….
Thanks Lara for the extra video update. I noted you said weakness today might give us a better entry point. Well, now fully long in my short term account. Going long in my long term account. Go bulls!
I am being a bit more cautious. I want to see us clear and close above 2186 before I make any long trades. Even then, I remain disinclined to hold positions overnight in this unpredictable market. But that’s just me! 🙂
I am trying to focus much more towards a couple of months down the road. I am not interested so much in the day to day movements. That being said, I have stops set at 2140 or equivalent.
I am off for the day. Have a great weekend Vern and everyone else.
You too Rodney. Great to have you back on the board! 🙂
Now where is our beloved Olga??!!
Looking after herself and recovering from the psychological difficulty of shifting from bear to bull. Mr Market has battered us all around these last months.
I think she’s lurking 🙂
*waves*
Long term account fully bullish now. Go bulls!
Some may wonder why I am so bullish when it seems the market should be bearish. My thought is this, EW is fundamentally based solely on price. Price alone is the ultimate indicator. Price has been telling us the market is going higher. So despite what looks like a world and US economy on the brink of disaster combined with many TA indicators indicating weakness in the equity markets, I stick with EW and price.
If and when EW and price tell us the market is moving to a bearish trend, then I will switch. Until then, Go Bulls!
I do agree with that viewpoint. I am however, terrified of black swans…! 🙂
Yea… So, the Bear Counts Failed! What makes you all think these Bull Counts won’t fail as well??? Can anyone place a 100% certainty on these Bull Counts???
I believe there is a count hiding in the muck of it all… that is counter to all this bullishness. At some point that count will materialize. If there is any ONE thing I learned in paying for and reading all the EW services and free stuff on internet the last several years… is that another Count always materializes or “comes to light” at some point. It’s just a question on when. But I could be wrong… right? That’s what makes a market! At least that is what use to make a market! These days I am not so sure!
The larger trend (I mean monthly now) is up.
So any EW count is going to have to see this upwards move as a first wave, third wave, fifth wave or C wave.
For all of those there are only two structural possibilities. An impulse or a diagonal.
Which is the two wave counts I have.
As bearish as I am, I agree the trend is up and the structure is incomplete, so Rodney’s taking a long position makes perfect sense if one has any confidence whatsoever in EW analysis. I have to be a bit more cautious as I generally trade options and have to deal with the thorny issue of time decay. Expanded flats are the absolute worse structures for trading options unless you are very nimble. Unless you trade using time frames several months out, trying to make directional trades on expanded flat is a sure way to loose money. I am trying to learn how to recognize the C waves of the flat as they seem to offer the best entry point. That however, is much easier said than done…
The question of the reliability of the bullish signals and counts we are now seeing is indeed an intriguing one and your point in that regard is well taken Joe. We were all after all so certain that the bear count would be borne out. I think the key is that we eventually got incontrovertible evidence that it was incorrect once the count was invalidated with a new high.
The same applies for the current bullish wave count. There is a number that will tell us conclusively that it is incorrect or that it is complete. As Lara says, assume the trend remains the same until PROVEN otherwise. The habit of SPX to drop out of, then clamber back into channels does make this quite a challenge. Personally I think we are in a final wave up, and I suspect, for several reasons, that it is an ending diagonal. While my plan is to continue to scalp the upward moves, my larger objective to to build a sustainable short position. Since I do not know when the market will put in a top, any option trades other than leaps pose unacceptable risk. I have decided actual VIX shares offer the very best reward/risk ratio and since the shares have never seen forward or reverse splits, and a reversion to the mean is a rule that not even banksters can nullify, if one can be patient, I think it is a plan that will ultimately pay off well.
Bouncing off support at 2176 so that should be it so far as the mini bear trap is concerned. Sold 1/4 VIX shares at 12.24. Will buy back at limit of 10.75
Surprise surprise! Monte Paschi is now being investigated for fraudulent accounting in the years prior to their seeking a government bailout. Who would’a thunk it??!!
Sometimes when the market behaves in a listless manner as we are seeing it could be telegraphing impending developments which while not yet front and center in the news, nevertheless will have a big impact on the market as more widespread reporting begins.
I continue to be amazed at the utter silence of the Western so-called news media on what is happening in Crimea, and the imminent collapse of major German and Italian financial institutions. Caveat Emptor!
Futures down slightly. Let’s hope it is just another bankster feint to keep traders off balance as minor two continues. I will be keeping a sharp eye on volume during the pullback. I would be quite surprised if yet another indicator, OBV issued a false
TA signal as it has been one of the few ones working reliably of late. There are a few rules for calculating it but it essentially the net of volume during market declines vs market upswings, with rising volume in an absence of price decline resulting in a net OBV gain. Any strong move to the down side today would proabably negate the bullish OBV signal. The very best case for the bulls would be a bullish engulfing candle as that would in my view confirm the bullish count. I will once again be selling 1/4 of my VIX position on any move above 12.50, and placing “stink bids” for SPY 18.50 calls at 20-30% below the current offer, or at the market if I see an intra-day reversal in VIX.
It has to be quite clear to everyone that the market makers are engaged in an on-going game of “whack-a-mole” and unless you take profits intra-day, you are likely to get whacked! Make ’em an offer they can’t refuse…. 🙂
I was thinking about the fact that traders will often view a high volume day with no upward movement as a distribution event and bearish. This really should not result in a false OBV signal as the rules for calculating it says when the closing price does not change OBV should remain the same as the previous day. Just thinking out loud… 🙂
I suspect todays down day is going to bring OBV down to find support at that trend line for a back test.
If we then get another up day and OBV moves up and away from the line that would be a really strong bullish signal from OBV.
I’d be adding to my long position then for sure.
Yep. That also is my plan. I want some strong evidence we are not about to start an intermediate second wave of a larger ED and for that I want to see an new high above 2193.81
Thanks, Lara, for the excellent video and analysis.
Here’s hoping the 3rd of a 3rd of a 3rd shows a little life!
You’re welcome. And congrats on being first. Although The Doc may be along shortly to point out you didn’t claim with the word “first” so it may be …. invalid 🙂
Its a gold for Ron U,, he has a great first name,,