
Downwards movement was unexpected and invalidated the hourly Elliott wave count.
Summary: The trend remains the same, until proven otherwise. Assume the trend is up while price is above 2,147.58. In the short term, expect a small correction to end about 2,162 – 2,159. The mid term targets are 2,332 or 2,445. If price makes a new low below 2,147.58, then probability will shift to a deep pullback beginning, target zone 1,941 to 1,883. At this stage, a deeper pullback looks very unlikely. There is not enough selling pressure which would be required to push price lower.
Last monthly chart for the main wave count is here.
New updates to this analysis are in bold.
MAIN WAVE COUNT
WEEKLY CHART
Click chart to enlarge.
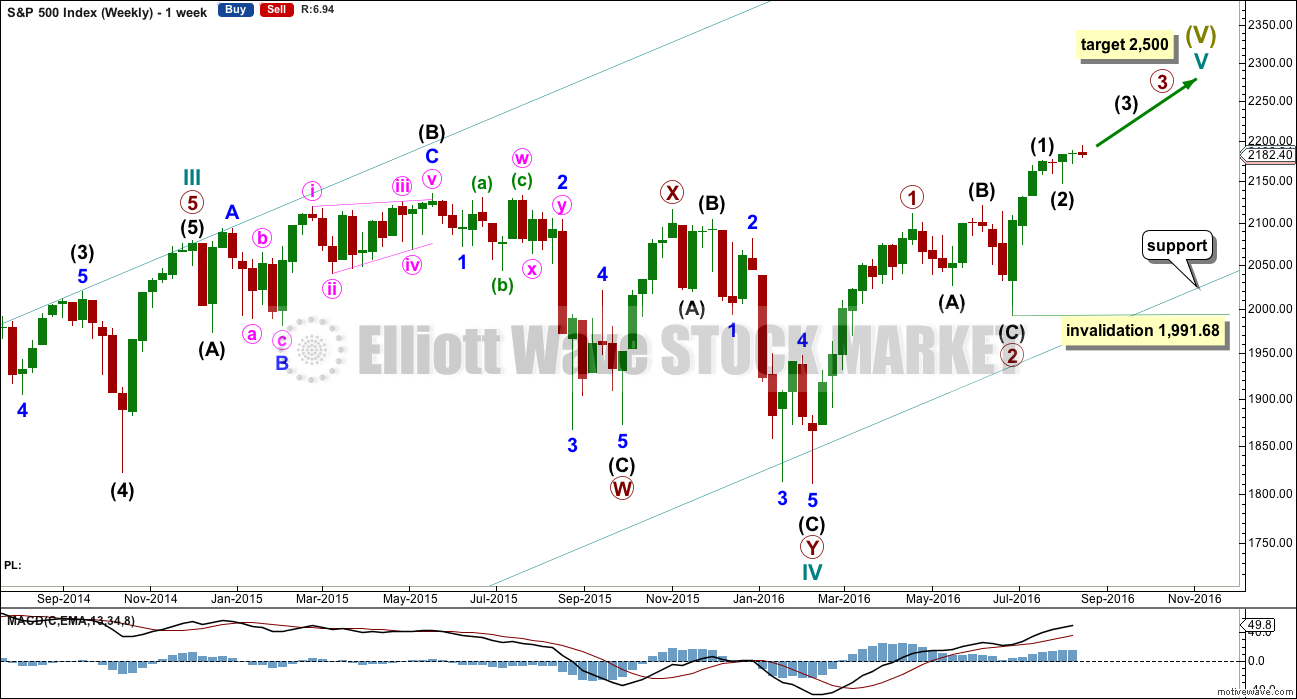
Cycle wave II was a shallow 0.41 zigzag lasting three months. Cycle wave IV is seen as a more shallow 0.28 double combination lasting 15 months. With cycle wave IV five times the duration of cycle wave II, it should be over there.
Cycle wave I lasted 28 months (not a Fibonacci number), cycle wave II lasted a Fibonacci 3 months, cycle wave III lasted 38 months (not a Fibonacci number), and cycle wave IV lasted 15 months (two more than a Fibonacci 13).
If the target for cycle wave V is for it to be equal in length with cycle wave I, then it may also be expected to be about equal in duration. So far cycle wave V is in its sixth month. After this month, a further 22 months to total 28 seems a reasonable expectation, or possibly a further 15 months to total a Fibonacci 21.
This first weekly wave count expects the more common structure of an impulse is unfolding for cycle wave V. Within cycle wave V, primary waves 1 and now 2 should be over. Within primary wave 3, no second wave correction may move beyond its start below 1,991.68. If price makes a new high above 2,203.68, then that would provide enough confidence that intermediate wave (2) should be over to move the invalidation point on the weekly chart up to 2,147.58.
There is one other possible structure for cycle wave V, an ending diagonal. This is covered in an alternate.
DAILY CHART
Click chart to enlarge.
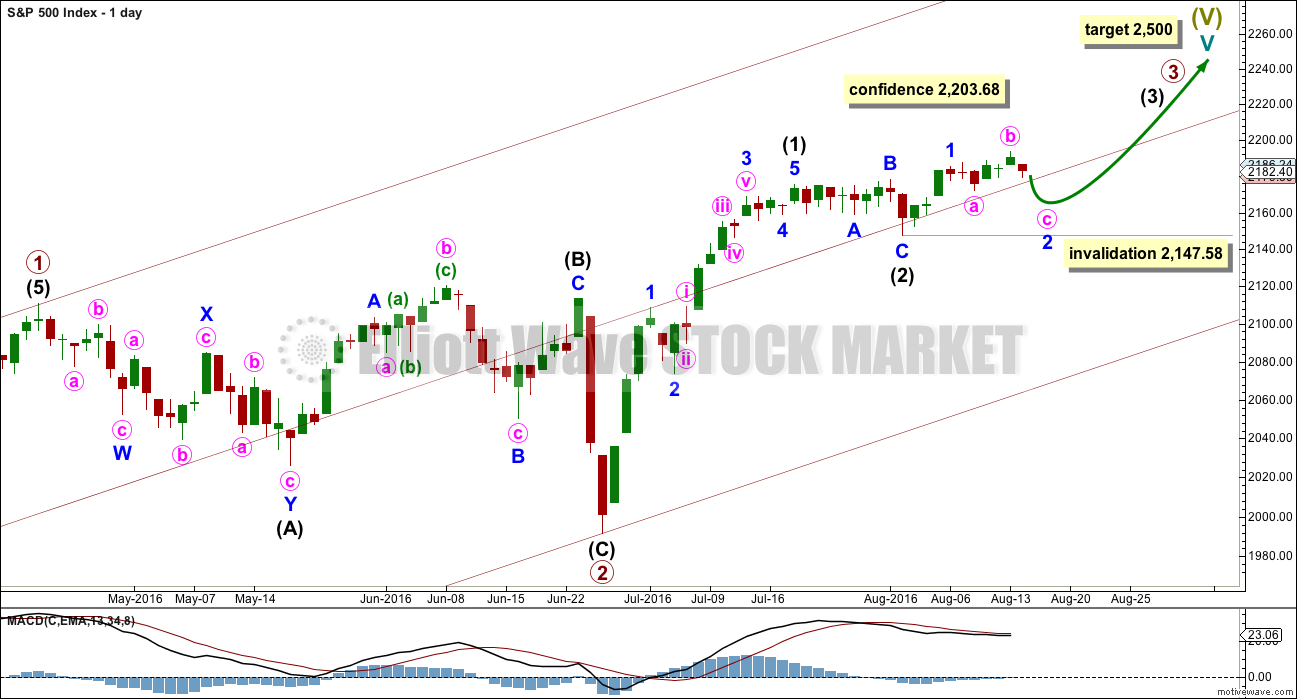
Primary wave 2 is complete as a shallow regular flat correction. Primary wave 3 is underway.
Within primary wave 3, intermediate wave (1) is a complete impulse. Intermediate wave (2) may now be a complete flat correction.
It is still possible that intermediate wave (2) may not be complete and could continue sideways and a little lower. A deep pullback would not be expected, only a sideways combination, double flat or slightly lower expanded flat would be indicated. If price moves above 2,203.68, then upwards movement would be more than twice the length of intermediate wave (2). At that stage, the probability that upwards movement is a B wave within intermediate wave (2) would be so low the idea should be discarded. A new high above 2,203.68 would add confidence in the upwards trend.
Within intermediate wave (3), no second wave correction may move beyond its start below 2,147.58.
Add a mid line to the base channel drawn about primary waves 1 and 2. Draw this channel from the start of primary wave 1 (seen on the weekly chart) to the end of primary wave 2, then place a parallel copy on the end of primary wave 1. The mid line may provide some support along the way up.
At this stage, it looks most likely that intermediate wave (3) has begun. It should be expected to show the subdivisions of minor waves 2 and 4 clearly on the daily chart with one to a few red daily candlesticks or doji. With minor wave 2 now showing as two red candlesticks and one doji, this wave count so far has a typical look.
HOURLY CHART
Click chart to enlarge.
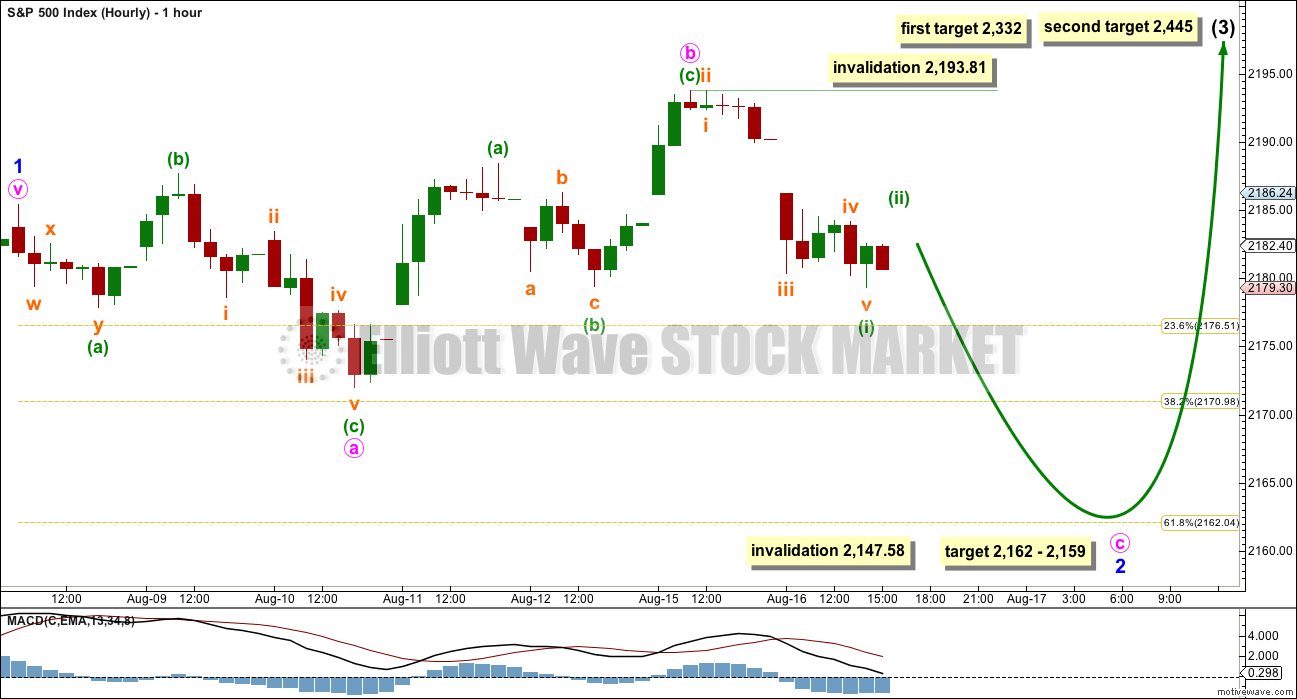
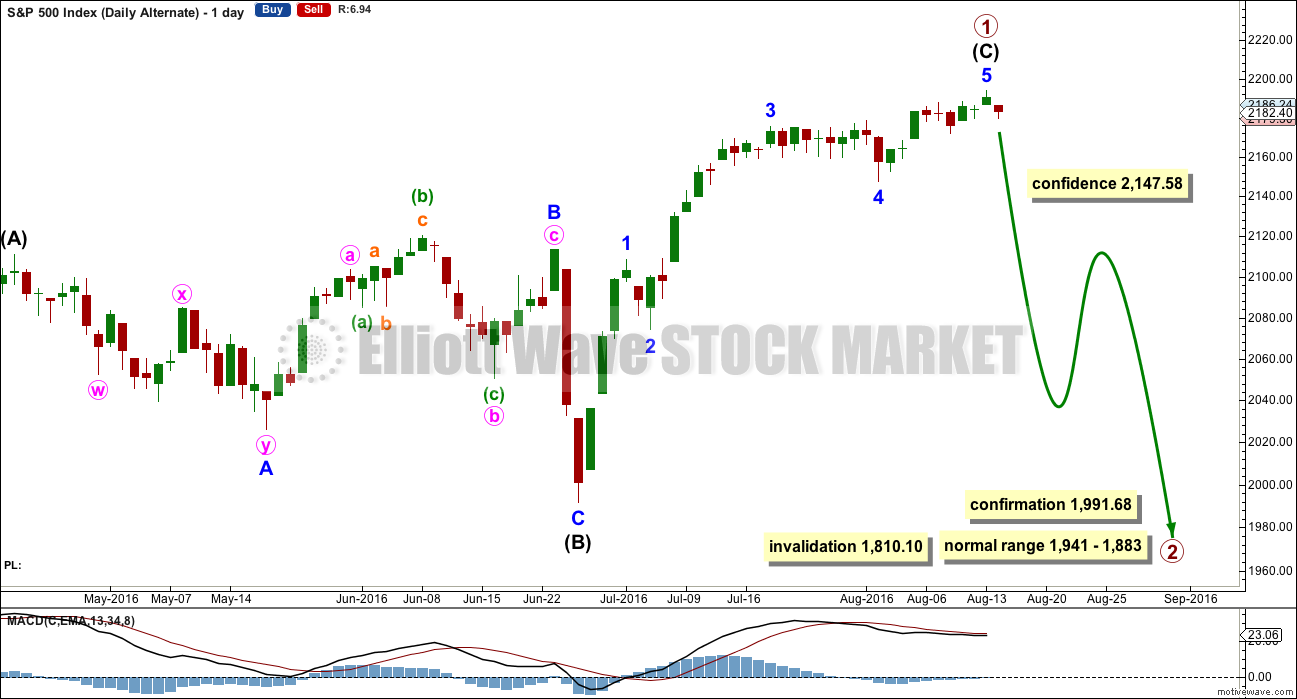
Minor wave 1 is still a complete five wave impulse. Minor wave 2 now looks to be incomplete. It may be unfolding as an expanded flat correction.
Within minor wave 2, both minute waves a and b subdivide as threes. Minute wave c must be a five wave structure and is very likely to make at least a slight new low below the end of minute wave a at 2,172 to avoid a truncation and a very rare running flat.
Within minor wave 2, minute wave b is a 1.62 length of minute wave a. This is longer than the normal range of 1 to 1.38 but within allowable conventional limits of up to 2 times the length of minute wave a.
At 2,159 minute wave c would reach 2.618 the length of minute wave a. This is close to the 0.618 Fibonacci ratio at 2,162 giving a 3 point target zone.
Within minute wave c, the correction for minuette wave (ii) may not move beyond the start of minuette wave (i) above 2,193.81.
Mid term targets for intermediate wave (3) remain the same. At 2,332 intermediate wave (3) would reach equality in length with intermediate wave (1). If price keeps rising through this first target, or if when it gets there the structure is incomplete, then the second target would be used. At 2,445 intermediate wave (3) would reach 1.618 the length of intermediate wave (1).
ALTERNATE WAVE COUNT
WEEKLY CHART
Click chart to enlarge.
This alternate may again diverge from the main wave count, so it will again be published.
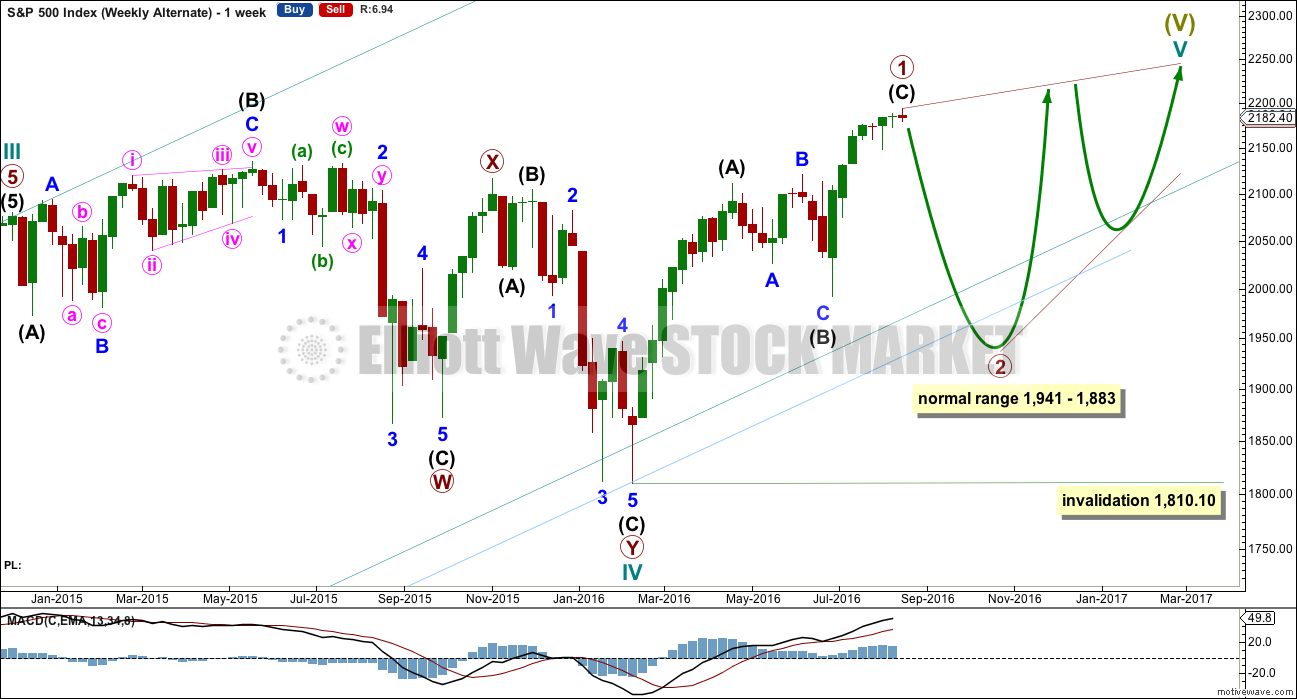
The other structural possibility for cycle wave V is an ending diagonal. Ending diagonals are more often contracting than expanding, so that is what this alternate will expect.
Ending diagonals require all sub-waves to subdivide as zigzags. Zigzags subdivide 5-3-5. Thus primary wave 1 may now be a complete (or almost complete) zigzag, labelled intermediate waves (A)-(B)-(C) which subdivides 5-3-5.
The normal depth for second and fourth waves of diagonals is from 0.66 to 0.81 the prior actionary wave. Primary wave 2 may end within this range, from 1,941 to 1,883.
Primary wave 2 may not move beyond the start of primary wave 1 below 1,810.10.
When primary wave 2 is a complete zigzag, then another zigzag upwards for primary wave 3 must make a new high above the end of primary wave 1. It would most likely be shorter than primary wave 1 as diagonals are more commonly contracting. If primary wave 3 is longer than primary wave 1, then an expanding diagonal would be indicated.
The psychology of diagonals is quite different to impulses. Diagonals contain corrective characteristics and subdivide as a series of zigzags. When diagonals turn up in fifth wave positions, they take on some of the properties of the correction which inevitably follows them. The deterioration in fundamentals and underlying technicals is more extreme and more evident. There is some support for this idea at this time.
The final target of 2,500 would not be able to be reached by an ending contracting diagonal. The final target for this alternate would be calculated only when primary wave 4 is complete.
The classic pattern equivalent is a rising wedge.
DAILY CHART
Click chart to enlarge.
It is possible now that intermediate wave (C) is a complete five wave impulse. However, this wave count suffers from disproportion between minor waves 2 and 4 which gives this possible impulse an odd look. It looks like a three where it should look like a five. However, the S&P just does not always have waves which look right at all time frames.
Because this wave count expects to see a substantial trend change here from bull to bear for a multi week deep pullback, it absolutely requires some indication from price before confidence may be had in it. A new low below 2,147.58 would add confidence.
At this stage, there is not enough selling pressure to support this wave count. When the market has fallen recently, it has fallen of its own weight. For a deep pullback sellers would have to enter the market and be active enough to push price lower. That is not happening at this time.
TECHNICAL ANALYSIS
WEEKLY CHART
Click chart to enlarge. Chart courtesy of StockCharts.com.
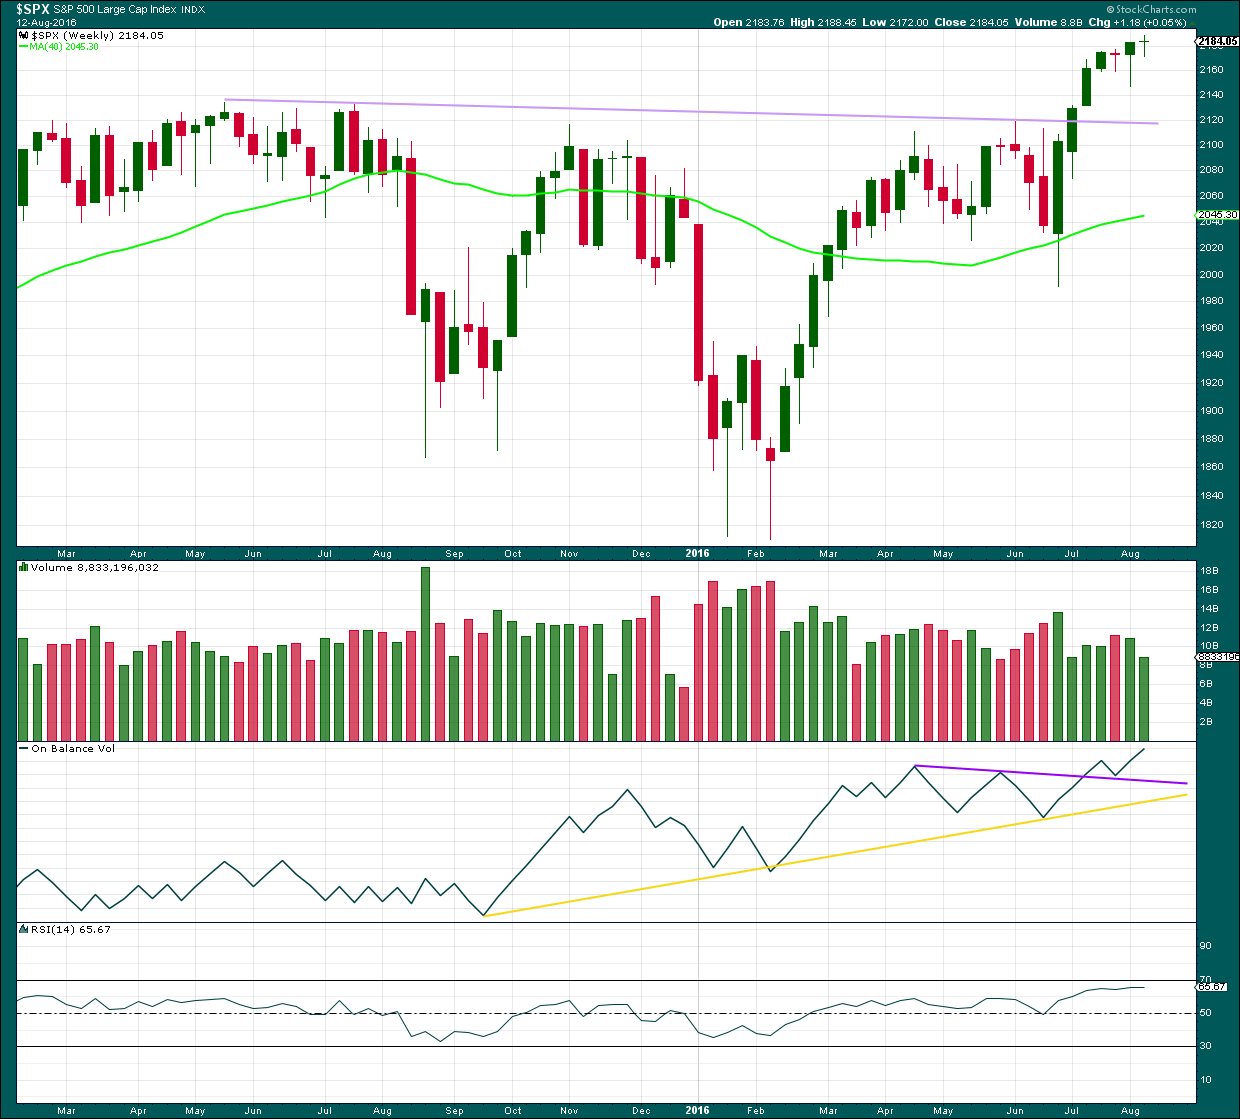
Last week ends with a small green doji candlestick. The week before completed a possible hanging man, but the green real body and the long lower wick (bullish) require bearish confirmation from the next candlestick before the pattern can be read as a bearish reversal pattern. That has not happened, so both weekly candlesticks should now be read as bullish.
Last weekly candlestick comes with lighter volume. A decline in volume along with a doji candlestick indicates that price movement for the week may have been more consolidation than trend.
On Balance Volume is bullish while it remains above both trend lines. There is no divergence between price and OBV last week to indicate any weakness in price, both made new highs.
RSI is flat and not extreme. There is room for price to rise further.
DAILY CHART
Click chart to enlarge. Chart courtesy of StockCharts.com.
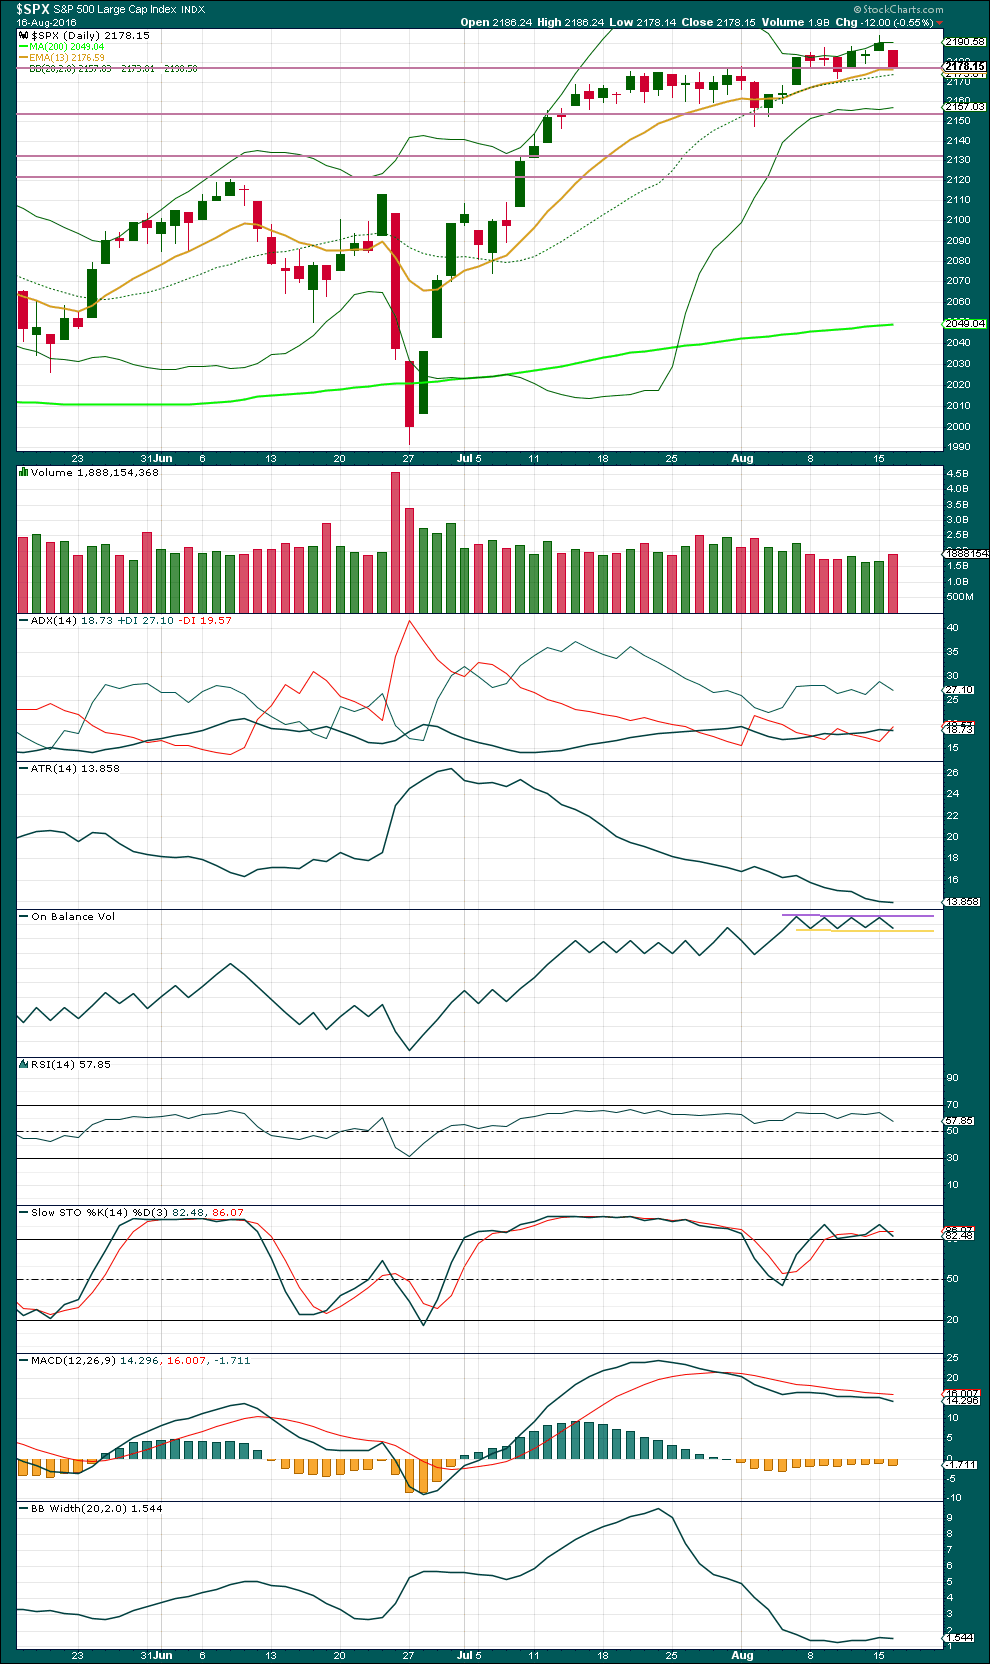
Today’s strong red daily candlestick completes a bearish Tower Top reversal pattern. With volume supporting today’s downwards movement, the reversal implication of this pattern is stronger. It indicates a trend change from up to either sideways or down. It makes no comment though on how far down price may move from here.
The fall in price today is supported by volume. This indicates more downwards movement is very likely from here and supports the hourly Elliott wave count.
Price may find some support about 2,175. If price breaks through this support line, then the next line is at 2,150.
ADX is today flat indicating the market is not trending. ATR is still declining in agreement.
On Balance Volume is still constrained between resistance at the purple line and support at the yellow line. A break out from this range by OBV may precede a break from price.
RSI is not extreme. There is room for price to rise or fall.
Stochastics is extreme. Some downwards movement from here, if the market is not trending, may be expected.
MACD shows a decline in momentum over the last few weeks. Bollinger Bands indicate the market is consolidating.
Overall, price is at support but short term volume has been fairly reliable lately. The rise in volume today suggests more downwards movement, so it should be expected that price may break through support here. If price reaches back down to 2,150 and shows any weakness from volume, then the downwards swing should be expected to end there.
VOLATILITY – INVERTED VIX CHART
Click chart to enlarge. Chart courtesy of StockCharts.com.
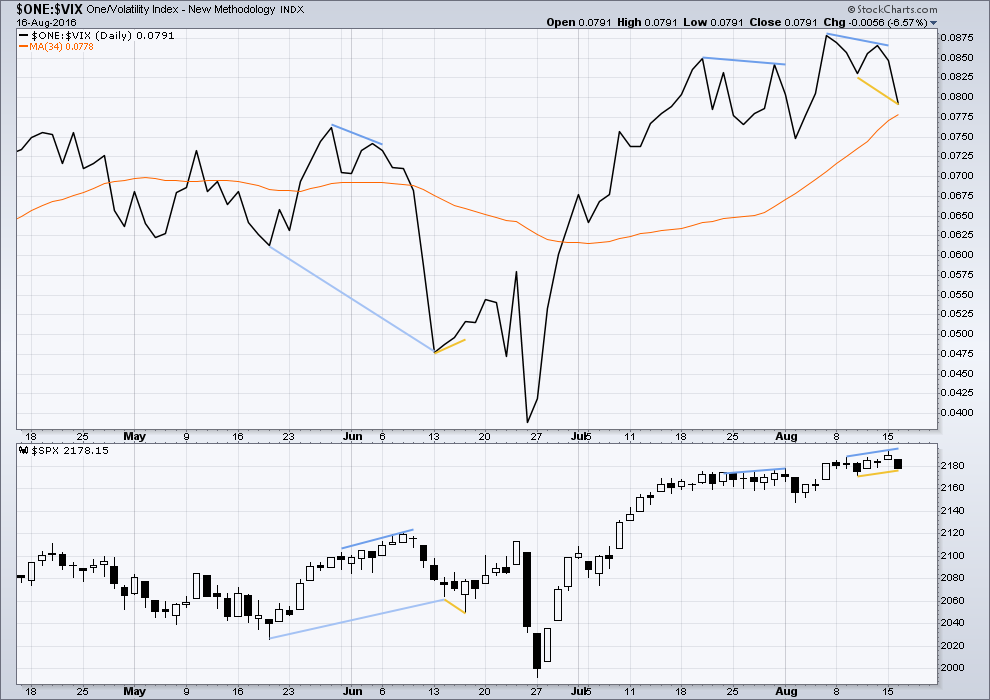
Volatility is declining as price is rising. This is normal for an upwards trend.
There are a few instances of multi day divergence between price and inverted VIX noted here. Bearish divergence is blue. Bullish divergence is yellow. Each of these instances was followed by expected price movement if only for two days. Divergence with VIX and price is not always working, but it is still sometimes working. So it will be noted.
There was bearish divergence between price and inverted VIX from the high of 9th August to the high of 15th August. Price has made new highs, but inverted VIX has failed to make corresponding new highs. This indicates some weakness to price. This divergence has been followed so far by at least one day of downwards movement from price, so it may again be working. It will again be given some weight in analysis.
There is bullish divergence between price and inverted VIX today: from the last small swing low on 10th August price has made a higher low and inverted VIX has made a lower low. This indicates weakness to downwards movement.
This small bullish divergence may disappear, or may become stronger before the resulting upwards movement. For today the prior bearish divergence may still push price lower. This bullish divergence today does not support the Elliot wave count.
BREADTH – AD LINE
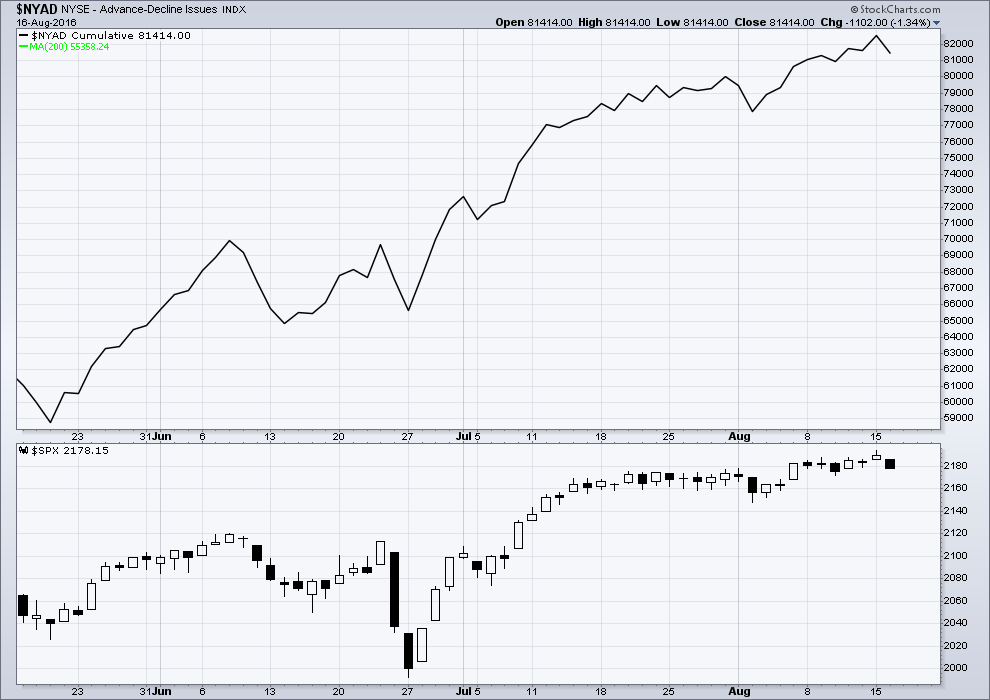
Click chart to enlarge. Chart courtesy of StockCharts.com.
There is support from market breadth as price is rising. The AD line shows no divergence with price; it is making new highs with price. Both price and the AD line moved lower today.
DOW THEORY
Major lows within the prior bull market:
DJIA: 15,855.12 (15th October, 2014) – closed below on 25th August, 2015.
DJT: 7,700.49 (12th October, 2014) – closed below on 24th August, 2015.
S&P500: 1,821.61 (15th October, 2014) – has not closed below this point yet.
Nasdaq: 4,117.84 (15th October, 2014) – has not closed below this point yet.
Major highs within the new bear market:
DJIA: 17,977.85 (4th November, 2015) – closed above on 18th April, 2016.
DJT: 8,358.20 (20th November, 2015) – has not closed above this point yet.
S&P500: 2,116.48 (3rd November, 2015) – closed above this point on 8th June, 2016.
Nasdaq: 5,176.77 (2nd December, 2015) – closed above this point on 1st August, 2016.
Dow Theory Conclusion: Original Dow Theory still sees price in a bear market because the transportations have failed to confirm an end to that bear market. Modified Dow Theory (adding S&P and Nasdaq) has failed still to confirm an end to the old bull market, modified Dow Theory sees price still in a bull market.
This analysis is published @ 11:21 p.m. EST.
hey,, wheres Olga,, missing her smiling face,, its true, I can see your faces,, I’m psychotic
LOL
She’s taking a bit of a break from this market. The switch from bear to bull is hard.
She’s okay, still lurking
*waves*
You know, it has been so hard to switch from staunch bear to bullish. that you and I may be the only bulls here. And I am very skeptical worrying that at any moment it can turn down hard. Interesting how psychology impacts us.
The structure of minor 2 is now complete. Minute c subdivides as a five, with an extended fifth wave.
Now this market should darn well move.
Come on S&P… move!
(either way TBH, but lets get some decent range happening)
I like to move it! move it!
I like to….Move It!
(Sorry I could not resist!) 🙂 🙂 🙂
hee hee,, that Verne,,, he likes to move it,,, good one Verne,,, apology accepted..grin
Darn. I couldn’t get back to my desk in time today to open those new longs. Will need to wait until the morning.
The BB still remain relatively tight. I wish the correction would have opened them more. Now we are staring at the upper BB at the 2200 round number pivot. Let’s see if the first try can punch through.
SPY calls moving in the right direction so holding for now. I really hate holding ’em overnight but so far as I can tell the direction remains up. Have a great evening
everybody!
Looking at a similar period of BB compression that begun last April, this could go on for a many more weeks. The current compression is tighter so the subsequent BB expansion should exceed what we saw in June.
I have to say in all honesty folks, I really am not feeling this move up. We are still in the consolidation zone and the start of a new impulse up should be tearing to the upside. I will hold my positions for another 30 minutes but Mr Market looks like he is pulling my chain TBH…. 🙂
July 7 did print a spinning top ahead of the move higher so maybe this is much ado about nada…
Russell,
I am with you on the GILD. Have been building a position in this stock last couple of weeks.
We need to fill gap from this morning’s open and do so quickly or I am going to start toget really antsy – 2178.16 for SPX
VIX continuing to signal correction is over. This is not the way it behaves during a sustained move to the downside- it prints full fat candles and it is certainly not doing that today. Holding long positions until proven otherwise with a take out of today’s lows.
Wow! Monster bullish candle on the one minute chart!!!
Is is really quite sad how useless the American media outlets have become. Nobody is reporting we have a hot war underway, spurred on by warmongers in the
West, between Russia and Ukraine. This could easily turn into a black swan event that blows up equities markets.
Obviously if we take out today’s lows I am out like a cat on a hot tin roof…. 🙂
Buying August 26 SPY 218.50 calls for 0.95 per contract.
Selling December 30 160/170 bull put spread for 0.30 per contract.
I have to say I am still a bit suspicious as the BB compression is indicating one hell of a move and if it is going to be to the upside as per the wave count, it is coming after a substantial run higher having already occurred. I do think if we print green today we just have to accept that it is what it is – the threshold of a third wave up. I don’t like the fact that we did not get a futures heads up but maybe we get that tonight…
Any chance that was minute wave 2 of an ED? I believe that count is a possibility isn’t it?
Nope. The bullish count is a go. Long upper wick on VIX saying this is all she wrote. Getting ready to grab SPY calls….
Lower wick on SPX saying the same thing…we are going up…
Minute 2 wave down completed at today’s low is what I meant. Minute wave 1 started from the lows on 8/2 and completed recently (8/15) at new 52 week high, which would mean that minute wave 3 up is now under way. I ask because minute wave 1 looks like a 3 wave structure to me.
Oh. My bad. I think for the ED we would go a LOT lower for wave two.
We need one more low under 2168.50 to end this impulse and if the bullish count is right, we should head straight North with nary a pause and print a green candle today. If that happens, its all aboard for the bullish ride toward 2200 at least! Go bulls! 🙂
A close of 2164.25 gap from August 4 close means the ED case is looking more likely imo.
I will be entering fully short if that happens today.
The expanded flat continues to be the probably wave form to reflect the on-going attempts by market mavens to keep traders off-balance and separate them from their capital. VIX is starting to fly a cautionary flag for the bullish case. Instead of selling my remaining VIX shares, selling April 24 14.00 strike calls for 1.15 on half of position and using half proceeds to buy 15.00 strike calls. SPX 2147.58 remains critical to near term market direction. If we break it today I am buying back those calls.
It also now clear that my assumption that the volatility upper BB trigger no longer worked was premature. A short of SVXY following my guidelines for a month out expiration would be sitting on a very nice gain on the trigger of August 9
For the second time in the last few days, I am seeing these monstrous candles on the five minute charts that end up being green after a massive spike down. What gives??!!
If this market is truly bullish, I’m thinking that there will be stock rotation into some of the beaten up stocks that have good fundamentals. So, from my perspective, it appears that GILD is breaking above its downward trendline and could be looking to fill the recent gap which is near the 50/200 day moving averages. P/E ratio is really good for this one…
On the downside, it appears that IWM and the Russell 2000 will lead the way if we are bearish (it is the lagging index today). So, TNA would drop a pretty good amount, maybe 10-15%…
Really tough to trade this market as it’s been noted…anyway, I’m trying to play both sides with options…
Looking for a turn to develop around here. Let’s see if it materializes.
Look for the PPT to show up like clock-work around 10.00 Central to try and put a floor under the market. If it keeps going down past then we could have a deeper correction unfolding. Gotta love those banksters…they are SO predictable… 🙂
With the sell off from the past 2 days, can we speculate that the banksters are done supporting this market for now? Are we going to see some trading ranges and follow through again? That would be a welcome site.
Opened a buy stop at SPX 2190.16 which represents a fill of open gap from Monday’s close. Target around 2200-2250
Selling another quarter of VIX shares at 13.16.
If VIX closes at the high today or breaks 2147.58 intra-day will be buying a truckload of UVXY call options as well as shorting SVXY with a 2 point hard stop.
Lara,
In your today’s summary, “Assume the trend is up while price is above 2,172. In the short term, expect a small correction to end about 2,162 – 2,159”.
It is a small correction when SPX pulls back to 2,162 – 2,159. It means trend is up.
But, “Assume the trend is up while price is above 2,172”. It means trend is not up if SPX is below 2,172 such as 2,162 – 2,159.
It looks like a little contradiction between above two statements. What is your exact mean?
The lower target for minute C of 2159 would in all likelihood be met intra-day so the closing price I would expect to move back above 2172 to confirm the upward trend remains in place. If the trend has changed from up to down, we should see a break of 2147.58 tomorrow, making the alternate count more likely to be unfolding; futures however not showing that to be at all likely…I think the trend will remain up. I will be gong long at tomorrow’s low or as close to it as I can determine.
My plan is to look towards adding to my long positions over the next couple of days. I will watch the action to look for a low that will hold. ST account to 100%. IT account to 100% and LT account to 50%. Or something like that. SPX equivalent of 2140+ will be my stop loss on all positions. Go bulls!
I should have stated I will add to my longs if, in fact, a pullback to the 2155 area materializes.
Yep. A break and close below 2150 would put a pause on any bullish trades for me.
You’re right, it doesn’t make sense.
I am very sorry. That needs to be fixed.
I have changed 2,172 to 2,147.58
First (english)
premier (french)
Primero( spanish)
gold medalist Jules,, silver medalist Doc, and the bronze goes to???