
A little downwards movement to 2,171 – 2,168 was expected before the resumption of upwards movement. This is not what happened.
Price moved upwards for the session and did not first make a new low.
Summary: The trend remains the same, until proven otherwise. Assume the trend is up while price is above 2,172. The mid term targets are 2,332 or 2,445. If price makes a new low below 2,147.58, then probability will shift to a deep pullback beginning, target zone 1,938 to 1,881.
Last monthly chart for the main wave count is here.
New updates to this analysis are in bold.
MAIN WAVE COUNT
WEEKLY CHART
Click chart to enlarge.
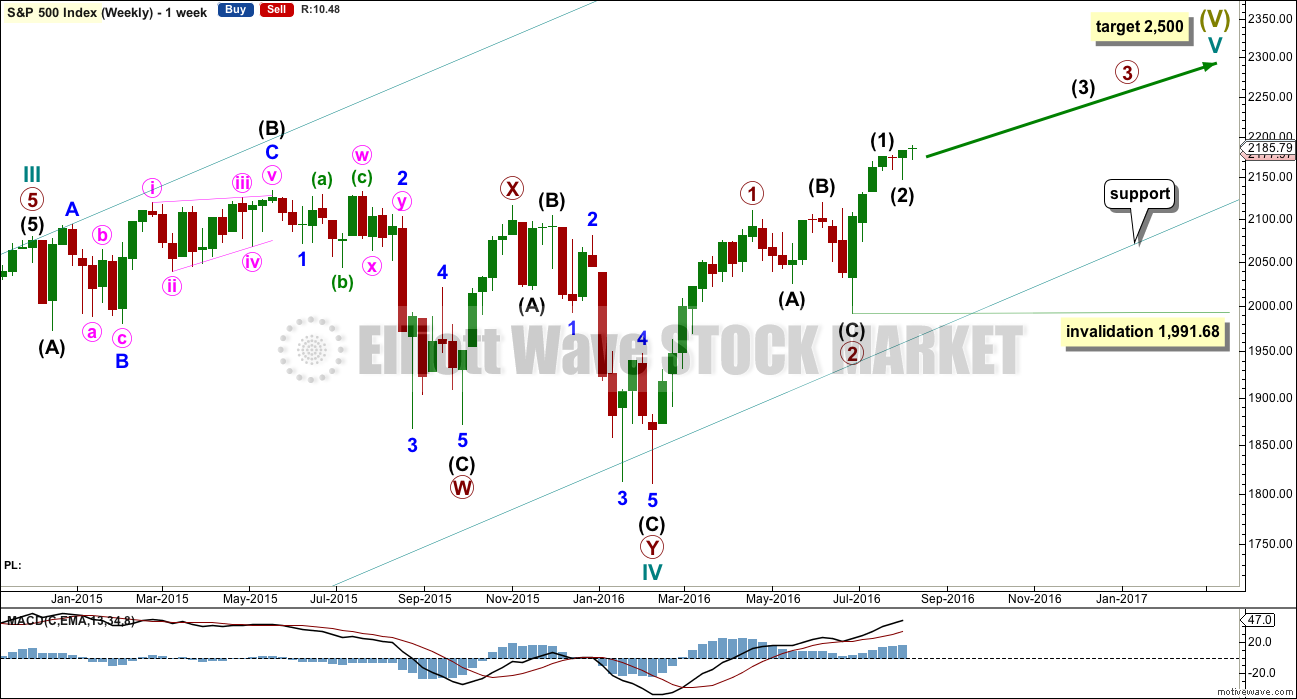
Cycle wave II was a shallow 0.41 zigzag lasting three months. Cycle wave IV is seen as a more shallow 0.28 double combination lasting 15 months. With cycle wave IV five times the duration of cycle wave II, it should be over there.
Cycle wave I lasted 28 months (not a Fibonacci number), cycle wave II lasted a Fibonacci 3 months, cycle wave III lasted 38 months (not a Fibonacci number), and cycle wave IV lasted 15 months (two more than a Fibonacci 13).
If the target for cycle wave V is for it to be equal in length with cycle wave I, then it may also be expected to be about equal in duration. So far cycle wave V is in its sixth month. After this month, a further 22 months to total 28 seems a reasonable expectation, or possibly a further 15 months to total a Fibonacci 21.
This first weekly wave count expects the more common structure of an impulse is unfolding for cycle wave V. Within cycle wave V, primary waves 1 and now 2 should be over. Within primary wave 3, no second wave correction may move beyond its start below 1,991.68.
There is one other possible structure for cycle wave V, an ending diagonal. This is covered in an alternate.
DAILY CHART
Click chart to enlarge.
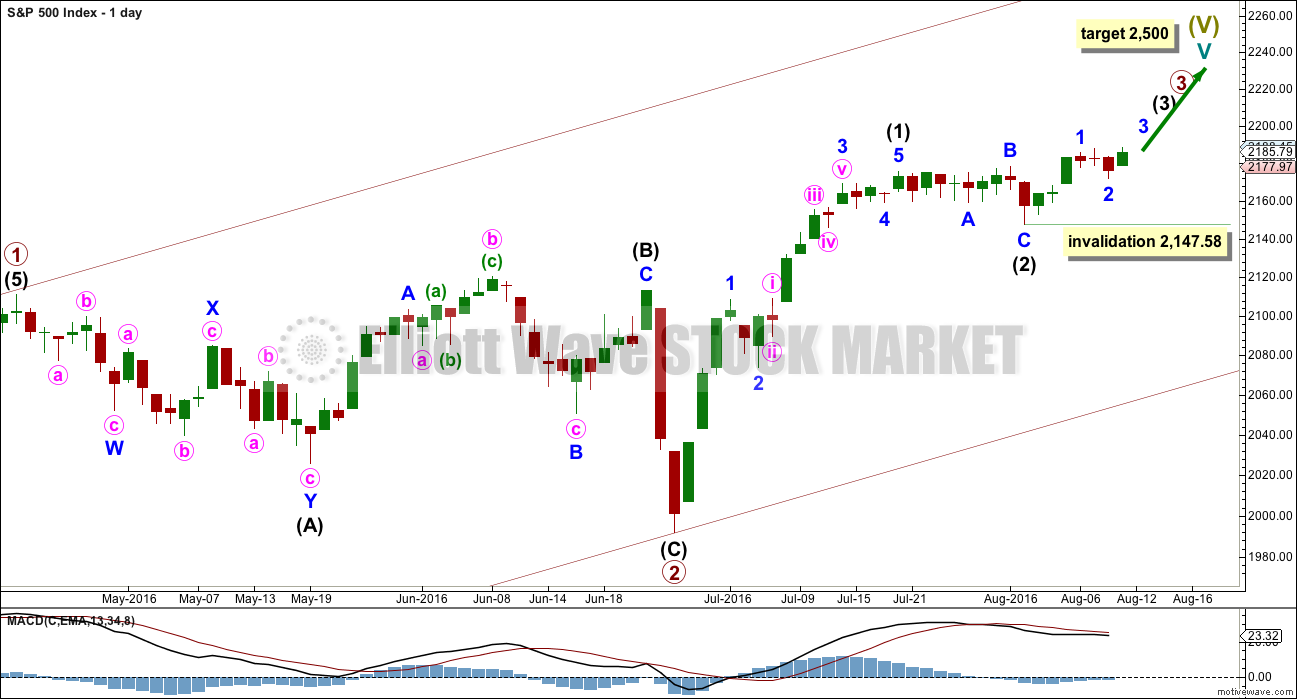
Primary wave 2 is complete as a shallow regular flat correction. Primary wave 3 is underway.
Within primary wave 3, intermediate wave (1) is a complete impulse. Intermediate wave (2) may now be a complete flat correction.
If the degree of labelling within intermediate wave (2) is moved down one degree (alternate labelling), then it is still possible that only minor wave A is complete as a flat correction. It is possible that intermediate wave (2) may complete further sideways as a longer lasting flat correction, or a double flat or double combination. All options would expect sideways movement though, not a deep pullback.
Within a possible continuation of intermediate wave (2), there is no upper invalidation point for the idea because there is no rule stating a limit for a B wave within a flat. There is a convention within Elliott wave that states once the possible B wave is longer than twice the length of the A wave the probability that a flat is unfolding is so low the idea should be discarded. Here that price point would be at 2,203.68.
Above 2,203.68 more confidence in this wave count and the targets may be had.
Intermediate wave (2) may not move beyond the start of intermediate wave (1) below 1,991.68.
At this stage, it looks most likely that intermediate wave (3) has begun. It should be expected to show the subdivisions of minor waves 2 and 4 clearly on the daily chart with one to a few red daily candlesticks or doji. With minor wave 2 now showing as two red candlesticks and one doji, this wave count so far has a typical look.
HOURLY CHART
Click chart to enlarge.
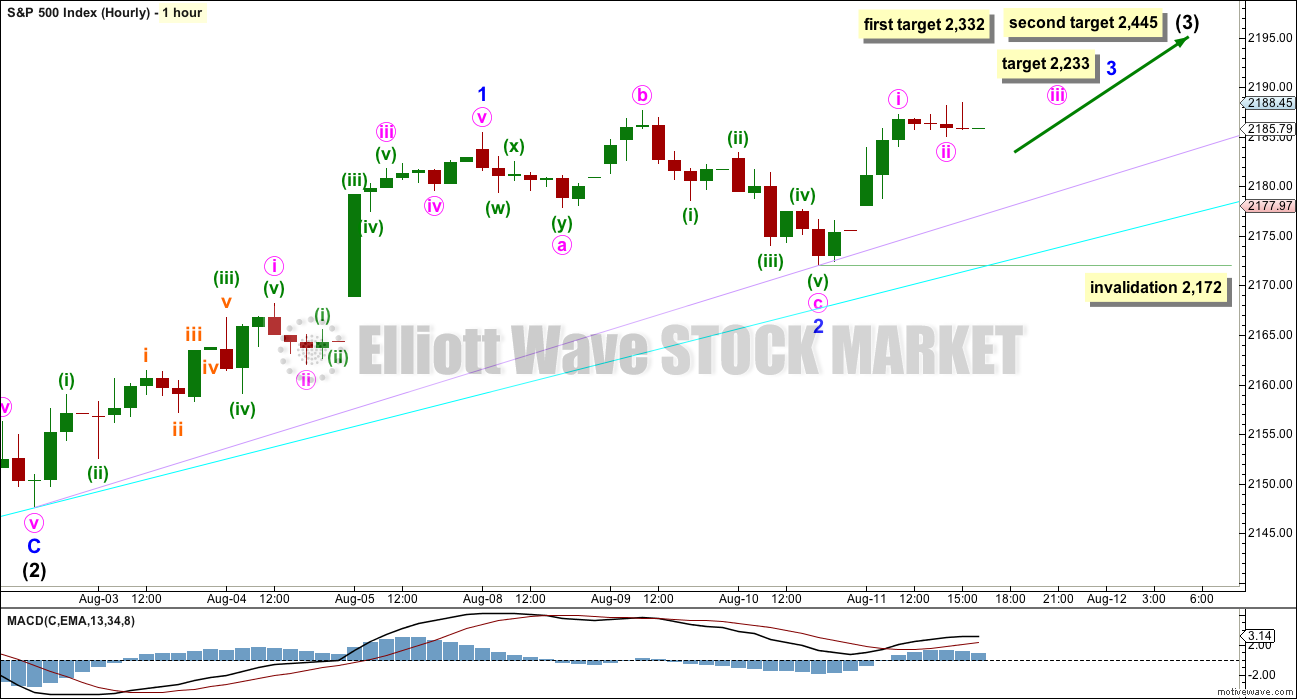
Minor waves 1 and 2 now look very likely to be complete. Minor wave 3 may have begun on Thursday’s session.
At 2,233 minor wave 3 would reach 1.618 the length of minor wave 1.
Mid term targets for intermediate wave (3) remain the same. At 2,332 intermediate wave (3) would reach equality in length with intermediate wave (1). If price keeps rising through this first target, or if when it gets there the structure is incomplete, then the second target would be used. At 2,445 intermediate wave (3) would reach 1.618 the length of intermediate wave (1).
The cyan support line is drawn from the start of intermediate wave (1) to the end of intermediate wave (2). The lilac support line is drawn from the end of intermediate wave (2) to the end of minor wave 2. These lines may provide support if a deeper correction unfolds.
Minute wave i fits as a complete impulse on the five minute chart. Minute wave ii fits as another expanded flat correction. This wave count now expects to see an increase in upwards momentum over the next few days; upwards movement from price should be supported by volume.
If minute wave ii continues, it may not move beyond the start of minute wave i below 2,172.
ALTERNATE WAVE COUNT
WEEKLY CHART
Click chart to enlarge.
This alternate may again diverge from the main wave count, so it will again be published.
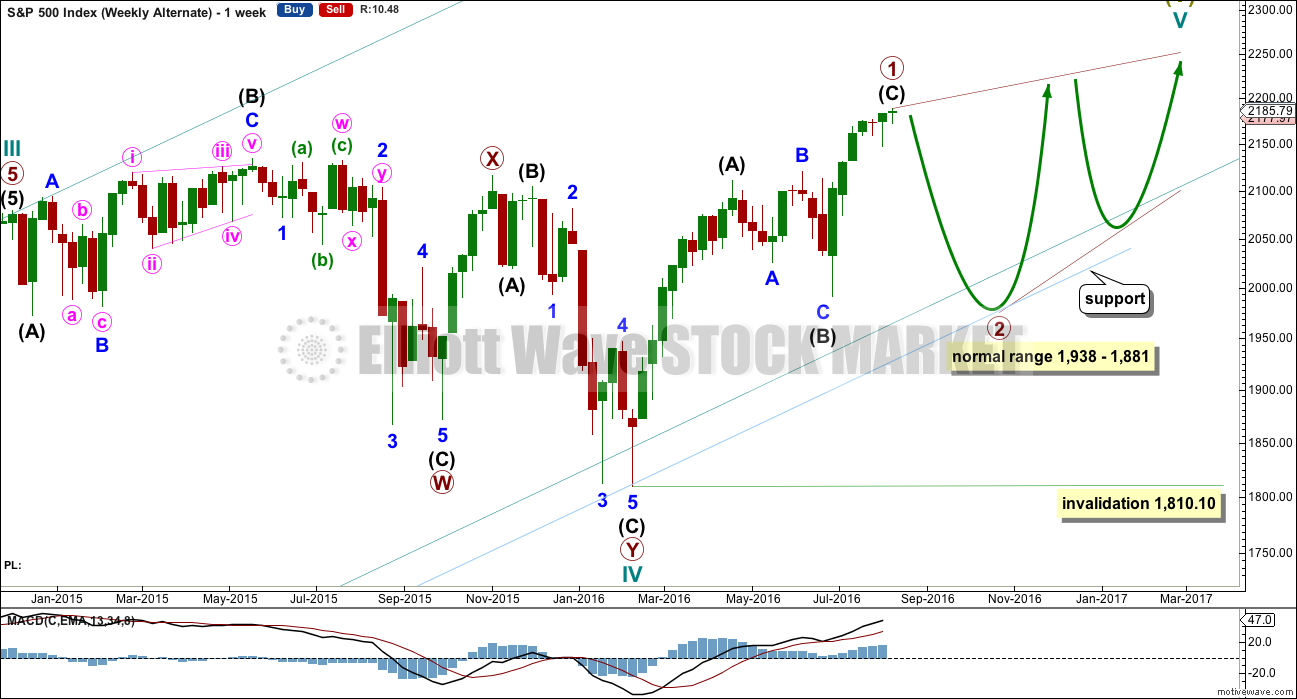
The other structural possibility for cycle wave V is an ending diagonal. Ending diagonals are more often contracting than expanding, so that is what this alternate will expect.
Ending diagonals require all sub-waves to subdivide as zigzags. Zigzags subdivide 5-3-5. Thus primary wave 1 may now be a complete (or almost complete) zigzag, labelled intermediate waves (A)-(B)-(C) which subdivides 5-3-5.
The normal depth for second and fourth waves of diagonals is from 0.66 to 0.81 the prior actionary wave. Primary wave 2 may end within this range, from 1,938 to 1,881.
Primary wave 2 may not move beyond the start of primary wave 1 below 1,810.10.
When primary wave 2 is a complete zigzag, then another zigzag upwards for primary wave 3 must make a new high above the end of primary wave 1. It would most likely be shorter than primary wave 1 as diagonals are more commonly contracting. If primary wave 3 is longer than primary wave 1, then an expanding diagonal would be indicated.
The psychology of diagonals is quite different to impulses. Diagonals contain corrective characteristics and subdivide as a series of zigzags. When diagonals turn up in fifth wave positions, they take on some of the properties of the correction which inevitably follows them. The deterioration in fundamentals and underlying technicals is more extreme and more evident. There is some support for this idea at this time.
The final target of 2,500 would not be able to be reached by an ending contracting diagonal. The final target for this alternate would be calculated only when primary wave 4 is complete.
The classic pattern equivalent is a rising wedge.
DAILY CHART
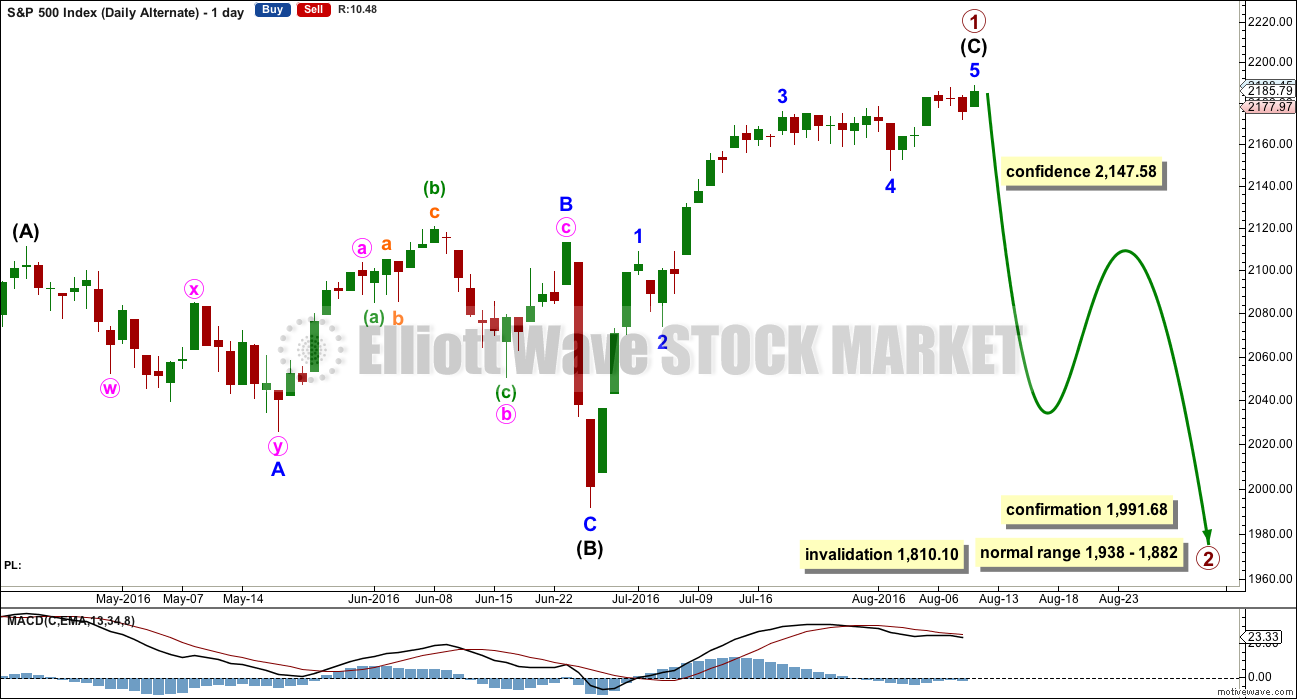
Click chart to enlarge.
It is possible now that intermediate wave (C) is a complete five wave impulse. However, this wave count suffers from disproportion between minor waves 2 and 4 which gives this possible impulse an odd look. It looks like a three where it should look like a five. However, the S&P just does not always have waves which look right at all time frames.
Because this wave count expects to see a substantial trend change here from bull to bear for a multi week deep pullback, it absolutely requires some indication from price before confidence may be had in it. A new low below 2,147.58 this week would add confidence.
At this stage, there is not enough selling pressure to support this wave count. When the market has fallen recently, it has fallen of its own weight. For a deep pullback sellers would have to enter the market and be active enough to push price lower. That is not happening at this time.
TECHNICAL ANALYSIS
WEEKLY CHART
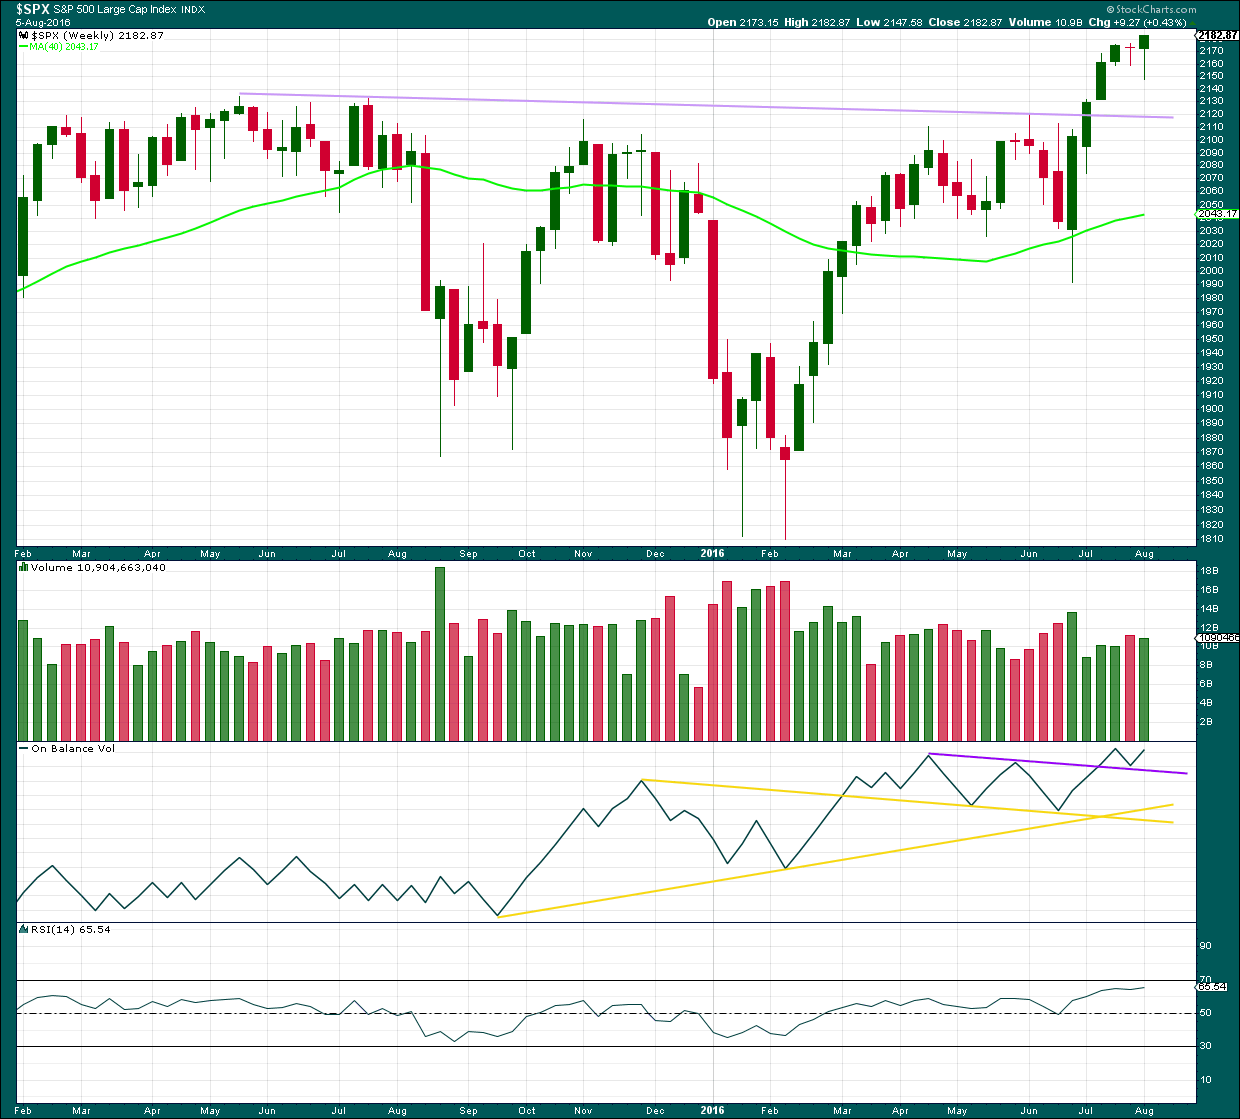
Click chart to enlarge. Chart courtesy of StockCharts.com.
The bearish implications of the stalled candlestick pattern should now be fulfilled with two weeks of a small consolidation.
Last week ended with a new high at the close. The weekly candlestick is a hanging man, but due to the bullish implications of the long lower wick and the green real body this requires confirmation with a downwards week before the bearish implications can be considered seriously.
At this stage, any deeper pullback should find strong support at the lilac trend line. Support at this line should stop any pullback from being very deep.
Last week the bulls were dominant. They rallied to push price out of a consolidation and managed to hold price above prior resistance to close above on Friday. The long lower wick of this weekly candlestick is bullish.
The weekly candlestick comes with slightly lighter volume than last downwards week. The rise in price was not well supported by volume. But that has been a common pattern in recent months, so perhaps not too much bearishness should be read in to this here.
On Balance Volume is still bullish as it remains above the purple trend line.
RSI is not yet overbought. There is room yet for a further rise in price.
DAILY CHART
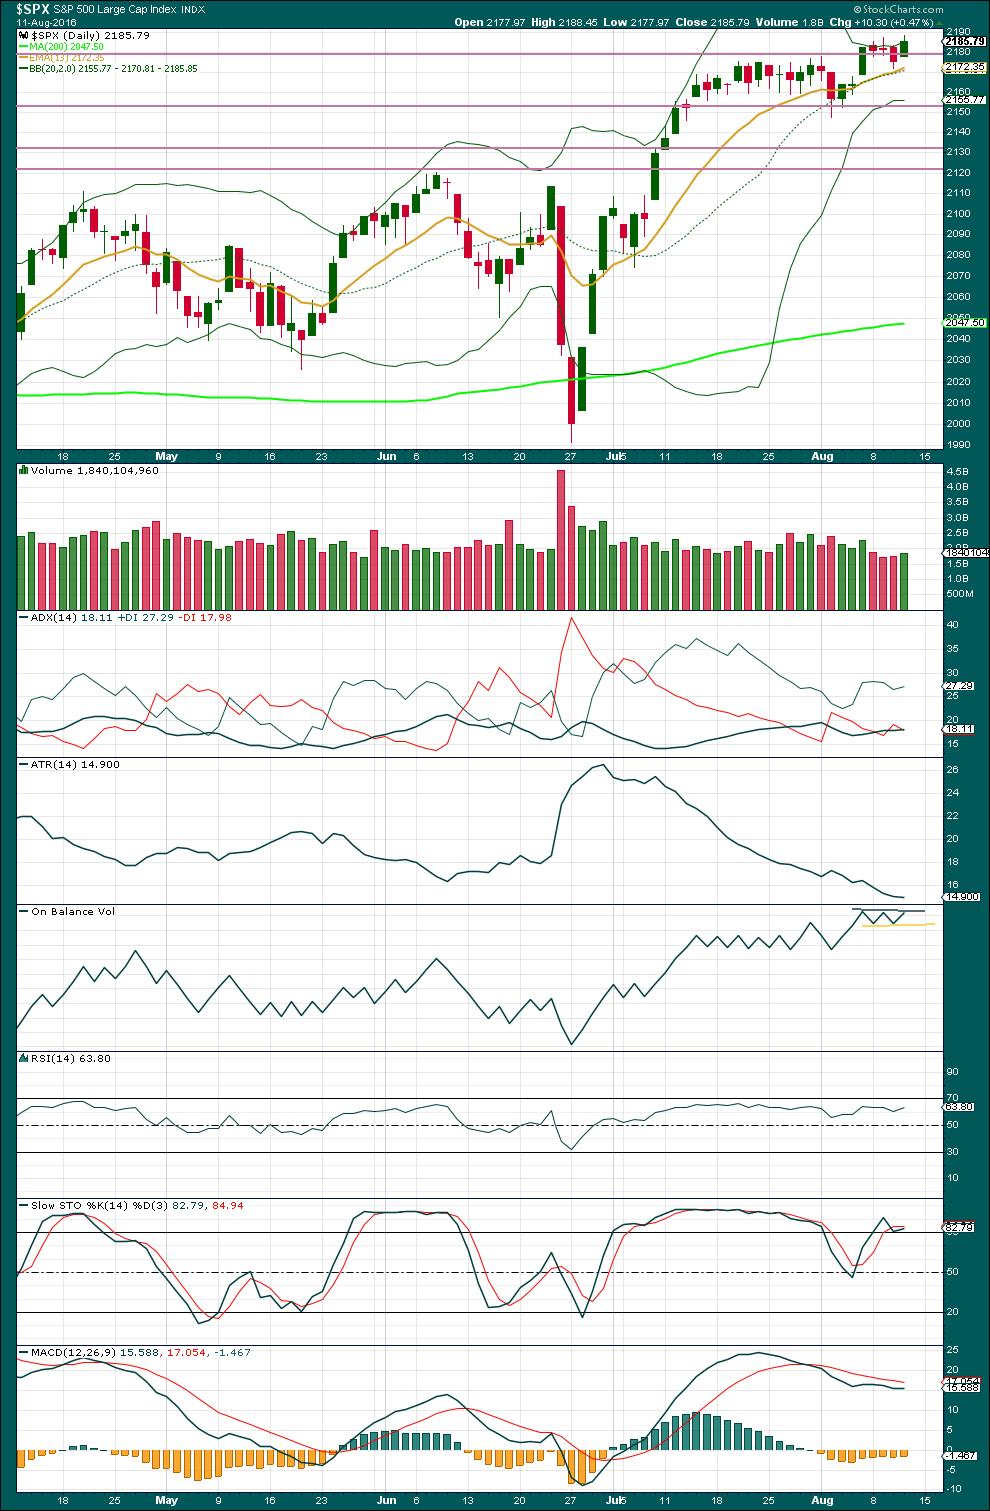
Click chart to enlarge. Chart courtesy of StockCharts.com.
Price has closed higher to complete a green daily candlestick on stronger volume than the last two downwards days. There was some support for the rise in price today. In the short term, the volume profile is bullish. So far during this upwards trend, which began back on 28th of June, each time price moved up with some increase in volume it was followed by a new high at least the day after. This pattern may reasonably be expected for tomorrow.
ADX has slightly increased today indicating the resumption of an upwards trend may be in its early stages. ATR today is mostly flat, not in agreement with ADX. However, so far this upwards trend is characterised by flat and declining ATR, so this pattern may continue. Price keeps moving upwards despite declining ATR. The trend is weak, but it is still a trend.
A close above 2,188 on a day with increased volume would add further confidence that price is breaking out upwards from the recent consolidation. A break below 2,148 would indicate a downwards breakout, preferably with support from volume for confidence.
During this consolidation, it is a downwards day of 27th of July that has strongest volume indicating a downwards breakout may be more likely than upwards. However, this trick with volume has recently proven to be unreliable for the S&P at the monthly time frame and may also prove unreliable here. It is a weak indication to take note of, but it will not be given too much weight.
During the longer term upwards trend from the low on 27th of June, price is finding support about the 13 day moving average and the mid line of the Bollinger Bands. With both of these aligned now, this may offer reasonable support.
Trend lines on On Balance Volume are again redrawn today. OBV is range bound. A break above the grey line would be bullish. A break below the yellow line would be bearish.
RSI is not extreme. There is room for price to rise or fall.
Stochastics is still just overbought. With ADX now indicating a trending market, Stochastics may not be of much use at this time. Normally, divergence between price and Stochastics during a trend would indicate weakness and the approaching end of the trend but recently divergence has been shown to be unreliable. There is divergence today between a new high from price but a lower high for Stoachastics. No weight will be given to this divergence, but it will be noted.
Lowry Research shows this rise comes with increasing market breadth. There is not enough selling pressure for price to fall; the consolidation looks like a period of accumulation. With a breakout on slightly higher volume for Friday, this accumulation phase looks to be over and the sideways range was a pause in an upwards trend and not the start of a new downwards trend. With broad agreement between Lowry’s analysis and this analysis presented here, I have more confidence in the upwards trend continuing.
VOLATILITY – INVERTED VIX CHART
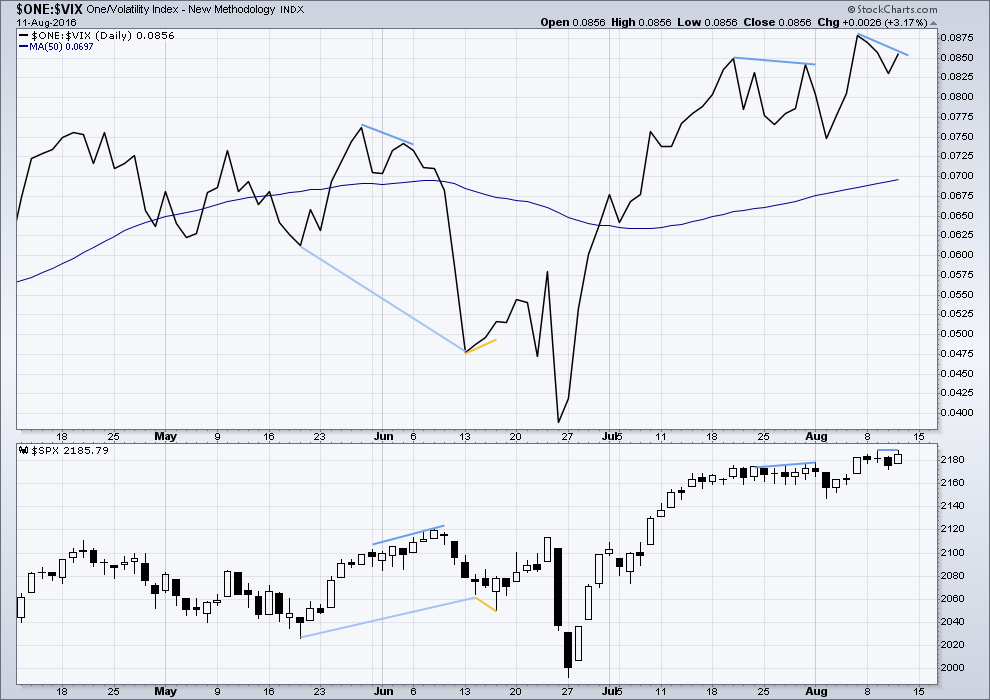
Click chart to enlarge. Chart courtesy of StockCharts.com.
Volatility is declining as price is rising. This is normal for an upwards trend.
There are a few instances of multi day divergence between price and inverted VIX noted here. Bearish divergence is blue. Bullish divergence is yellow. Each of these instances was followed by expected price movement if only for two days. Divergence with VIX and price is not always working, but it is still sometimes working. So it will be noted.
Price today has made a new high, but inverted VIX has failed to make a corresponding high. If this disappears tomorrow, then it will be ignored. But today it warns of a possible movement against the upwards trend tomorrow.
BREADTH – AD LINE
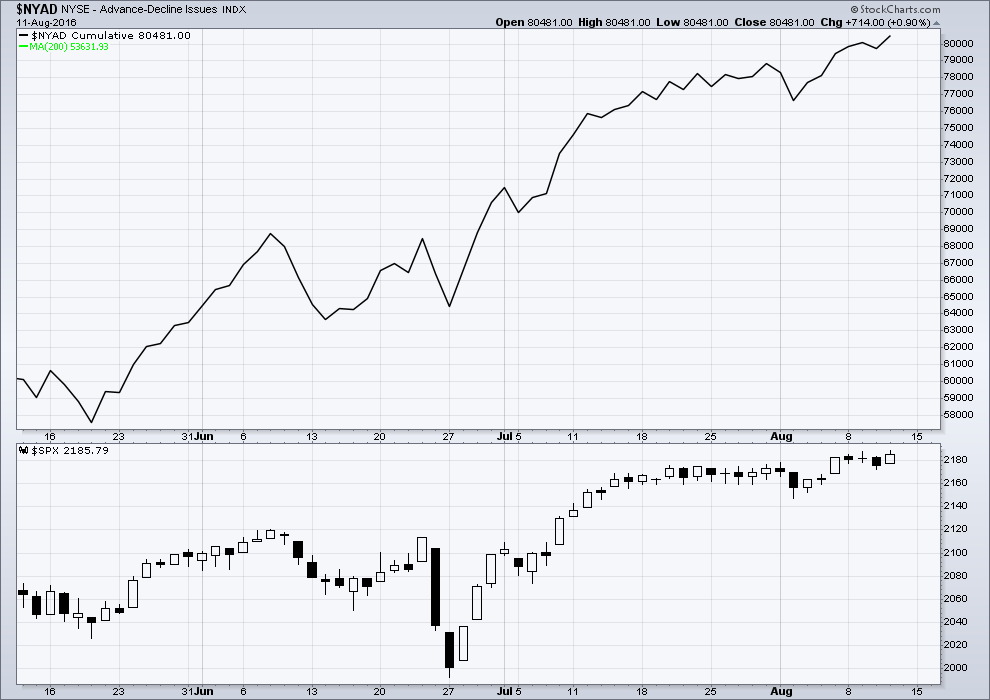
Click chart to enlarge. Chart courtesy of StockCharts.com.
There is support from market breadth as price is rising. The AD line shows no divergence with price; it is making new highs with price.
DOW THEORY
Major lows within the prior bull market:
DJIA: 15,855.12 (15th October, 2014) – closed below on 25th August, 2015.
DJT: 7,700.49 (12th October, 2014) – closed below on 24th August, 2015.
S&P500: 1,821.61 (15th October, 2014) – has not closed below this point yet.
Nasdaq: 4,117.84 (15th October, 2014) – has not closed below this point yet.
Major highs within the new bear market:
DJIA: 17,977.85 (4th November, 2015) – closed above on 18th April, 2016.
DJT: 8,358.20 (20th November, 2015) – has not closed above this point yet.
S&P500: 2,116.48 (3rd Nobember, 2015) – has now closed above this point on 8th June, 2016.
Nasdaq: 5,176.77 (2nd December, 2015) – has now closed above this point on 1st August, 2016.
Dow Theory Conclusion: Original Dow Theory still sees price in a bear market because the transportations have failed to confirm an end to that bear market. Modified Dow Theory (adding S&P and Nasdaq) has failed still to confirm an end to the old bull market, modified Dow Theory sees price still in a bull market.
This analysis is published @ 10:38 p.m. EST.
That is a very interesting question Ari. For many weeks now EWI has been calling a top in Gold and Silver because of the incredible and historic extremes in the COT data, extremes surpassing the 2011 highs, while other EW analysts see the bull run just getting under way and predicting the strongest portion of the advance dead ahead. It seems to me the absence of the typical blow-off top event that typically signals exhaustion in a PM bull run militates against a top being in despite the extreme COT data. As to what is going on in SPX I have to confess that I am completely befuddled! I have never ever seen a third wave up at this degree behave in such a halting manner, and certainly never seen one return to a zone of consolidation after breaking so decisively from it. I have also never seen volatility print a doji above its BBs and that not be a take-it-to-the-bank signal of an imminent market reversal. Granted I have used that trigger with UVXY at interim market bottoms, the same signal would be expected with the inverse of UVXY (SVXY) at interim market tops. We had one such signal three days ago and yet the markets went on to make new highs. As I said, I have NEVER seen that happen, EVER!!!
We are in uncharted waters in my view and it may be, despite how counter-intuitive it seems that both SPX and GOLD could be in third waves.
Another member on the GOLD site said something that absolutely stunned me and it takes a lot to do that. It was something that never even remotely entered my mind notwithstanding my cynical views on bankster attempts to manipulate price action in the markets. We were noticing some strange discrepancies with the data feed for Gold that was actually starting to affect how the waves could be labelled. Price is price, and there is absolutely no reason whatsoever that it should vary when accurately reported.
So many of us have been wondering why it is that what used to be reliable signals and triggers are no longer working and the obvious never entered our minds, certainly not mine.
This person on the GOLD site posed a simple, but nonetheless stunning query:
What if the data is “massaged” …..??!!
Now I have heard everything, but nothing is scarier than this.
Hi Verne, and others following the gold market. 🙂
Which market do you think is more likely to be in a 3rd wave up: gold or SPX?
The reason I’m asking is that there is a high chance of these markets moving in opposite direction, unless the USD tanks carrying both higher. But usually it’s money from one market going into another; risk on/off trade…
Thanks in advance…
I’m aware both main wave counts for these markets expect a third wave up.
I suspect what could possibly happen is the third wave for the S&P may be short and weak, with consolidations time consuming within it.
Where the third wave for Gold may be stronger.
Gold has been mostly sideways since 27th June, while the S&P has been clearly upwards since that date. So they don’t have to always be inversely correlated.
But yeah, for third waves up those should be strong movements and wave counts expecting that for both would normally be pretty suspicious.
Thank you Lara and Verne…
Not sure about my subdivisions on the five minute chart for minuette (iv), but looking at it on the hourly chart this is where I want to put that label…
Price has bounced very nicely off the lilac trend line today. The strength of that line is reinforced. It should now hold if the wave count is correct, for the duration of the next wave up.
Exiting my calls at essentially break-even and I consider myself fortunate.
I will be quite content to sit out this bizzaro market for the time being. Unless I see a triple digit move in DJI futures one way or the other, I am keeping my powder dry, thank you very much. Have a great week-end everyone and just remember, just because you are paranoid does not mean they are NOT out to get you! Ciao! 🙂
LOL
Have a great weekend
Verns*edit: Verne! sorryNo worries.
I just assumed that entitled me to a royal “We” 🙂
anyone have volume data? Seems like we had a very light week this week.
StockCharts have something for today, showing slightly increased volume for a green daily candlestick.
But my COMEX data shows a red daily candlestick.
Here’s hoping they’ll sort it out after the close.
I’m showing much lower S&P500 volume for this week compared to the previous four weeks, about equal to the volume bar 5 weeks back.
Did we get a double ZZ for minute two?
I counted a 3-3-5 pattern for minute 2, but my first 3 could have been a 5.
Personally, I’m not liking the lack of follow through on the upside. Indeed if this is a minute 3 wave we should see some pick up in volume here compared to minute wave 1.
Super Cycle top not withstanding, I agree price action not at all like a typical third wave. There is also little or no selling pressure so market not presenting too many options at the moment. I would be happy to cash in my calls for break-even today as I am not keen to remain exposed in this market over the week-end…
If we don’t print a green candle before the close I expect we should see a steep sell off into it…
raising my stop to b/e and leaving for the weekend.
I must be a sucker for punishment. Re-buying calls at 0.78 …lowered stop to 0.50…
This market is now firmly back within its previous consolidation zone so unless something changes prior to the close, I would have to consider the last few days as having been a false break-out. I wish it would make up my mind already! (as Radar would say) 🙂
It looks like those banksters are pushing it up at the end of the session. I can see a nice rally.
Price came down to perfectly touch the lilac trend line on the hourly chart today, and bounced up from there.
Call me Nostradamus; stopped out as predicted…! 🙂
OK folks. Gap open from this morning filled. If we also fill yesterday’s open gap (2175.49) I am going to start taking a very serious look at that ending diagonal alternate…
Oops! gap this morning was down not up…. sheepish!! 🙂
OMG! The market is trending down on the 5 minute chart like the signals said it would?!
Someone pinch me, I must be dreaming.
Janet Yellen must have taken a look at her balance sheet statement for the month of July and told Dudley he needed to stop, as they can no longer afford to support this market. …..LMAO!
Speaking of “supporting” the market, the amount of pumping they need to engage in is not a linear function of the market’s rise; that is to say it is not arithmetic, but geometric. It takes an ever increasing amount of “stimulus” just to maintain the status quo, to say nothing of ramping it higher. There is also a massive number of baby boomer liquidating positions in the market these days as they retire and need funds to live on so they are certainly facing an uphill battle. The denoument is not going to be pretty…having said that why in the hell am I buying calls??? 🙂 🙂 🙂
Moving stop to this morning’s low at 2179.42.
If stopped out again I am done for the day and off to enjoy my week-end….
LOL…. I think we’re good on the long side here. I got long myself, just a 1/4 position. I don’t get stopped out either, but holding my nose. 🙂
Looks like minute two continued as a regular flat. Adding to calls to lower cost basis to 0.90 per contract. Move down still looking corrective….
Will double position size if and when yesterday’s high taken out; stop still at 0.75 per contract…
Despite the distorted signals, I am going with the current wave count and buying next weeks SPY 218.50 calls for a buck each. VIX falling today along with the market so that does lend additional credence to the bullish case. Will enter a 25% generous stop at 0.75 per contract. Now watch me get stopped out….once again!!!! 🙂
I know the feeling Verne. This market isn’t following through in either direction for any real moves. Looks like it trades sideways, then breaks up a little, only to trade sideways again. The trend on the daily is up, albeit a very slow grind up.
This is nuts!
I am going back to my “wait for the futures” strategy as it is now virtually impossible to scalp even intra-day moves in this schizoid market….
What? Retail sales missed? Don’t be a fundamental fool….instead be a dip. As in buy the dip!
This market is stupid crazy! We’ll have a green close today. Wouldn’t shock me one bit anymore.
Retail Sales #’s Cooked to get to basically FLAT mo over mo and missing!
Year over Year just 2.30% which historically is considered a recessionary signal.
The Dumb A market never looks at Year over Year numbers anyway.
Even more remarkably, strongest numbers supposedly came from auto sales (this is really what kept the report from going into negative territory as everything else declined), which is the exact opposite of what the car makers themselves reported!
That must be where “seasonal adjustments” come into play!
Or weather….Could have been all the snow we got in July.
Anybody interested in buying a few snowmobiles to take advantage of all the white stuff? 🙂
I prefer mendacious miscreants… 🙂
Failed coup!!!! Im first!!!!
Wow! Impressive Speed.
You win!
Woo hoo!!!! Long live King Jules and Best EW analyst Lara!!!!!!
🙂