
Downwards movement to below 2,168.98 but not below 2,159.75 was expected as most likely by the main Elliott wave count for Monday.
Price moved lower to reach 2,161.94.
Summary: A small pennant or Elliott wave triangle may have ended today. This should be followed by a short fifth wave up to 2,221. The trend is up.
Last monthly chart for the main wave count is here.
New updates to this analysis are in bold.
MAIN WAVE COUNT
WEEKLY CHART
Click chart to enlarge.
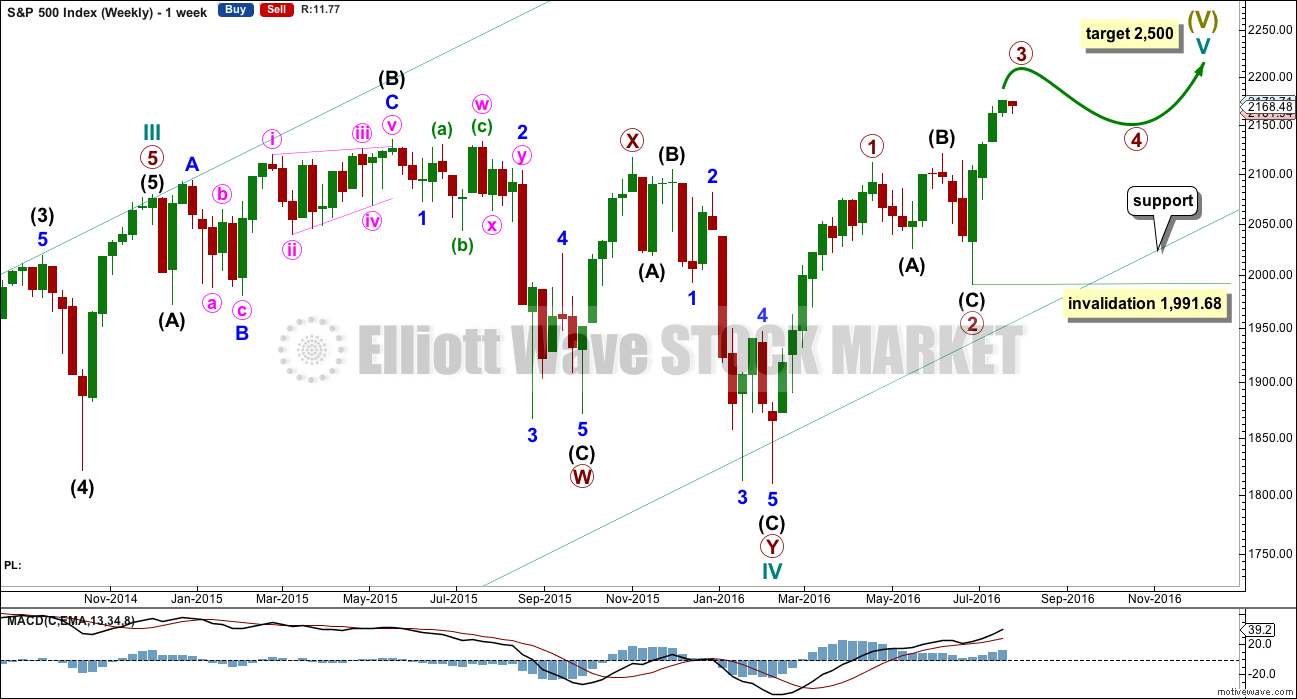
Cycle wave II was a shallow 0.41 zigzag lasting three months. Cycle wave IV is now seen as a more shallow 0.28 double combination lasting 15 months. With cycle wave IV five times the duration of cycle wave II, it should be over there.
Cycle wave I lasted 28 months (not a Fibonacci number), cycle wave II lasted a Fibonacci 3 months, cycle wave III lasted 38 months (not a Fibonacci number), and cycle wave IV lasted 14 months (one more than a Fibonacci 13).
If the target for cycle wave V is for it to be equal in length with cycle wave I, then it may also be expected to be about equal in duration. So far cycle wave V is in its fifth month. After this month, a further 23 months to total 28 seems a reasonable expectation, or possibly a further 16 months to total a Fibonacci 21.
This first weekly wave count expects the more common structure of an impulse is unfolding for cycle wave V. Within cycle wave V, primary waves 1 and now 2 should be over. Within primary wave 3, no second wave correction may move beyond its start below 1,991.68.
There is one other possible structure for cycle wave V, and ending diagonal. This is covered in an alternate.
DAILY CHART
Click chart to enlarge.
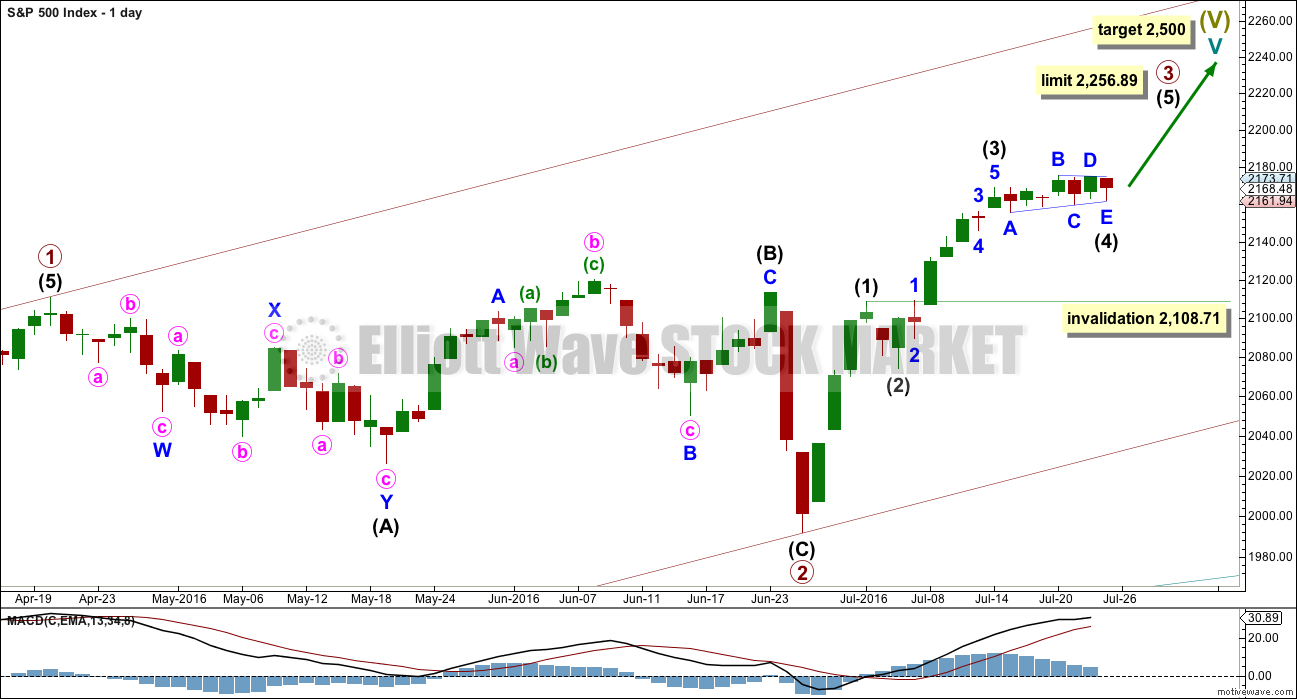
It is most likely that primary wave 2 is already complete as a shallow regular flat correction. Primary wave 3 is most likely underway.
A five wave impulse is almost complete within primary wave 3. This impulse may be primary wave 3 in its entirety, or the degree of labelling within primary wave 3 may all be moved down one degree and this may only be intermediate wave (1) almost complete. When the fifth wave up is complete, then a new alternate will also be considered that sees only intermediate wave (1) complete.
The labelling on the daily and hourly charts will consider primary wave 3 almost complete. Monday’s downwards wave may have completed a running barrier triangle for intermediate wave (4).
Intermediate wave (3) is shorter than intermediate wave (1) within the upwards impulse. Because a core Elliott wave rule states a third wave may not be the shortest actionary wave within an impulse, this limits intermediate wave (5) to no longer than equality in length with intermediate wave (3) at 2,256.89.
When primary wave 3 is complete, then the following correction for primary wave 4 may not move back down into primary wave 1 price territory below 2,111.05.
Intermediate wave (4) may not move into intermediate wave (1) price territory below 2,108.71.
Intermediate wave (1) lasted four days, intermediate wave (2) was a quick zigzag over in just two days, and intermediate wave (3) may have been over in six days. Intermediate wave (4) may have ended in six days (not a Fibonacci number). If it continues for another one day, it may total a Fibonacci eight.
HOURLY CHART
Click chart to enlarge.
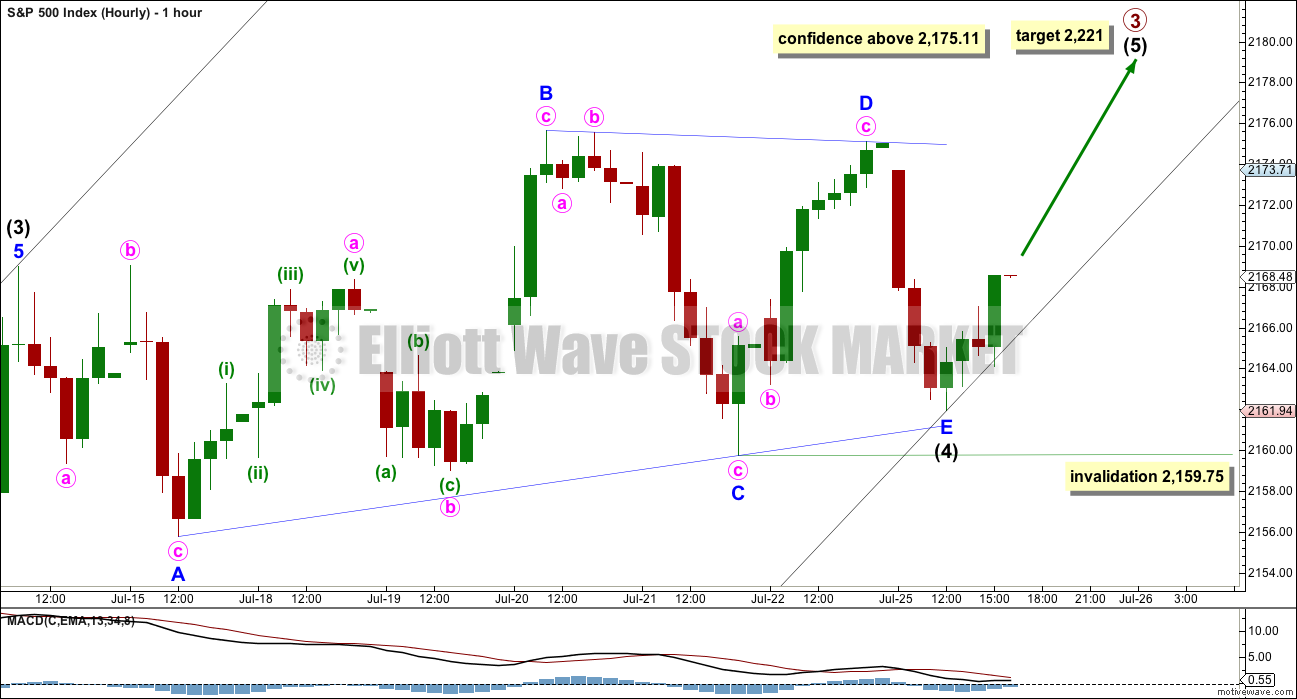
Intermediate wave (4) may be a complete running barrier triangle as labelled.
Intermediate wave (5) would reach 0.618 the length of intermediate wave (3) at 2,221. Fifth waves following barrier triangles are either very long extensions or very short. In this case, intermediate wave (5) may not be a long extension and it should be expected to be very short. It may be surprisingly short; the target may be too high.
A new high above 2,175.11 would invalidate the alternate below and provide some confidence in this wave count and the target.
If minor wave E continues any further within the barrier triangle, it may not move beyond the end of minor wave C below 2,159.75.
HOURLY CHART – ALTERNATE
Click chart to enlarge.
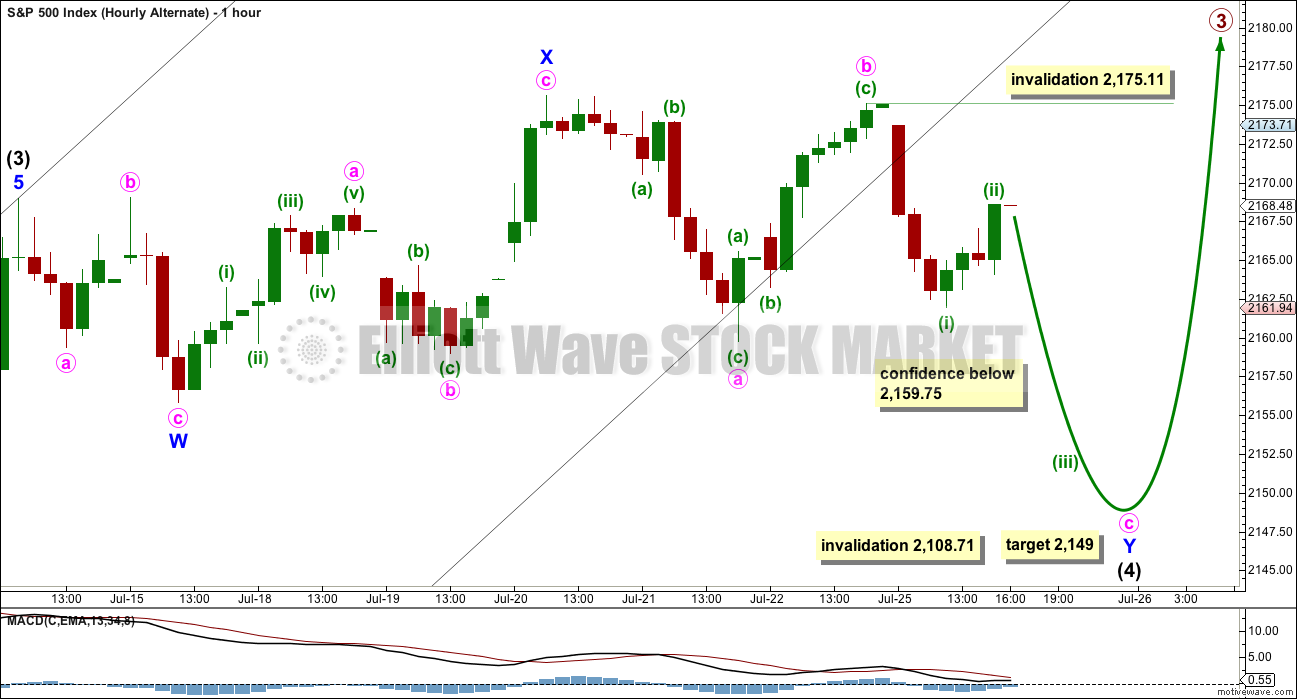
If the triangle is invalidated, then it may be that intermediate wave (4) is continuing as a double flat correction.
The first flat in the double is a regular flat correction labelled minor wave W. The double may be joined by a three, a zigzag in the opposite direction labelled minor wave X.
A second flat correction in the double may be continuing sideways. So far it would be a regular flat.
The structure is most likely to be incomplete within minute wave c, so it would most likely make at least a slight new low below the end of minute wave a at 2,159.75 to avoid a truncation. At 2,149 minute wave c would reach 1.618 the length of minute wave a.
At this stage, this wave count no longer has a reasonable look. If the target is reached, then minor wave Y would end reasonably below the end of minor wave W and the whole double flat would have a downwards slope when it should have a sideways look.
Minute wave c must subdivide as a five wave structure. Within minute wave c, minuette wave (ii) may not move beyond the start of minuette wave (i) above 2,175.11.
Intermediate wave (4) may not move into intermediate wave (1) price territory below 2,108.71.
HOURLY CHART – ALTERNATE II
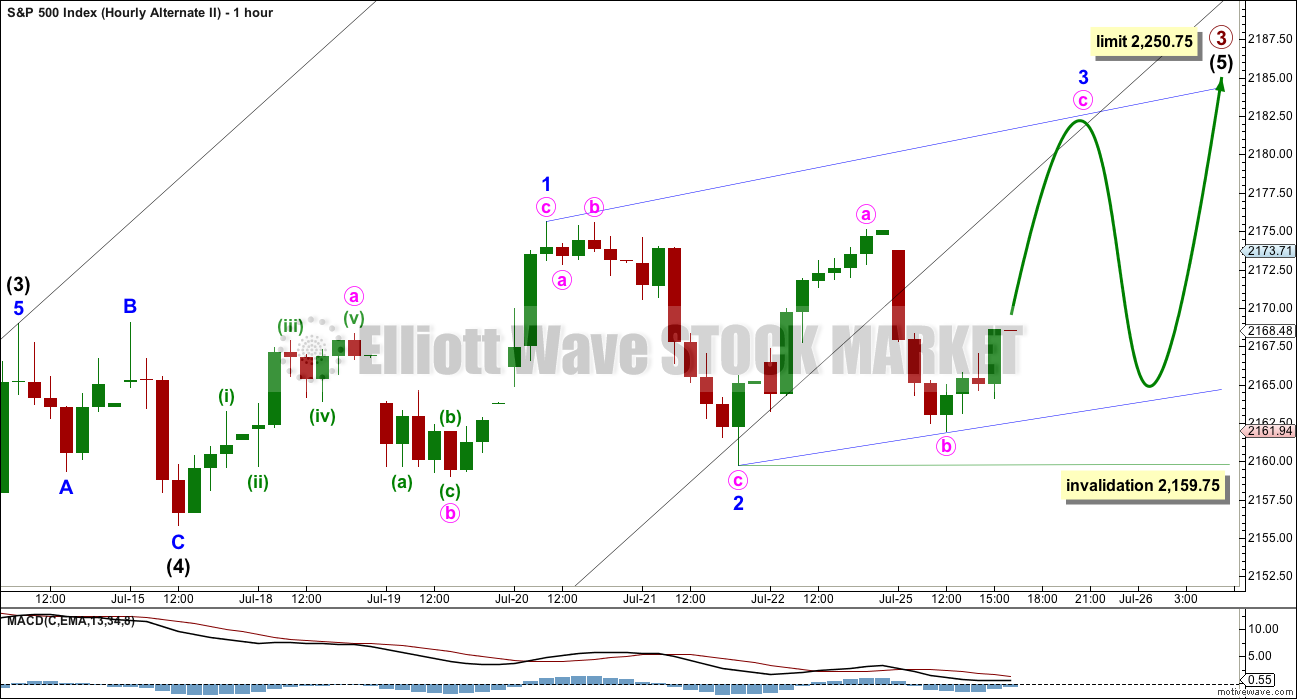
Click chart to enlarge.
It is also possible that intermediate wave (4) was a relatively quick regular flat correction and subsequent choppy upwards movement is an ending diagonal for intermediate wave (5).
Intermediate wave (2) was over in two days as a quick shallow zigzag. This alternate sees intermediate wave (4) as a more shallow and quicker regular flat correction. This is entirely possible, but flats are normally more time consuming than zigzags of the same degree.
For this alternate, intermediate wave (5) is limited to no longer than equality in length than intermediate wave (3) at 2,250.75, so that intermediate wave (3) is not the shortest and this core Elliott wave rule is met.
Ending diagonals require all sub waves to subdivide as zigzags. The fourth wave must overlap first wave price territory but may not move beyond the end of the second wave below 2,159.75.
Minor wave 3 must move above the end of minor wave 1 at 2,175.63. Minor wave 3 must subdivide as a zigzag.
ALTERNATE WAVE COUNT
WEEKLY CHART
Click chart to enlarge.
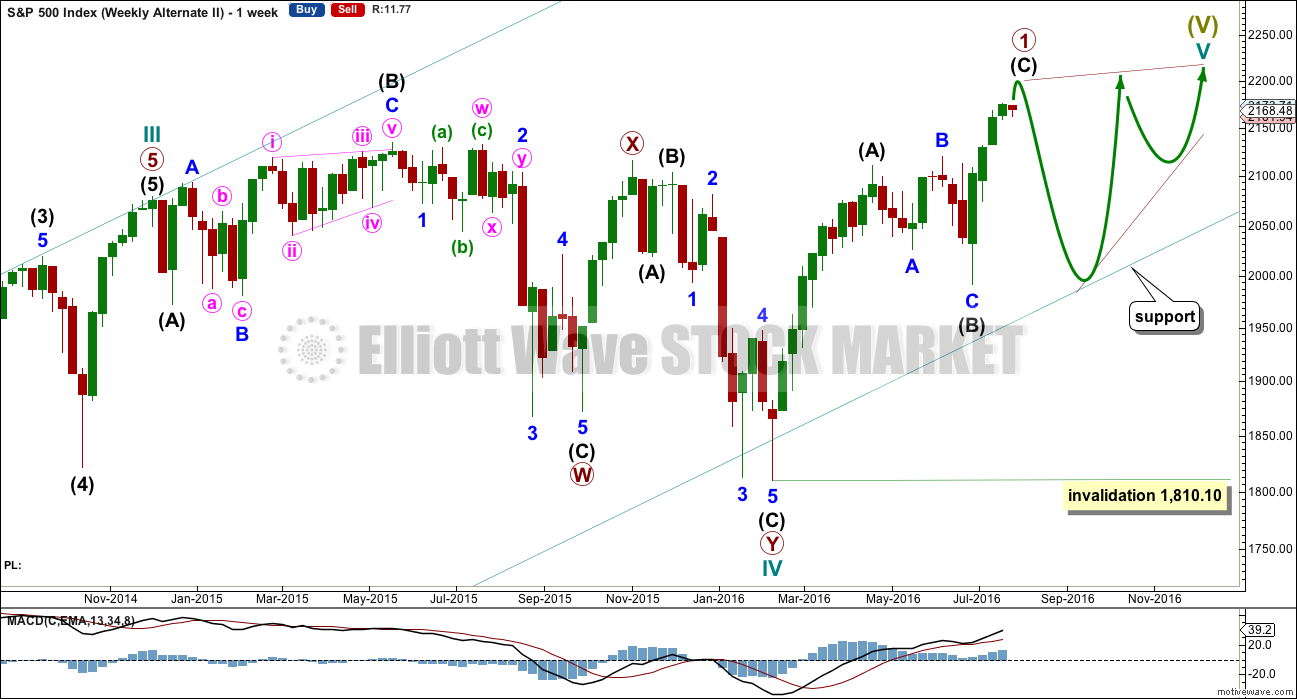
Cycle wave V may be unfolding as an ending diagonal. The most common type of diagonal by a reasonable margin is a contracting diagonal. When primary waves 1 and 2 are complete, then primary wave 3 would most likely be shorter than primary wave 1. If primary wave 3 were to be longer than primary wave 1, then the less common variety of an expanding diagonal would be indicated.
Within an ending diagonal, all the sub-waves must subdivide as zigzags and the fourth wave must overlap back into first wave price territory. The whole structure is choppy and overlapping with a gentle slope. The classic pattern equivalent is a rising wedge.
The zigzag of primary wave 1 requires a final fifth wave up as per the main daily wave count. Thereafter, a deep zigzag for primary wave 2 should unfold. It may find support at the lower edge of the teal channel copied over from the monthly chart.
When the end of primary wave 1 is clear, then a target range for primary wave 2 would be calculated. It would most likely be between 0.66 to 0.81 the length of primary wave 1. Primary wave 2 may not move beyond the start of primary wave 1 below 1,810.10.
Ending diagonals have corrective characteristics as they subdivide into a series of zigzags. Ending diagonals contain uncertainty; the trend is unclear as they unfold due to the deep corrections of their second and fourth waves. They are terminal and doomed to full retracement. This may explain some persistent weakness to this upwards trend at this time. The final target at 2,500 for the main wave count would be far too optimistic if this alternate is correct and the diagonal is contracting.
Third waves of even diagonals should still be supported by volume and should still exhibit stronger momentum than the first wave.
For this alternate wave count, when a final short fifth wave up completes intermediate wave (C), then a deep pullback would be expected for primary wave 2 to last several weeks.
TECHNICAL ANALYSIS
WEEKLY CHART
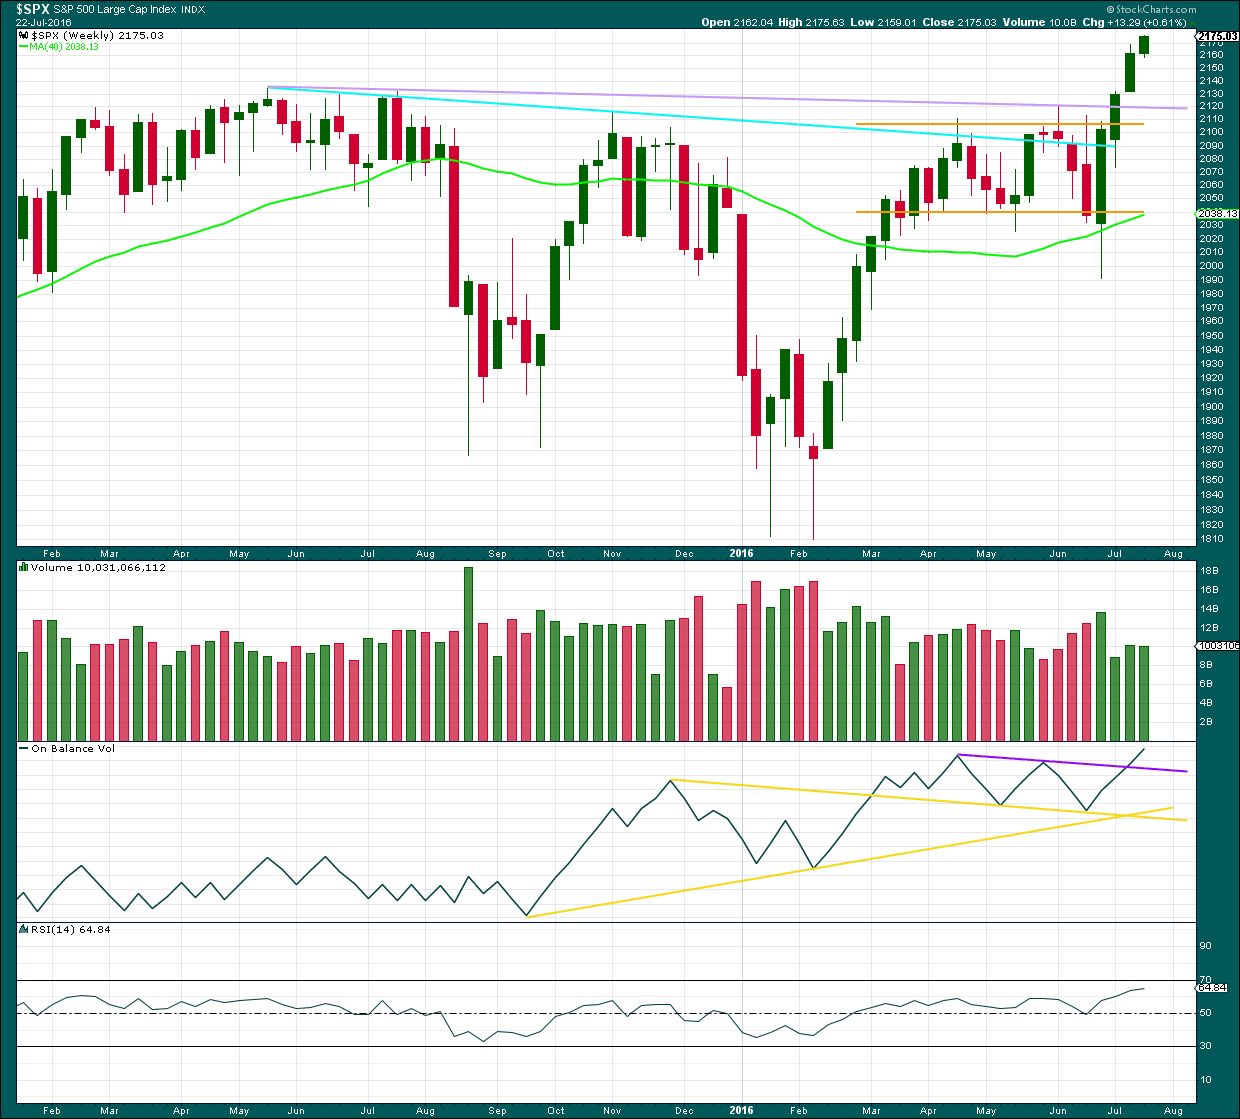
Click chart to enlarge. Chart courtesy of StockCharts.com.
At the end of last week, another green weekly candlestick completes with a slight decline in volume. The last three weekly candlestick patterns now complete a stalled pattern. This is a bearish reversal pattern, so some caution about this upwards trend is warranted. A trend change to either sideways or down may occur here.
On Balance Volume is still bullish at the weekly chart level. If OBV turns down and breaks below the purple line, that would be a bearish signal.
RSI is not yet overbought at the weekly chart level. There is still room for price to rise.
DAILY CHART
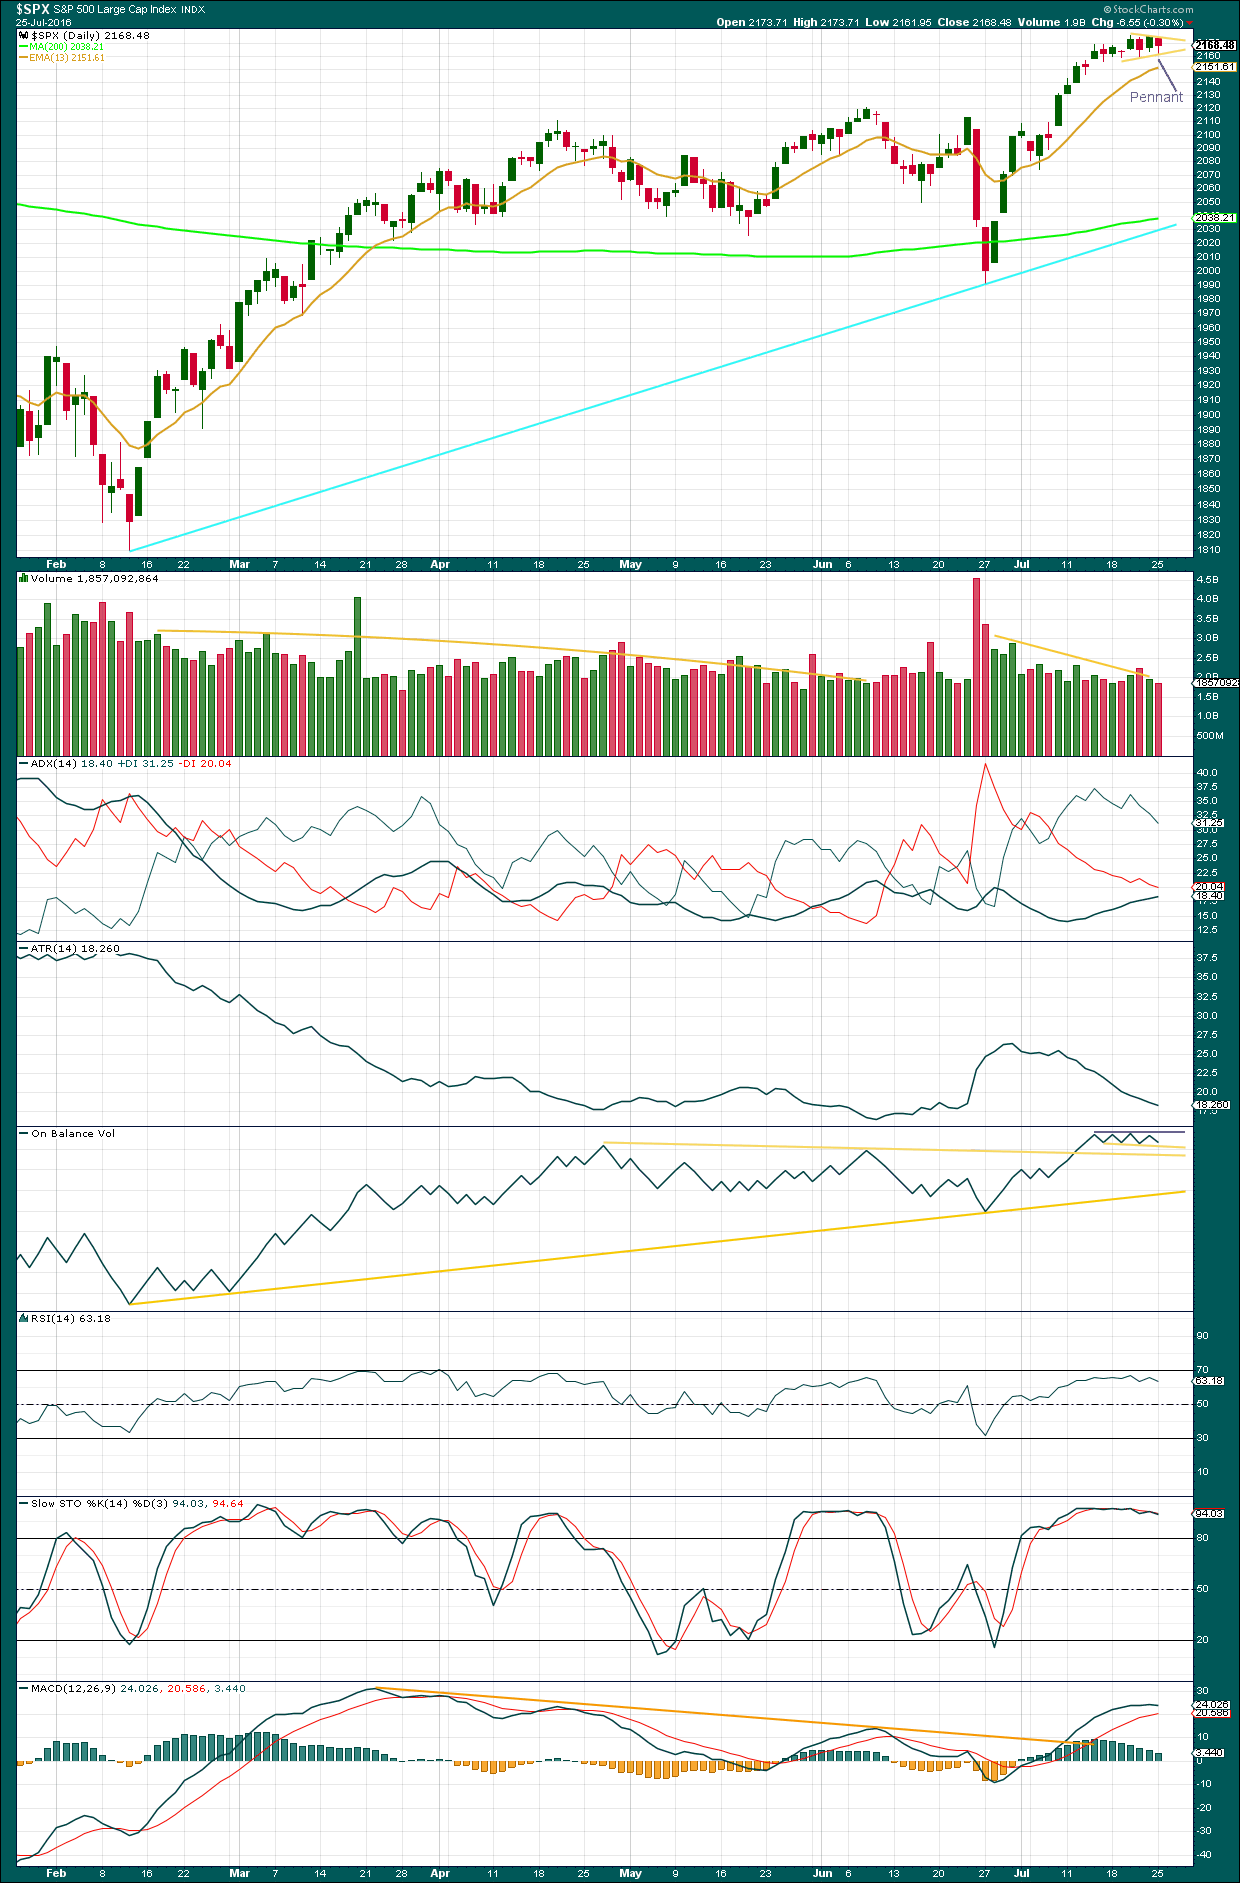
Click chart to enlarge. Chart courtesy of StockCharts.com.
Volume for Monday is the lightest in the last five days. Volume is now declining as price is moving sideways. This is typical of triangles.
A small pennant pattern now looks to be completing on the daily chart. This is a reliable continuation pattern and is reinforced by declining volume. Using the measured rule, a target of about 2,274 would be indicated if price breaks out of the pattern upwards tomorrow.
ADX is still increasing, indicating an upwards trend is still in place. ATR still disagrees as it is declining. This trend is weak. Targets may be too high.
On Balance Volume is still constrained within two trend lines and has not yet broken out to indicate a direction for price.
RSI is still below extreme. There is still room for this trend to continue upwards. Stochastics is extreme but this oscillator may remain extreme for reasonable periods of time during a trending market.
MACD is flattening off as the pennant unfolds. There is still long held divergence between price and MACD indicating this trend lacks momentum. But at this time, although divergence may be noted, it should not and is not being given much weight. It has been noted recently only to then disappear. Divergence is not currently working at the daily chart level.
VOLATILITY – INVERTED VIX MONTHLY CHART
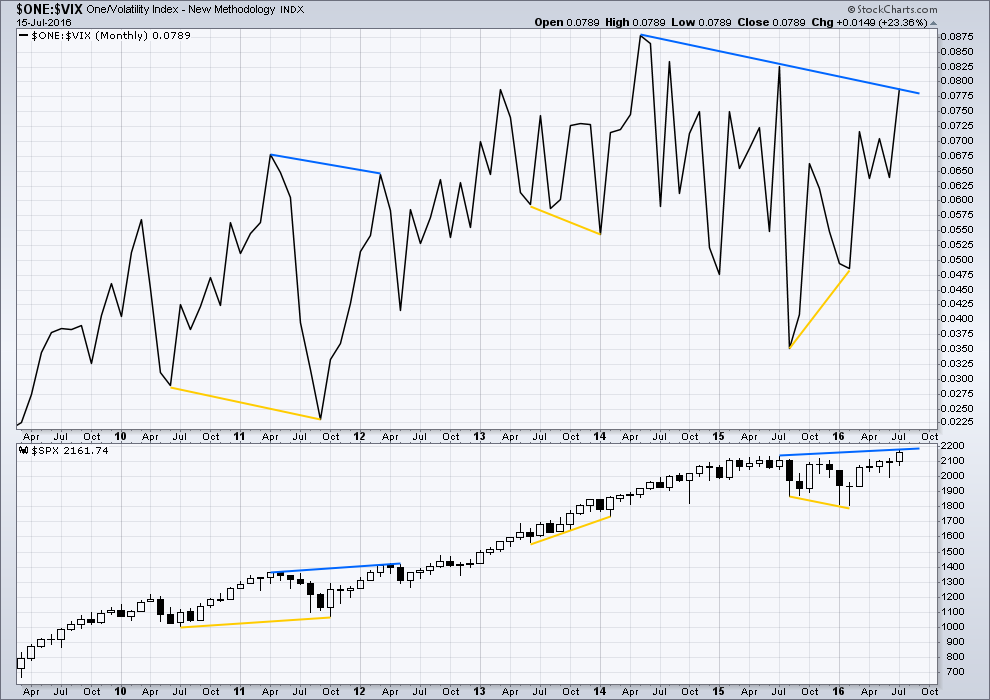
Click chart to enlarge. Chart courtesy of StockCharts.com.
VIX from StockCharts is inverted. As price moves higher, inverted VIX should also move higher indicating a decline in volatility which is normal as price moves higher. As price moves lower, inverted VIX should also move lower indicating an increase in volatility which is normal with falling price.
There is still strong multi month divergence with price and VIX. While price has moved to new all time highs, this has not come with a corresponding decline in volatility below the prior all time high at 2,134. This strong multi month divergence between price and VIX indicates that this rise in price is weak and is highly likely to be more than fully retraced. However, this does not tell us when and where price must turn; it is a warning only and can often be a rather early warning.
At this time, although divergence with price and VIX at the daily chart level has been recently proven to be unreliable (and so at this time will no longer be considered), I will continue to assume that divergence with price and VIX at the monthly chart level over longer time periods remains reliable until proven otherwise.
This supports the idea that price may be in a fifth wave up. Divergence between the end of a cycle degree wave III and a cycle degree wave V would be reasonable to see. Fifth waves are weaker than third waves. This strong divergence indicates that price targets may be too high and time expectations may be too long. However, it remains to be seen if this divergence will be reliable.
DOW THEORY
Major lows within the prior bull market:
DJIA: 15,855.12 (15th October, 2014) – closed below on 25th August, 2015.
DJT: 7,700.49 (12th October, 2014) – closed below on 24th August, 2015.
S&P500: 1,821.61 (15th October, 2014) – has not closed below this point yet.
Nasdaq: 4,117.84 (15th October, 2014) – has not closed below this point yet.
Major highs within the new bear market:
DJIA: 17,977.85 (4th November, 2015) – closed above on 18th April, 2016.
DJT: 8,358.20 (20th November, 2015) – has not closed above this point yet.
S&P500: 2,116.48 (3rd Nobember, 2015) – has now closed above this point on 8th June, 2016.
Nasdaq: 5,176.77 (2nd December, 2015) – has not closed above this point yet.
Dow Theory Conclusion: Original Dow Theory still sees price in a bear market because the transportations have failed to confirm an end to that bear market. Modified Dow Theory (adding S&P and Nasdaq) has failed still to confirm an end to the old bull market, modified Dow Theory sees price still in a bull market.
This analysis is published @ 09:03 p.m. EST.
Calls up 15%. Adding to position.
Have a great evening all!
I have the triangle complete with a big obvious three for minor wave E. It will subdivide as a zigzag.
Now expecting upwards movement for a very few day to see a short fifth wave complete.
Then a pullback.
I’m out…screw that, short term trend turning up.
Someone needs to prescribe this market some Prozac
…..forget that, give me the prozac.
Just take out 2160 already.
The banksters are defending it. Their problem now is they are having trouble getting any more BTFD monkeys to jump on board and the market is starting to sink under its own ennui. We are about to get a great shorting opportunity as they make another huge cash dump in an effort to forestall the inevitable…the next spike up will be a signal to short this animal big time….look for VIX divergence to confirm…
The PPT seems to be working overtime anytime there is a Fed announcement. I would be surprised if there isn’t an end of day melt up cash dump. That could be the point things unravel to the downside.
Yep David. When the market begins steadily stair-stepping down in the absence of aggressive selling you know they are out of bullets. There is another potential harbinger of doom I will be looking for intently. If the FED makes another inane announcement about waiting for data prior to raising short term rates and yields spike instead of tanking…game over!
I will consider that the sign to go half in on the short side, even without a big market decline…
How interesting that yield on the 30 YR note and TLT are both up.
It never ceases to amaze how the bankster criminal cartel continues to thrash around in a desperate and deluded attempt to mask reality. We must be getting close to the end folks…very close….
Reloading SPY calls….hard stop at 2159, STC at 20% gain….
The bounce off the 2160 area probably means E of the triangle unfolded as a ZZ. You have to pay very careful attention to how price behaves around these pivots – hesitation or reversal means a short trade is risky. One of the most powerful signals we will have that a top is in is that the initial thrust down will demolish any and all near term pivots. If that does not happen, it’s time to be cautious….banksters at play…
agree. not liking how this move hasnt rolled back down here.
Fed announcement tomorrow — could be range bound until then?
Market should start to go flat as we get closer and closer to the announcement.
100% short here, if she rolls back over, I’ll press and go 200%. Have a stop 6 points above…letting the market breath a little.
Waiting for a surrender of 2060 on high volume for a downside scalp…
Bill, better call Yellen and ask her for another trillion dollars! Tell her the hoover damn is about to bust.
I wonder how long the SP can keep this up with the the DJ-30 lagging.
like a hot knife through butta!
…and that move there is why I could never bring myself to trade on the long side.
Lots of damage was done for the bull case on that move from a TA perspective.
Oh yeah! Anybody falling in love with directional trades in this market needs to have their head examined. If you don’t scalp, you get skunked; plain and simple! 🙂
Tom McClellen talks about the “Choppiness Index”
cnbc:
http://video.cnbc.com/gallery/?video=3000537535&play=1
Nice call/trade Verne!
Thanks Quang. As you can imagine, I took the money and ran like a bat out of you-know where! I don’t trust this market one bit! 🙂
Hi Lara, now might be a good time to buy the USD/JPY?
Possibly. One of Olga’s favourites I think, a fourth wave “kissing” a first wave I think is happening over there.
Invalidation for it would be 103.382.
1987
Que?
He’s still looking for a market crash Dermot.
It’ll happen, but not yet I think.