
Upwards movement for Friday was not what the Elliott wave count expected.
Summary: The bear wave count will still be preferred while price has not made a new all time high. The target for a strong third wave down is at 1,281. The upwards trend is weak in volume, momentum, volatility and breadth. If price makes a new all time high at any time by any amount, then the bear wave count would be invalidated fully and finally. A new all time high would see price in a third wave up towards a target at 2,263.
Last published monthly charts are here.
New updates to this analysis are in bold.
BEAR ELLIOTT WAVE COUNT
WEEKLY CHART
Click chart to enlarge.
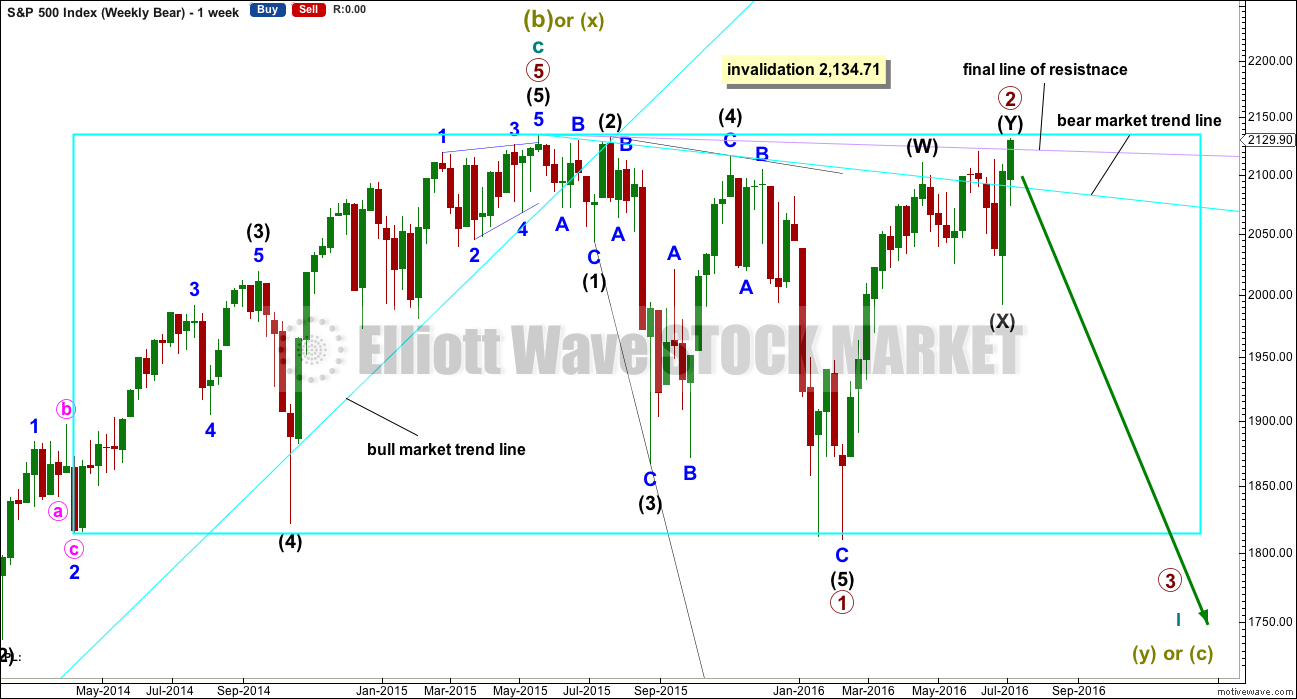
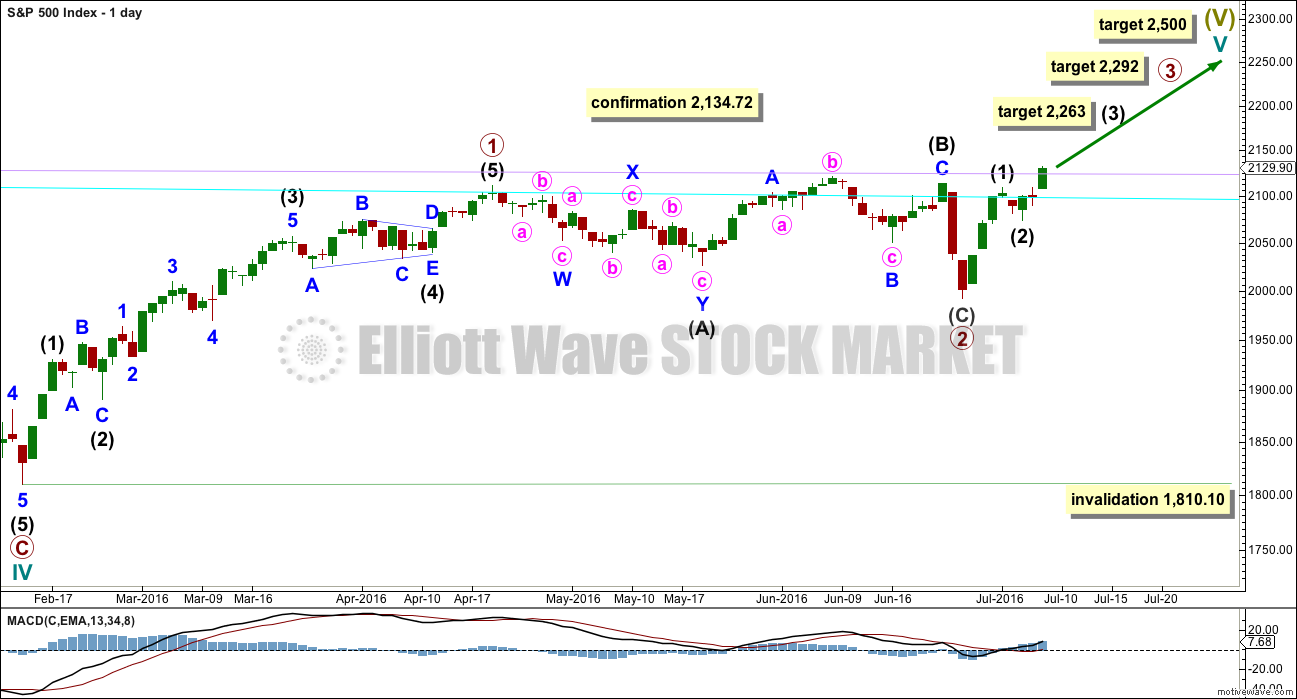
The box is added to the weekly chart. Price has been range bound for months. A breakout will eventually happen. The S&P often forms slow rounding tops, and this looks like what is happening here at a monthly / weekly time frame.
Primary wave 1 is seen as complete as a leading expanding diagonal. Primary wave 2 would be expected to be complete here.
Leading diagonals are not rare, but they are not very common either. Leading diagonals are more often contracting than expanding. This wave count does not rely on a rare structure, but leading expanding diagonals are not common structures either.
Leading diagonals require sub waves 2 and 4 to be zigzags. Sub waves 1, 3 and 5 are most commonly zigzags but sometimes may appear to be impulses. In this case all subdivisions fit perfectly as zigzags and look like threes on the weekly and daily charts. There are no truncations and no rare structures in this wave count.
The fourth wave must overlap first wave price territory within a diagonal. It may not move beyond the end of the second wave.
Leading diagonals in first wave positions are often followed by very deep second wave corrections. Primary wave 2 would be the most common structure for a second wave, a zigzag, and fits the description of very deep. It may not move beyond the start of primary wave 1 above 2,134.72.
At the end of this week, price has closed just above the lilac trend line but has fallen slightly short of a new all time high. This wave count will remain valid while price has not made a new all time high. Second waves can correct right up to the start of the first wave, but no part of a second wave may move beyond the start of the first wave.
DAILY CHART
Click chart to enlarge.
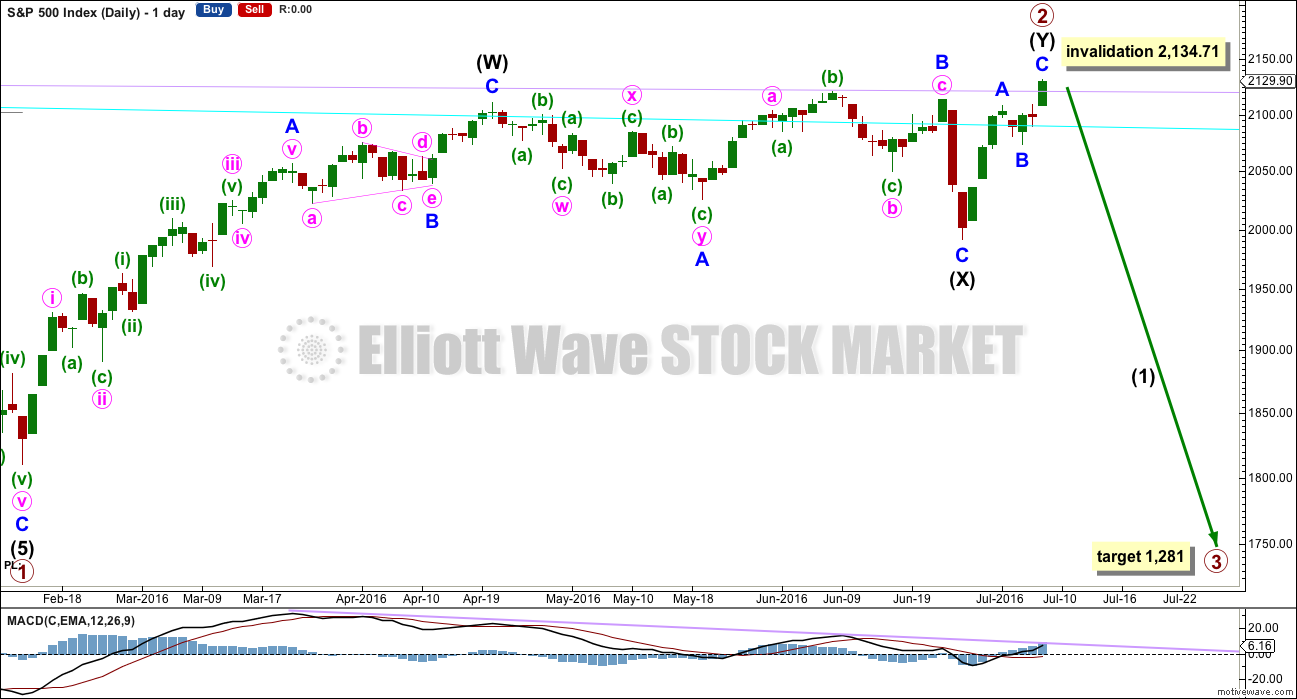
Labelling within primary wave 2 has been changed to see it as a double zigzag. This resolves the small problem of the last wave counts (which saw it as a single zigzag) having to disregard the small correction labelled minute wave iv within minor wave A within intermediate wave (W) upwards. Now this small correction is counted as part of the wave count.
Now the current upwards movement which took price higher on Friday is a zigzag for intermediate wave (Y). It looks like a three on the daily chart.
Intermediate wave (X) is seen as a regular flat correction and all subdivisions fit. There are no truncations or rare structures.
Primary wave 2 has no room in which to move. If the bear wave count is correct, then it must be over here.
At 1,281 primary wave 3 would reach 2.618 the length of primary wave 1. This is the appropriate ratio to use when a second wave correction is almost 100% the length of the first wave.
HOURLY CHART
Click chart to enlarge.
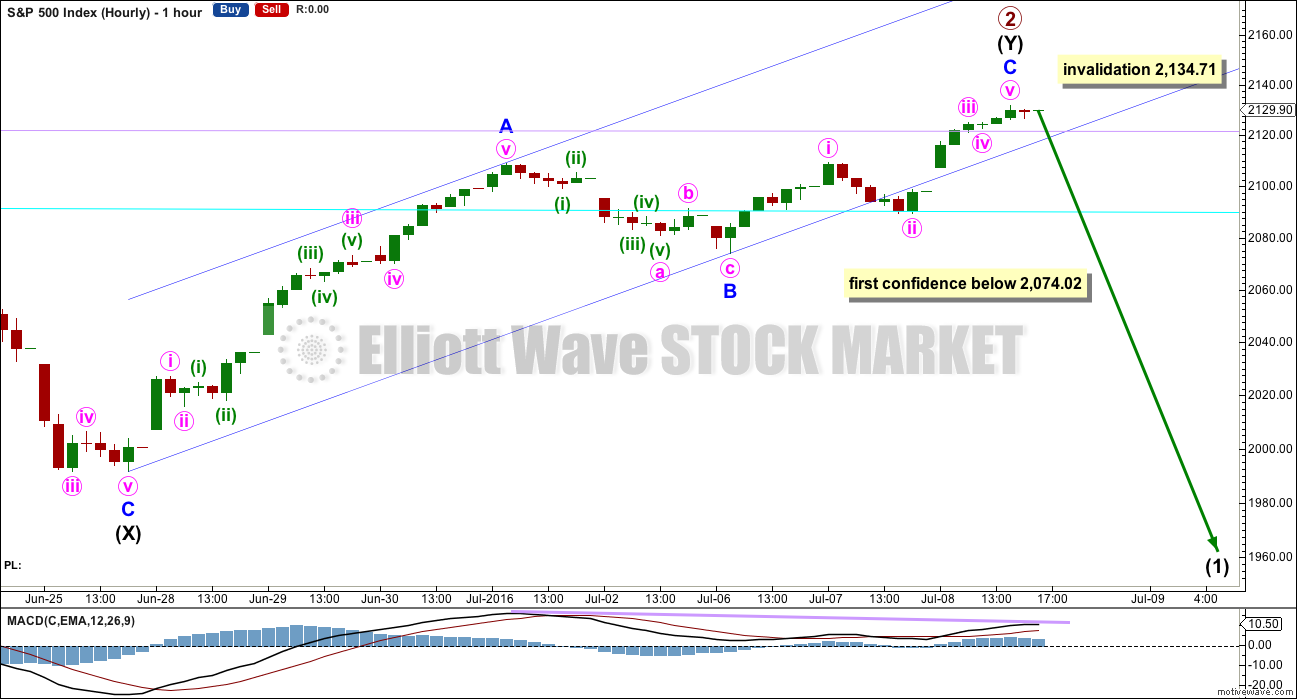
There is no Fibonacci ratio between minor waves A and C.
There is divergence between the ends of minor waves A and C with MACD. Minor wave C has made a new high but on weaker momentum.
A new low below 2,074.02 would mean the upwards impulse of minor wave C should be over. A new low below its start could not be a second wave correction within minor wave C.
Draw a channel using Elliott’s technique about this upwards zigzag. Price does not fit perfectly into it, but mostly. A clear break with downwards movement below the lower edge of the channel would indicate a possible trend change.
It is entirely possible that price could move a little higher when markets open on Monday while price remains within the channel.
BULL ELLIOTT WAVE COUNT
WEEKLY CHART
Click chart to enlarge.
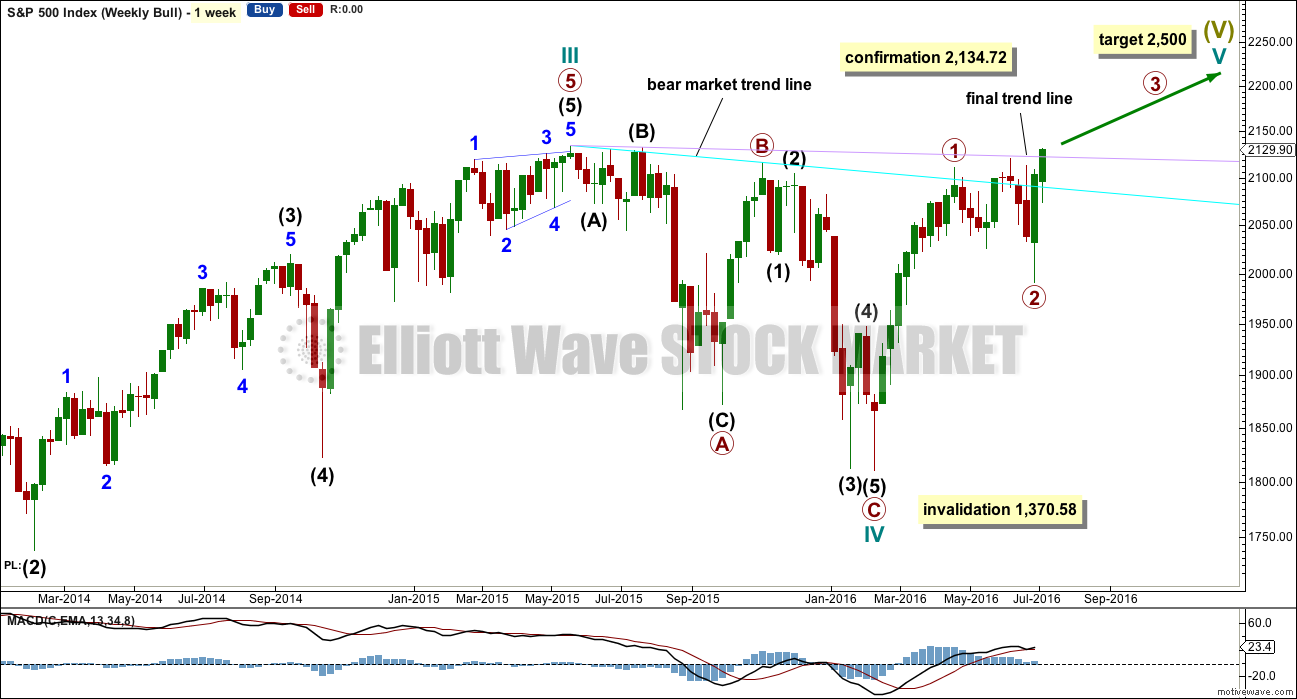
Cycle wave IV is seen as a complete flat correction. Within cycle wave IV, primary wave C is still seen as a five wave impulse.
Intermediate wave (3) has a strong three wave look to it on the weekly and daily charts. For the S&P, a large wave like this one at intermediate degree should look like an impulse at higher time frames. The three wave look substantially reduces the probability of this wave count. Subdivisions have been checked on the hourly chart, which will fit.
Cycle wave II was a shallow 0.41 zigzag lasting three months. Cycle wave IV may be a complete shallow 0.19 regular flat correction, exhibiting some alternation with cycle wave II and lasting nine months. Cycle wave IV would be grossly disproportionate to cycle wave II, and would have to move substantially out of a trend channel on the monthly chart, for it to continue further sideways as a double flat, triangle or combination. For this reason, although it is possible, it looks less likely that cycle wave IV would continue further. It should be over at the low as labelled.
At 2,500 cycle wave V would reach equality in length with cycle wave I.
Price has now broken a little above the bear market trend line. This line is drawn from the all time high at 2,134.72 to the swing high labelled primary wave B at 2,116.48 on November 2015. This line is drawn using the approach outlined by Magee in the classic “Technical Analysis of Stock Trends”. To use it correctly we should assume that a bear market remains intact until this line is breached by a close of 3% or more of market value. Now that the line is breached, the price point at which it is breached is calculated about 2,093.58. 3% of market value above this line would be 2,156.38, which would be above the all time high and the confirmation point.
This wave count requires price confirmation with a new all time high above 2,134.72.
While price has not made a new high this very bullish wave count comes with a strong caveat. I still do not have confidence in it. It is produced as an alternate, because all possibilities must be considered. Price managed to keep making new highs for years on light and declining volume, so it is possible that this pattern may continue to new all time highs for cycle wave V.
The invalidation point will remain on the weekly chart at 1,370.58. Cycle wave IV may not move into cycle wave I price territory.
This invalidation point allows for the possibility that cycle wave IV may not be complete and may continue sideways for another one to two years as a double flat or double combination. Because both double flats and double combinations are both sideways movements, a new low substantially below the end of primary wave C at 1,810.10 should see this wave count discarded on the basis of a very low probability long before price makes a new low below 1,370.58.
DAILY CHART
Click chart to enlarge.
Primary wave 2 may be a complete flat correction over as labelled, or this may be again moved down one degree and primary wave 2 may be continuing further sideways and lower.
Primary wave 2 may not move beyond the start of primary wave 1 at 1,810.10.
If primary wave 2 is over as labelled, then primary wave 3 upwards may have begun. At 2,292 primary wave 3 would reach equality in length with primary wave 1. This is an appropriate ratio to use for the target as primary wave 2 is relatively shallow and it fits with the higher target for cycle wave V. At 2,500 cycle wave V would reach equality in length with cycle wave I.
Within primary wave 3, intermediate waves (1) and (2) may be complete. At 2,263 intermediate wave (3) would reach 1.618 the length of intermediate wave (1).
Although targets are now provided for this bullish alternate, this does not mean I have any confidence in it. It still requires a new all time high before it may be reasonably considered. Targets are provided so that if a new all time high is made we have a road map for what should happen next.
TECHNICAL ANALYSIS
WEEKLY CHART
Click chart to enlarge. Chart courtesy of StockCharts.com.
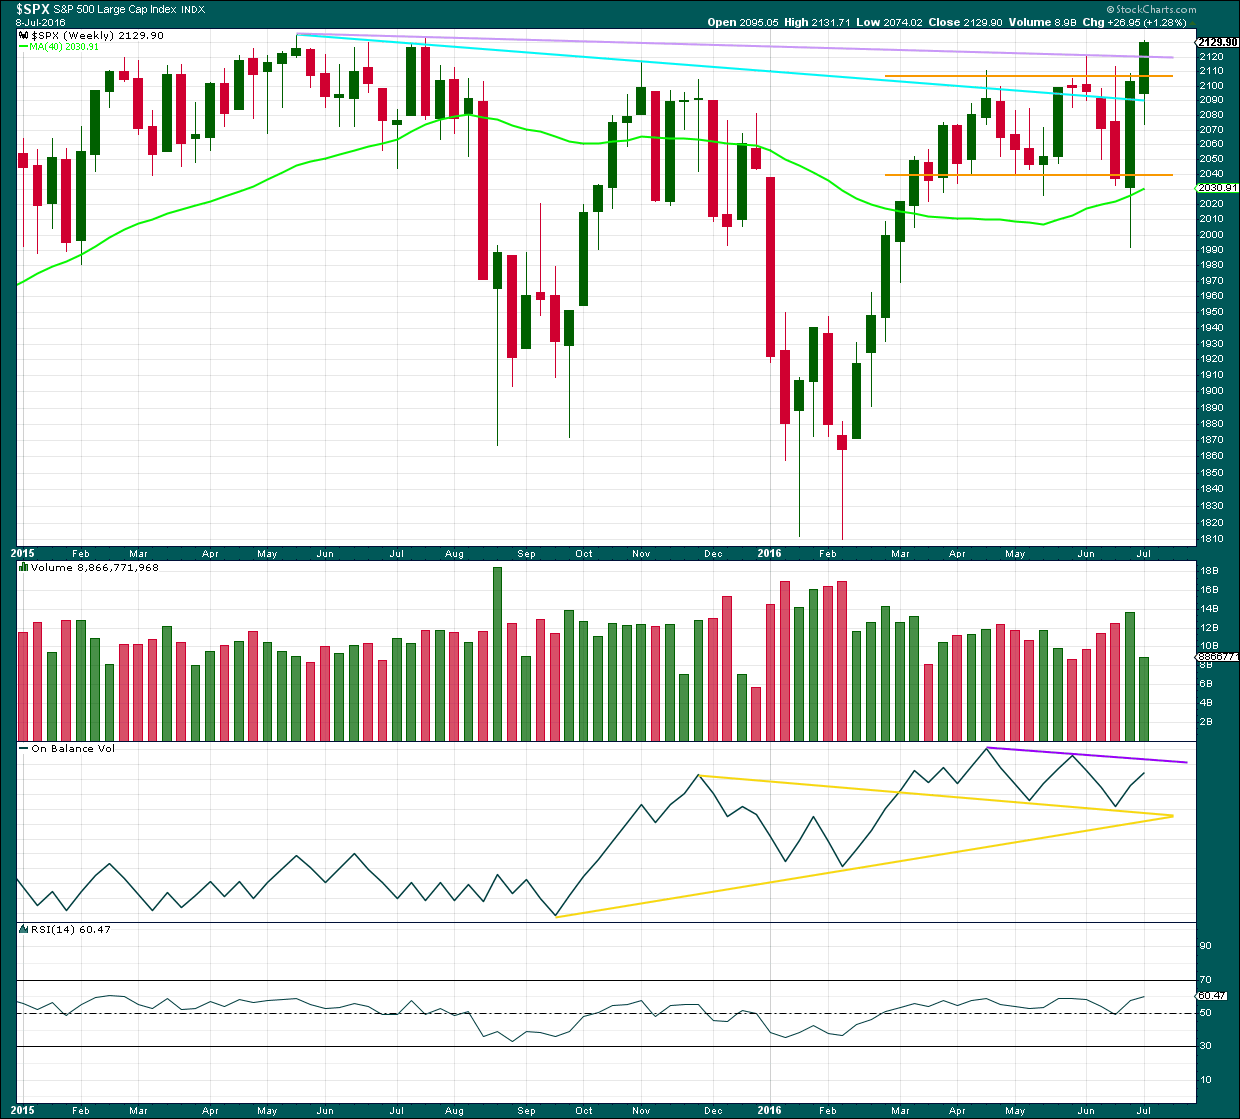
Upwards movement for the week comes on lighter volume than last week. However, although the difference looks stark it is not so great. Last week’s volume includes a substantial amount of downwards movement and an options expiry date.
On Balance Volume now shows double bearish divergence with price: OBV has made two corresponding lower highs while price has made two new swing highs on the weekly chart. This indicates weakness in upwards movement from price, with the last upwards swing weaker than the one before.
There is no divergence at the weekly chart level with price and RSI: RSI also made a very slight new high as price made a new high on Friday.
DAILY CHART
Click chart to enlarge. Chart courtesy of StockCharts.com.
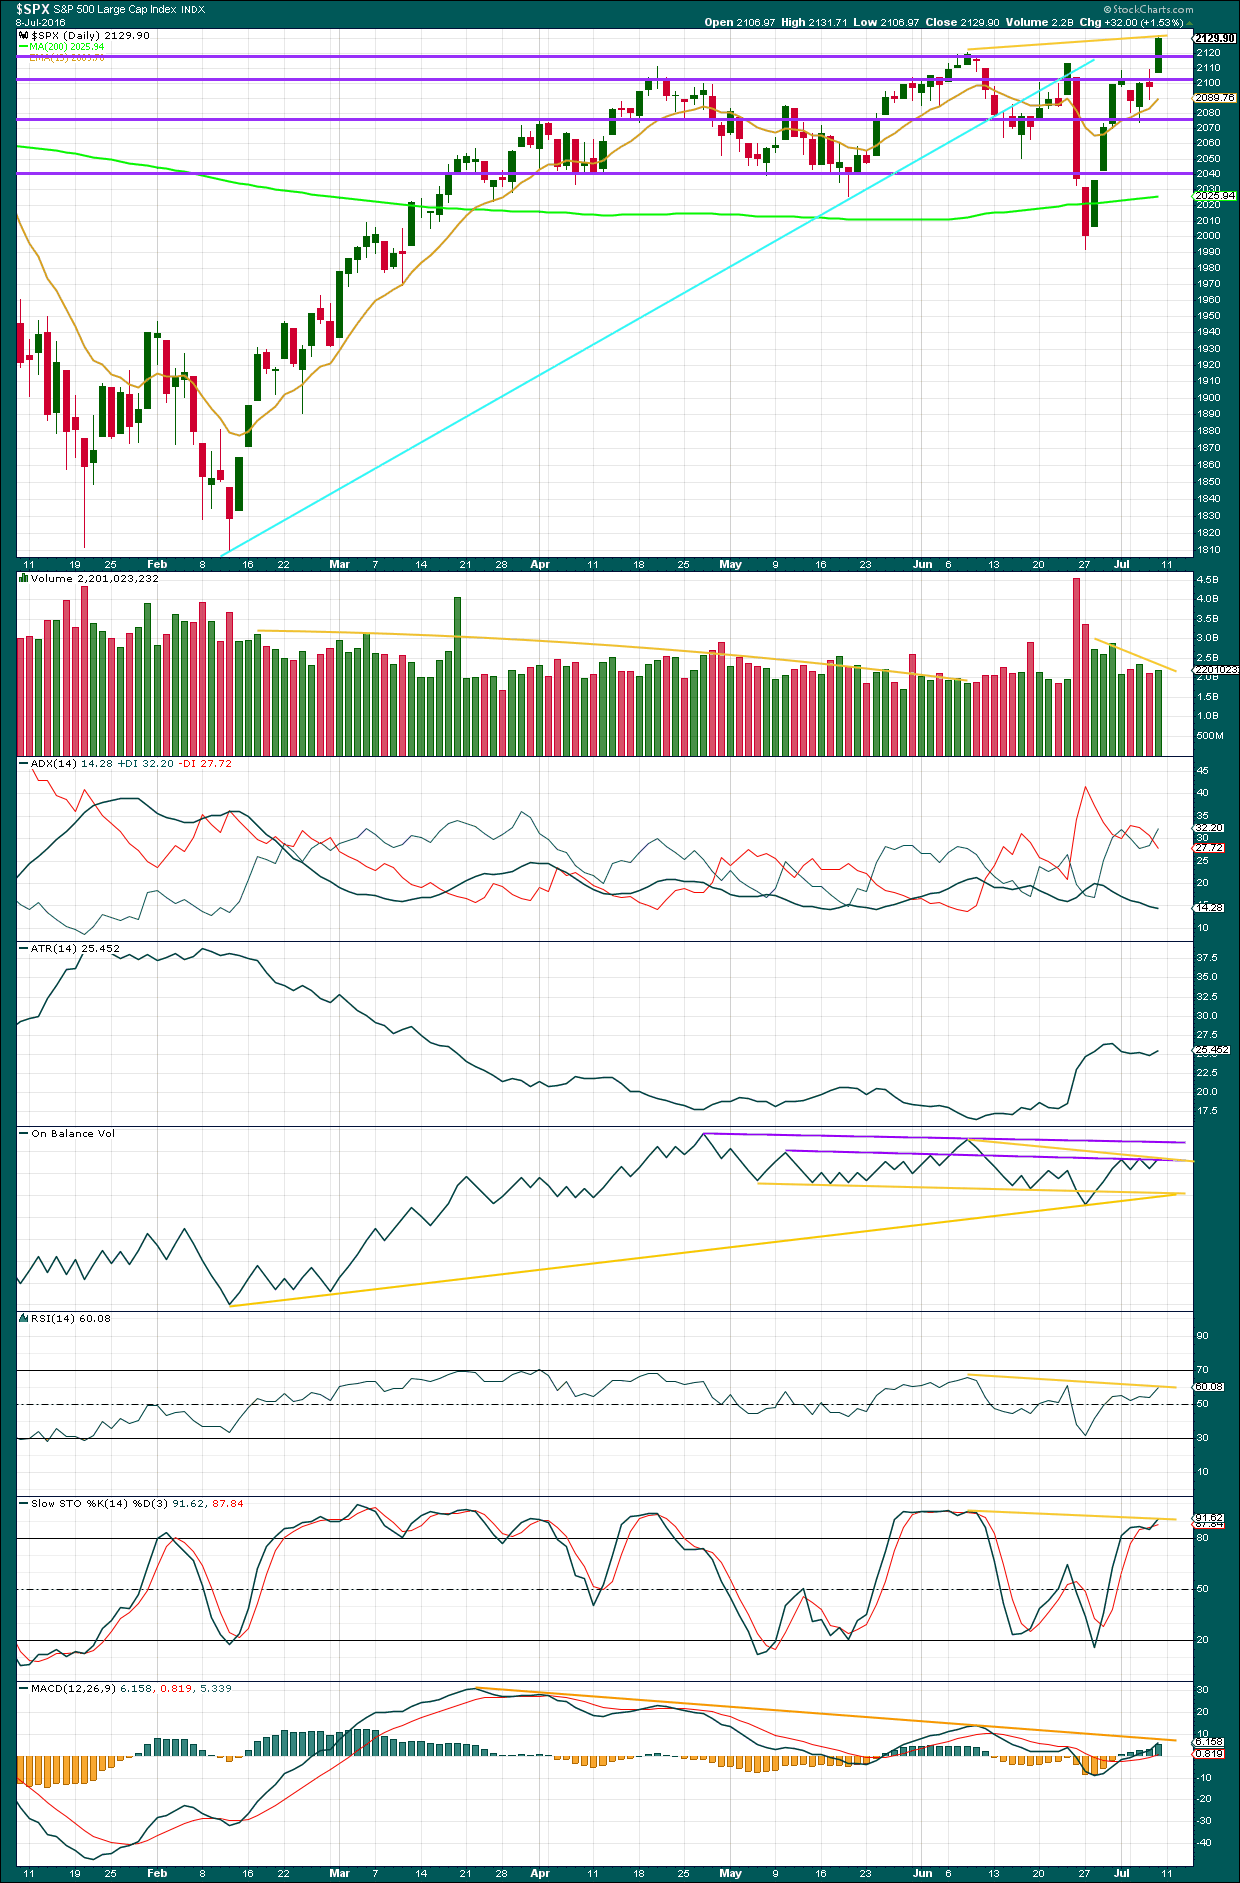
Price has broken above the upper area of consolidation, but the breakout comes with relatively weak volume. This upwards breakout is weaker than the prior downwards breakout of 27th of June, and that break was proven to be false. This upwards break should be assumed to be also false until proven otherwise.
The rise in price is not supported by volume. Volume is clearly declining over the last eight days from the last swing low. This is concerning for any bullish wave count.
ADX is still declining indicating the market is not trending. The +DX and -DX lines are whipsawing about each other.
ATR at the end of this week is overall flat, mostly in agreement with ADX.
On Balance Volume continues to find resistance at the lower purple trend line. Each time this line is tested and holds the strength is reinforced. It now has some reasonable technical strength as it has been tested three times in the last few days. There is divergence now between OBV and price: OBV has not made a corresponding new high, but price has made a new high above the prior high on 8th of June. This indicates weakness in price.
There is the same divergence between the two points between price and RSI indicated by yellow lines. RSI has not managed to make new highs as price has made new highs, indicating weakness in price.
There is the same divergence between price and Stochastics.
There is now double negative divergence between price and MACD.
This upwards movement lacks strength, volume and momentum. It looks to be weak, so it is likely to be unsustainable. This does not indicate exactly when and where price will turn, but it does indicate that this upwards movement is highly likely to be deeply or fully retraced, and sooner rather than later.
VOLATILITY – INVERTED VIX MONTHLY CHART
Click chart to enlarge. Chart courtesy of StockCharts.com.
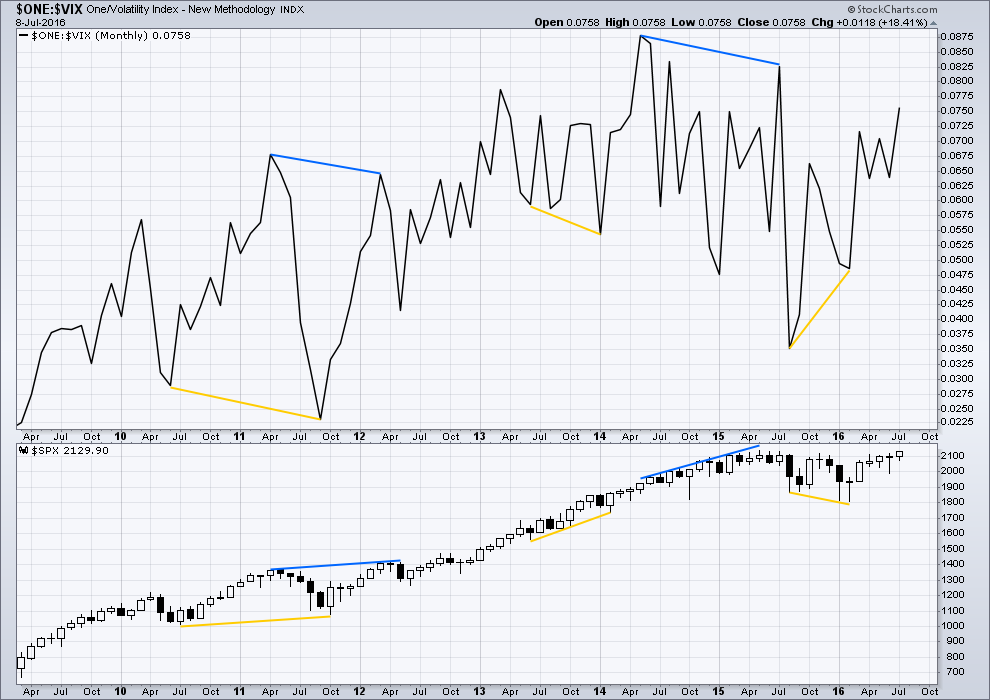
Several instances of large divergence between price and VIX (inverted) are noted here. Blue is bearish divergence and yellow is bullish divergence (rather than red and green, for our colour blind members).
Volatility declines as inverted VIX rises, which is normal for a bull market. Volatility increases as inverted VIX declines, which is normal for a bear market. Each time there is strong multi month divergence between price and VIX, it was followed by a strong movement from price: bearish divergence was followed by a fall in price and bullish divergence was followed by a rise in price.
There is no longer current multi month divergence between price and VIX between highs of April 2016 to 8th of June, 2016. Price has made a slight new high and VIX also has made a slight new high. It could be that the multi month divergence was resolved by the strong downwards movement of 24th and 27th of June.
VOLATILITY – INVERTED VIX DAILY CHART
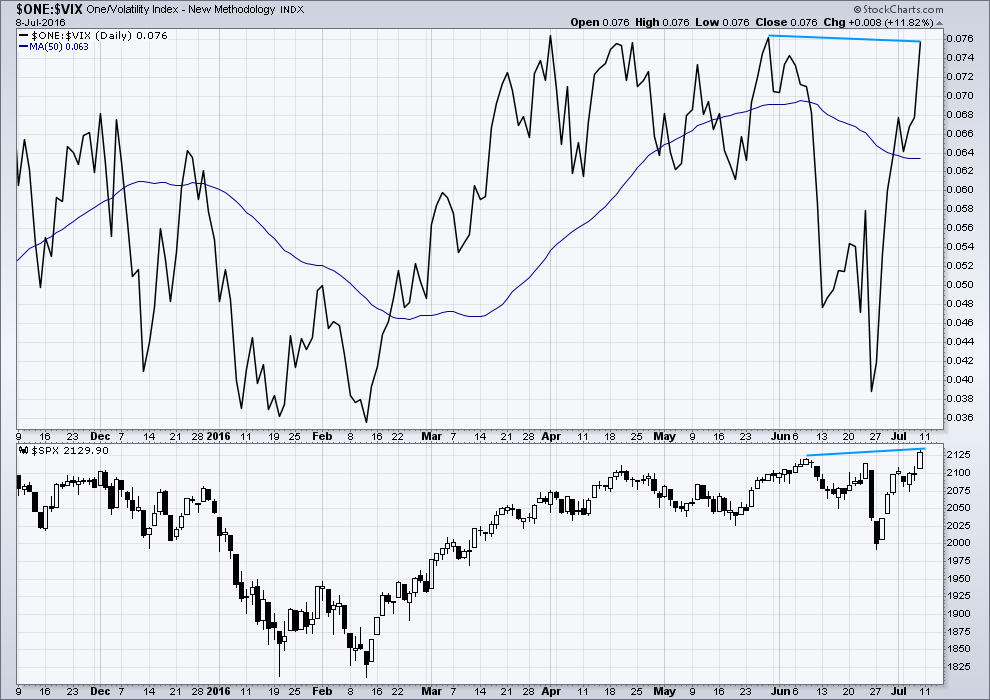
Click chart to enlarge. Chart courtesy of StockCharts.com.
VIX from StockCharts is inverted. As price moves higher, inverted VIX should also move higher indicating a decline in volatility which is normal as price moves higher. As price moves lower, inverted VIX should also move lower indicating an increase in volatility which is normal with falling price.
Price made a new high this week, on Friday, above the prior swing high of 8th of June. However, VIX has made a lower high. The new high on Friday has not come with a decline in volatility beyond that seen back on 8th of June. This divergence is bearish and indicates price is weak.
BREADTH – ADVANCE DECLINE LINE
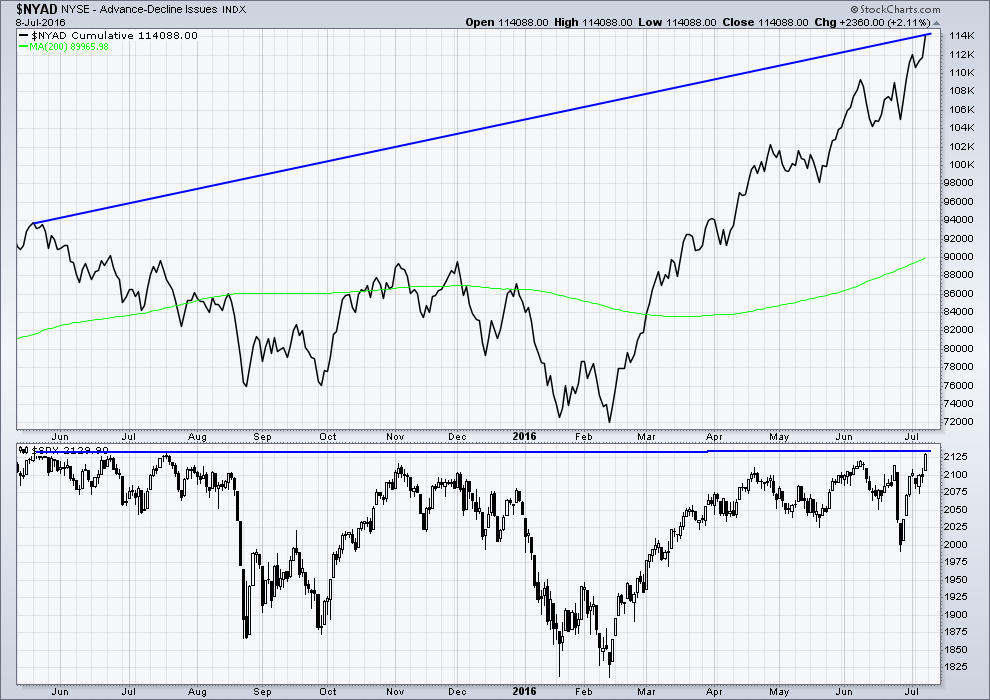
Click chart to enlarge. Chart courtesy of StockCharts.com.
With the AD line increasing, this indicates the number of advancing stocks exceeds the number of declining stocks. This indicates that there is breadth to prior upwards movement.
Taking a look at the bigger picture, the AD line is making substantial new highs but price so far has not. While market breadth is increasing beyond the point it was at in May 2015, this has not translated (yet) into a corresponding rise in price. Price is weak. This is hidden bearish divergence (long blue lines).
The shorter term bearish divergence noted in last analysis has disappeared as price made new highs on Friday. Divergence between price and the AD line is not always reliable.
BREADTH – McCLELLAN OSCILLATOR
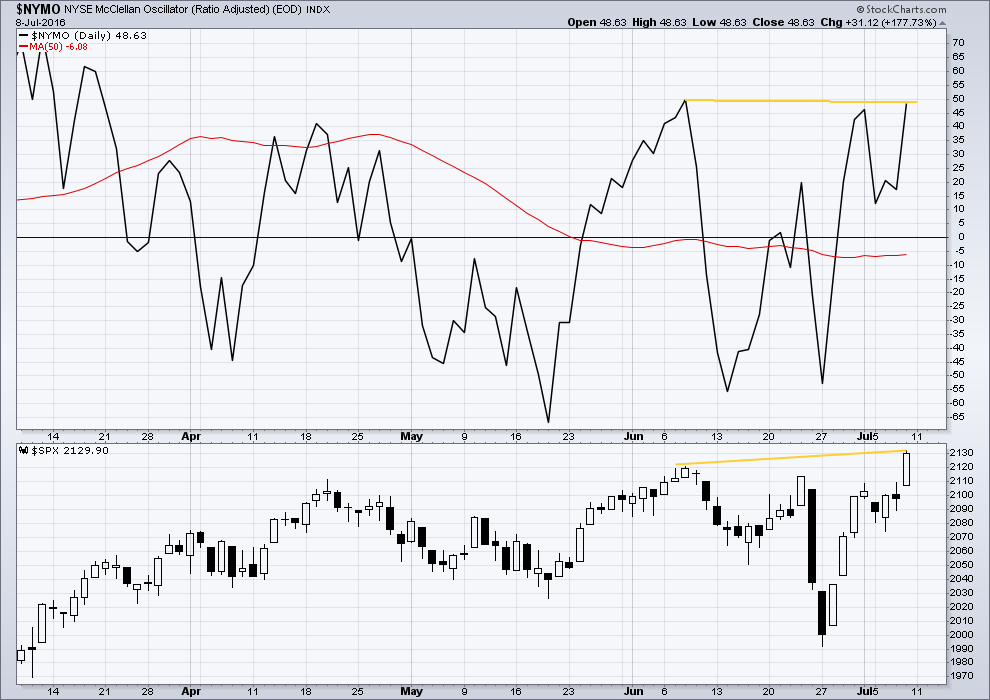
Click chart to enlarge. Chart courtesy of StockCharts.com.
Price has made a new high above the prior high of 8th of June, but the McClellan Oscillator has failed to make a corresponding new high. This indicates weakness in breadth to this upwards movement. However, the divergence is slight.
DOW THEORY
The last major lows within the bull market are noted below. Both the industrials and transportation indicies have closed below these price points on a daily closing basis; original Dow Theory has confirmed a bear market. By adding in the S&P500 and Nasdaq a modified Dow Theory has not confirmed a new bear market.
Within the new bear market, major highs are noted. For original Dow Theory to confirm the end of the current bear market and the start of a new bull market, the transportation index needs to confirm. It has not done so yet.
Major lows within the prior bull market:
DJIA: 15,855.12 (15th October, 2014) – closed below on 25th August, 2015.
DJT: 7,700.49 (12th October, 2014) – closed below on 24th August, 2015.
S&P500: 1,821.61 (15th October, 2014) – has not closed below this point yet.
Nasdaq: 4,117.84 (15th October, 2014) – has not closed below this point yet.
Major highs within the new bear market:
DJIA: 17,977.85 (4th November, 2015) – closed above on 18th April, 2016.
DJT: 8,358.20 (20th November, 2015) – has not closed above this point yet.
S&P500: 2,116.48 (3rd Nobember, 2015) – has now closed above this point on 8th June, 2016.
Nasdaq: 5,176.77 (2nd December, 2015) – has not closed above this point yet.
It is a reasonable conclusion that the indices are currently in a bear market. The trend remains the same until proven otherwise.
At the end of this week, while the S&P has come very close to its all time high the Transportations are strongly failing to confirm a new bull market.
This analysis is published @ 06:57 p.m. EST on 9th July, 2016.
[Note: Analysis is public today for promotional purposes. Member comments and discussion will remain private.]
I think regression to the exponential mean is going to win the day! We are headed down.
Notice at each Log 10 jump it needed to work off and go through a period of consolidation. I do not think we are done with that because valuations have not reset.
http://www.advisorperspectives.com/dshort/updates/NYSE-Margin-Debt-and-the-SPX
As much as I have been thinking Martin Armstrong is a little crazy, I must admit he has correctly called the US market action in the last 6 months or so. Apparently he bases his predictions on “capital market flow” analysis, and since the drop in January 2016 he has been preaching that there would not be a “crash” in US equity markets and that money would begin rotating into US equities, gold, and US dollars simply because there is a loss of confidence in governments and these investments would be considered less risky than most alternatives. Of course this type of rationale for investment seems to imply that markets will become disconnected from fundamentals, but it appears this is exactly what is happening in the short run. I guess I should give his insight a bit more consideration than I originally thought. He has a subscription service and professes to be building his computer model called Socrates.
Here’s an example of his thoughts: https://www.armstrongeconomics.com/international-news/politics/the-political-end-if-very-near/
SOMEONE KNOW AT WHAT TIME THE REPORT WILL be SEND……?????????????
Izak,
The daily analysis is usually out by this time of day. However, due to market conditions and a video being produced, it must be taking longer.
Reproduced without copyright approval from master poster VerneC : )
“I am quite curious to see if the other indices play catch up with SPX. Some of them have quite a ways to go to return to bull market territory. I cannot imagine that SPX will continue in a bull market for any duration in such a significant divergence from both RUT and DJT for example.”
He hit the nail on the head, Joseph posted on it too. Million dollar question is what about the huge price divergences between the indexes?
Even leaving out the Japanese and German markets – just the price divergences between the USA major indexes is stunning.
Not sure what to make of this divergence! Maybe other markets will play catch up Peter!
The put/call ratio has turned in favor of call buying so the BULLs have some goin for them. Im still expecting a selloff aftrr earnings
Hi,
I agree with Olga, something still needs to be discovered to tie fundamentals with human behavior reflected in EW counts and the FED which is the ultimate in fear based behavior. I am going to munch a few gummy BEARS and see if this can be sorted out!
Lara,
Huge respect for your work!!
Jim
At the risk of sounding conspiratorial , The “false flag event” must be blamed for the market crash, not the central bankers, nor any governments. Either that– or A huge Donald Trump victory in any debate with Hillary…..or a POLL that shows him winning……kinda like the Brexit Polls which moved world markets rather substantially.
This is not a “real market” anymore…it is purely orchestrated to manipulate the people of the world and control how they vote, think, and live…..Problem, response, solution.
sorry but I had to get that out of my system
Good luck to all!
John,
I think you nailed it as a Trump victory will be the black swan inside event and will it not make sense to ramp and offload the inventory like they did in Internet bubble or housing crash and scoop it back at dirt cheap…
If this rally is heading towards higher levels (2,177), PM bulls need to be very careful as overnight the PM might wipe out weeks worth of gains. A lot of money is parked in the PM such as GOLD and SILVER and with market over major resistance and making to a ATH despite Brexit and other negatives will attract rotation money into equities. Whether we like it or not, tape is telling us a different story despite the awful fundamentals. I am waiting for the earnings from big banks and given the huge rally of Brexit lows, very likely the major banks made a killing and going to exceed the estimates that were brought down last QTR.
Alt count on daily SPX. Looking at hourly chart for upside target for B up, 2150 is one. Admit I don’t like the B up sticking above the top of 1 in a box. Have one more alternative to consider yet.
interesting Peter…..this matches also the Russell2000 in my opinion.
Lara, is it reasonable that what Peter is showing, we are in a 3-3-5 corrective pattern of a wave 2 ???? that means that we should see price come down soon… right?
what targets can we put around the c of B completing? and target for C?
Yes, entirely reasonable. I have this idea in an alternate published in comments below.
A second wave correction continuing as an expanded flat.
They’re really common structures.
Volume today is pretty light, volume is declining. So this is going to be my main wave count (I have 1 ending earlier though, I think the proportions for 1 are then better).
I think Peters idea is pretty much the same as EWI.
Second alternative count.
Possible. But it has horrible proportions between 1 and 4, so that has to reduce probability for the idea.
“horrible proportions”, don’t blame BREXIT on me! 🙂
LOL
No, I’ll blame it on Mr Market 🙂
Bulls OUT all over the place today…
DOW 50,000!
by J.L. Yastine
July 8, 2016
A massive stock market rally is at our doorstep, according to several noted economists and distinguished investors.
Larry Edelson, a Money and Markets editor, predicts: “The Dow Jones Industrial will lead the way higher and catapult to 31,000 over the next two years.”
Ron Baron, CEO of Baron Capital, thinks: “It’s going to be 30,000.”
Jeffrey A. Hirsch, editor-in-chief of the Stock Trader’s Almanac, believes it will go even higher: “The Dow Jones Industrial Average will surge to 38,820 in a ‘super boom’ beginning in 2017.”
However, Paul Mampilly’s “Dow 50,000” predication is really catching eyes, and one should pay heed — considering his past predictions have been spot-on.
http://thesovereigninvestor.com/exclusives/dow-50000/?z=526424
Okay, so I’m going to be very open and honest with you all.
Firstly, I’m a bit shell shocked this morning. Clearly this is not what my analysis expected, a new ATH. I want to apologise for getting it so horribly wrong…. and that was only somewhat mitigated by the bullish alternate providing a road map.
I have noted that price managed to rise for years on light and declining volume, and it was possible that could happen again. And here we are. Price again rising on light and declining volume.
My first thought was all that learning, all that reading, all that careful analysis and objectivity…. was all for nothing.
But at the end of the day I don’t think so. Price simply cannot rise forever and forever on declining volume. Eventually there won’t be any buyers left. Eventually wider society will retract the licence for bankers to keep propping up this market.
But not yet.
I have spent time today on the historical and monthly charts. I have some conclusions, I’ll do a video today to make them clear. Bottom line, the bear makes no sense anymore.
I’ve found a solution for the horrible subdivisions on the bull for cycle IV. I’ve got something I can publish and not be embarrassed by.
At this stage we need to see a five up complete from the low at 1,810.10, whether bull or bear at monthly chart level, that still has to complete. So far there is only 1-2 with 2 may or may not be over. So now we have a new ATH only the bull survives, and it needs to see price keep going up for months at minimum, a year to two possibly.
I’ll have two daily charts for you today. The first in the analysis above with primary 2 complete, the second is published in comments below with primary 2 incomplete.
I need to wait until StockCharts data is final to get volume and determine probability of those two.
No need to apologize. You did your best analysis. Market is its own beast. Eventually there will be a crash.
Lara,
The one thing you’re wrong about is that you got it “so horribly wrong.” Your EW analysis is better than any I’ve seen.
The market does what it will do. And the beautiful thing about EW analysis is that it provides specific price points that invalidate even good, reasonable wave counts. You gave us that price point months ago, at the previous ATH, and you offered an alternate wave count just in case.
Nothing could be more right than that!
I look forward to seeing your revised bull wave count. Meanwhile, at least for a while, I’ve gone back to scalping intra-day price swings in UWTI/DWTI. It seems to be the one trading scheme that I’m able to pull off somewhat profitably. And happily enough, my lovely bride fully approves…
You’re an exceptional and very thorough EW analyst. I blame QE1, QE2, QE3, … for making the market so hard to map. I wonder what the monthly charts would have looked like without the QEs.
Def no need to apologise. Imho if you are going to be wrong it is better to be wrong for the right reasons – long term success very much depends upon it imo. Your technical reasoning was and continues to be sound.
I am hoping that as more waves are traced out, something appears which makes sense of the world and technicals we see around us.
Thank you all.
Yes, Lara…there is nothing to apologize about. I have been learning a lot through your analysis and the help of many on this site. There is nothing to apologize about. This market is bizarre to say the least.
Also, i was wondering what your thoughts are about Peter counts? It seems after today, we all agree in one form or another that we are in a bull count but a selloff is imminent as well.
If Peter counts is correct, how long can we expect C to take? could it take all summer?
I’ll be answering that question in analysis today.
Thanks for the confidence Jules.
I whole-heartedly agree with those comments. One of the things I learned from Steve Nison during a candlestick course I took with him a few years ago was that “There should be a number that tells you you are wrong!” I for one am grateful to get analysis from someone who is not so wedded to particular point of view as to be unable to make adjustments when circumstances call for it. I too would be thunderstruck of we do not see a market crash of some kind this year. It would be the height of folly, considering what we are seeing, to continue to trade the market as if that were somehow an inevitability. So I agree, no apologies needed…just keep doing what you do so well! 🙂
I am quite curious to see if the other indices play catch up with SPX. Some of them have quite a ways to go to return to bull market territory. I cannot imagine that SPX will continue in a bull market for any duration in such a significant divergence from both RUT and DJT for example.
AA Reports: The ONLY important number…
Revenue DOWN 10% Year Over Year… Everything else is BS!
I’m afraid I am not too impressed with projections these days Ris.
My approach will be to assess what I see with my own eyes and make my best judgment. UVXY closed green today. I will simply see what it does tomorrow…
Alcoa trading up 3% after hours post earning release.
Here is why… The ONLY number that matters is the Year Over Year Revenue Number! Everything else is fudged!
Use AA as an example where Revenue is DOWN 10% Year Over Year:
How Alcoa Just Converted A Half A Billion LTM Loss Into Half A Billion Profit
http://www.zerohedge.com/news/2016-07-11/how-alcoa-just-converted-half-billion-ltm-loss-half-billion-profit
VXX is projected to go into single digits over the coming weeks and that means UVXY will get clobbered as well.
Now that the bull count turns out to be correct, by July 25 UVXY will be trading for two or three bucks at the most and the 5 for 1 reverse split will take it up to the 15 dollar area or so, where it will be promptly shorted again back down to single digits. That may be the easiest trade to make in the next few weeks
Here is what I see. This move off the lows looks like a huge three wave affair. Most major indices including DJI, SPX, NDX kissing upper BB. DJT printing a spinning top and IYT a doji. VIX up during what is supposed to be a triple third to the upside. Something does not quite add up. I would not be long this market…but that’s just me!
Have a great evening all. See ya in a few days after it all works itself out.
Vern,
Caution is advised as slight hint of growth or positivity in Alcoa’s earning will add fuel to the fire as US markets will standout from the others better attracting more monies from abroad. Perfect buildup into the election months..hot economy, low jobless rate, strong currency…but there is going to be downside to all this but short term is not healthy for bears.
I agree caution is warranted – on both sides of the market. Unless technical analysis has become a totally irrelevant metric, third waves do not generally begin the strongest portion of their upward move pinned against the upper BB. Having said that, all the bearish indicators did not previously issue in a market decline so yes I do agree; caution all around is in order. When I don’t fully understand what I am observing, for me its time to SOH…best of luck!
ps I think we should see a successful re-test of 2100 at which point I would think it is up and away!
I just got short, let’s see if we can get some selling into the close.
Lara,
Would it be wrong to ask whether all the bearish technical analysis over the past several days, assuming it remains valid, points to the alternative bull count as more likely, as it expects an impending decline? Or, have any TA indicators changed with the new ATH to support the primary daily bull count? Definitely looking forward to your analysis…no easy task in this market!
No, you’re not wrong there. It’s a fair observation.
I will have two daily charts today, you have them both in this analysis.
I have yet to go through the TA portion, I’ll do that once StockCharts volume data is finalised. Then I’ll make a judgement as to which daily chart is more likely.
Thank’s for all your comments. Useful when you are spectator from the wrong side of the market…
Something seems apparently wrong in all this market behaviour…
allow me please this image, reflecting my (un)conscious perception of all this… (shutterstock images)
What goes up fast can come down fast.
This is going up slowly though…..
But it is still weak.
Any way for this to be some kind of expanding triangle – maybe a barrier ? Would need to end around here .
I know that assumes we are now in some sort of bull count – but does point to a low ahead .
Someone had mentioned a megaphone pattern previously…
http://www.trending123.com/patterns/reverse_symmetrical_triangle.html
Also, noticed a bearish divergence of the RSI with price where the top trendline is shown. One could argue a double divergence. Not sure if today’s action has resolved that divergence.
Thank you Ramona , Today was the top of d on that pattern ( expanding bull )
We may get an E down , and it would be an ABC down .
http://money.cnn.com/data/fear-and-greed/
What could possibly go wrong?
(Don’t look now – UVXY just turned green)
time to short it
You now short UVXY?
scalp until market loses some hourly moving average supports…
Anyone hear what Martin Armstrong’s “Socrates” computer is projecting ?
No, what is it predicting?
Or was that just a tease? LOL!
A real question. Armstrong allegedly touting an algorithm named “Socrates” that makes market projections. Curious to see what it says.
FWIW, SP starting to look “toppy” here. Still a little too early for me to jump back on the short side, but watching it closely……waiting for the short term trend to change from up to down before entering my short.
Yep – ‘toppy’ is definitely going on my dartboard lol.
LOL… It should as that’s how my trading feels some days Olga. I guess I should add some color. Momentum has slowed…dramatically, short term trend is still up.
BTW, nice to see you back. We missed you! 🙂
Thanks Quang
NASDAQ all time closing high of 5,048 is now within reach and will act as the magnet. Intraday high for NASDAQ for an ATH was 5,132. Upcoming earnings likely to provide the push (as negative earnings will be discounted and anything positive will ramp the markets, just as we have seen in the past QTRs)
So this is (possibly) a 3rd of a 3rd of a 3rd…..???!!
Like watching my tortoise climb stairs 🙂
We’re right on the edge of 2 x (a) for (b) if the 2074 low was wave (a) of an expanded flat – any higher then this move from 2074 isn’t a (b) wave of an expanded flat imho.
Albeit, not sure many members are in the mood for EW ideas today
I might start ‘dart board analysis’ – thrown a dart and see whether it hits up or down… 🙂 🙂
lol… might as well Olga
I’m going to stay short for at least 48 more hours… it will probably cost me but in the past I have exited my short positions a day early more times than I wish to recall.
To make it a bit more effective, one must first be blindfolded then spun around a couple times.
Once everyone has ran out of the room the analysis can commence 🙂
(*All pets should be placed outdoors during proceedings – don’t want them skewing the results)
rotfl
Olga, thank you for the laugh. So good to see you back.
as we saw today the s&p pass the ressistent and go up in eliott wave your analise for now its up but we have problem with the volume
that its not support in the market up so how now we can truse the up??? please help me
I’m staying short, was stopped out of e-minis, but loaded up on puts from before and just added more this morning. Jul 29 strikes mainly, a few Aug 5th. OEX and QQQ. Noting all bought from prior gains so no skin off my back.
where is the ramp up from all the shorts being stopped out?
here is it lol
DJ Transports appear to be leading all other indexes and have been since 2014…. Screw the S&P 500… I am watching the $DJT today!
I have exited all current open short positions for a loss. The good news is I traded successfully at the lows (Brexit) and am slightly positive overall for where the S&P is trading at now vs. the last highs.
Also, I got long gold about $100 ago based on Lara’s analysis at the other site. With helicopter money coming from everywhere and bank bailouts ready to go, I believe gold will continue to be the absolute winner for the next few months.
I don’t think 2500 is in the cards for the S&P 500, so I’ll be eyeing analysis that can portend a completed bull top sooner vs. later. I think October (ala 2007) is a reasonable time-frame to give the market some breathing space. One thing that has really concerned me as a bear recently is that the ECRI leading indicators are sticking to their highs. This tells me Q3 earnings are likely to be strong.
GLTA and consider the opportunity to join the trend in gold.
If S&P is marching toward 2,177 zone, DJIA will likely be over 18,750 to match the same. NASDAQ seems to be the leader yet again and its influence on the S&P is discounted way too much.
Just can’t get excited about the primary daily bull count because of the technicals and the fact that the other indexes no where near ATHs. The NYSE composite index ($NYA) is looking like a potential triple top, and transports are deep below prior swing highs. Like many here I am leaning toward the alternate that expects an imminent drop — or Olga’s thesis that there might be an elusive bear count somewhere in this mess. Mr. Market is definitely not making this easy…
FWIW, look at the recovery on PCLN from 1140 to 1356 in span of 5 days. Looking like it wants to hit the ATH as well.
The only good news today for the Bears: “Gartman Capitulates On Shorts: “We Have Had Quite Enough; We Want Out Now” 😉
LOL. Always a good sign 🙂
this is really making me question if I want to exit my shorts.
That’s it… DOWN from here!
Have a great day folks!
There went 2134.71!!!
Well to say I am frustrated with this market and disappointed with TA & EW is the understatement of the decade. We are witnessing a new ATH in equities and new ATL in bond rates. This has never happened before. We have seen very bearish TA indicators for 14 months and yet the market resists going down below 1800.
I must conclude that the central banks have colluded to prop up the markets. I have thought for a long time we might not make new lows because of the upcoming presidential election in the USA.
I will exit all my short positions at the open this morning. I am then off and gone for some time. A vacation is at hand. I am not going to be doing any trading until my disposition changes. I have just wasted 14 months of time and I am not going to do that again. I don’t know what else to say except, good luck to all.
I am going to miss you Rodney and I certainly share your sense of frustration. I am also taking some time to reflect and re-tool. All the best my friend.
Our new spx ATH is nothing more than all the European, Japanese and Chinese monies (real and phony printed) coming into the USA for safe haven buying our bonds and stocks. Explains why both stocks and bonds are going up, and gold. THEIR markets are tanking. Central Banks, i.e. politicians, have had the last laugh on us USA bears with their distortions.
Rodney,
I hear you and will miss you for sure. I don’t think FED is going to let the grip on market go that easily especially when globally, they seem to be the only one in control of their markets. All other markets are in trouble.
I know exactly how you feel, and feel your pain. May be joining you on vacation (in spirit)
FWIW – 2007 had a higher high before collapse (chart from tradesnoop – youtube)
I know it is not predicted by our bullish EW count but that scenario is exactly what I think is likely to happen. I will be waiting for SPX 2100 to fall for the first signal the party is over. I think SPX 2500 or even 2200 is a long shot. If this market breaks 2200, even on low volume, I will have to change my tune and conclude that regular TA as we know it is no more.
Having said that, I think we are in a terminal fifth wave up; I just don’t know how that fits in the world of EW theory. Just my two pence….
I agree – I’m really struggling to chase this market higher / go long here despite the process of ellimination suggesting that’s exactly what I should now do. It just does not pass my ‘sanity test’. This is not based on emotion – it is based on every absolutely obvious technical / fundamental.
Work based on technical evidence is what I do – so it is usually a case of black and white – these skills help me take the emotion out of trading. If I’m trying to find a fault it is based on facts – but occasionally what seems to be fact does not pass the basic ‘sanity check’. At that point I step back as there must be something I’m not seeing.
I feel like that is where I am now with this market. There must be a count I am missing – until I find it or the world greatly improves, I’ll be sat out of the next rally. For me the risk is (currently) still far greater than the possible reward of being long.
I’d rather be wrong for the right reasons tbh – that approach might have lost me this battle, but it is still very much winning the war. I’ll certainly never sign up to the ‘blindly follow the FED’ crowd. Anyway… damage limitation is the name of the game now – thank goodness for PM’s and crashing GBP 🙂
Maybe I’ll be eating my words, but I reckon a bear count will show itself – there is no way on gods earth I think we will get to 2500 with everything around us falling apart
This S&P 500 is complete BS!!! All fundamentals point to a global recession… and this thing is hovering in serious nose-blead territory. I just don’t get it!!! Elliot Wave theories or not! I just don’t see going all in and buying this thing if we go over the 2134.71 mark…. I am sure that I am not the only one that feels this way?
Several months ago an analyst at Stansberry Reserach Steve Sjugerrude was arguing against a top being in as he had not seen the kind of euphoria that normally accompanies market tops. At the time I thought he was completely wrong and that the TA evidence was very much against that point of view. I think the absence of euphoria is about to change and do so dramatically. True price discovery is clearly busted – a very perilous state of affairs in my view. Of course we have known this for quite some time; we just under-estimated the CBs.
Marty, You are NOT Alone… but in the minority.
Extreme Bullishness/Complacency has been and still is in play… no matter how they try and Hide this fact!
Follow your gut/instincts/brain… Don’t fall for the BIG CON that has been Orchestrated by the powers that be.
I am with you! If I hear that statement price is all that matters line again… I am going to puke!
Joseph… It’s just frustrating trying to invest in a world where reckless money being printed is miss allocated everywhere.
The Bond market is at all time highs and the S&P 500 at all time highs. WTH!!! Gold and Silver are the only sector left to invest in……hmmmmm!
This is the perfect juncture for a Black Swan!
30 US Year Treasury Bond Yield is screaming Deflation! But nobody here believes me! So Be IT! The blind leading the blind… Off a cliff!
I certainly understand your frustration Joe. I have been thinking and saying the same things you are for a few years now yet here we are. I personally am not at all comfortable buying this market and so I may miss out. I am sticking with simple trades on interest rates (still underwater so far) and what I think is a correction due for metals because of the current extremes in both those markets. I still expect the bond market to tell the truth ultimately.
Remember… you can have a 20% – 30% down in one day in a so called bull wave count! You had one in 1987!
The 30 Year US Treasury Bond … is telling the truth right now!!!
Deflation… is upon Us! Let the huge Bond Haircuts begin!
That is default Haircuts! Not price haircuts… There is a significant difference!
In 1987 they didn’t have all these computers and measures to stop the plunge. The problem now-a-days is that they just stop the computers from selling or put in massive buy orders from the plunge protection team. There are no markets anymore….. Obama already knew something when he said people are peddling fiction. I am not a bull by any means but watching dumb money just buy and go up is ludicrous to me.
I am out of here!
I will let you Bulls and “Price is all that matters worshipers” get all giddy and bask in your temporary Glory! But it will be short lived… very…very…very short lived!!!!
Joseph… I am with you on that! Have a large short position in the S&P believe it or not… just waiting for the reversal. The 10 yr is at 1.366 this morning.
Same here and holding it… no matter what happens today & this week!
Goodbye all Weak Hands! See Yaaaaa!
The peril in the bond markets cannot be denied yet rates continue lower and equity prices higher. PR defaulted, DB is clearly insolvent, as is Paschi, two of Europe’s largest banks, and we are on the verge of all time highs in US markets, with European markets are also on a tear. The clear lesson I think Joe is not that price action is necessarily right, it is that price action in the markets is completely divorced from reality, and how long that continue…who really knows?
That really is the BET!
Price ain’t going to tell you shit in this world!!!!
Only knowledge & use of your Brain will!!!!!!
I don”t disagree on your point about defaults. However, you are never going to get a signal that the crowd is finally becoming aware of that very real possibility until yields reverse. Even in a deflationary environment, skyrocketing yields will be the trigger that ignites the panic. As long as yields continue to decline, it means that folk are still fast asleep despite the imminent peril. At least that is my interpretation.
NOT In UST initially… All Non UST yes!
Okay, everybody’s witnessing the same thing. All you guys have opinions way over my head. It’s very educational for me.
Lara, will you please do an hourly chart for the bull count?
Yes, its time isn’t it.
This hourly wave count would be for the bull daily published in the analysis above. It expects price may be in a third wave at two degrees upwards. Short term target minor 3 = 2.618 X minor 1 = 2,181
If it’s invalidated below 2,089.29 then the bull wave count would be more likely the alternate daily published below in comments; primary 2 may still be underway, target 1,920.
I know some folk scoff at the idea of “rigged” price action in the markets. In hind-sight one cannot help but wonder at the announced reverse split of UVXY. I remember asking myself when I first heard about it- ” Do those guys know something I don’t?!”
I even went back and looked at price action after reverse splits in the past. After all if the market did what we were all expecting, a reverse split would be pointless. Now we know.
The good news is that we also now know exactly what to do ( as I am sure countless others) as soon as that split occurs….
That apple trade is starting to look real interesting…
This pig just got slaughtered.
Yes… The Bulls will be slaughtered.
Then their B _ LLs hung as an ornaments!
Never to be heard from again!
One thing is certain. New ATHs are going to result in even fewer traders willing to short this market than before. I am not sure what expiration puts Soros is holding but it looks like he is going to be feeling some pain. This entire thing could also be a tussle playing out between guys like Soros and the CBs. Retail investors are not as significant as they used to be. That is a most interesting consideration as the basis of EW theory is sentiment of the masses…good food for thought…
Good Shake Out The Weak Hands… then Crash!
You simply cannot deny the ability of the equity markets to defy all economic logic. What I am most interested in now is identifying what tools may be useful in telling us likely market direction in the short and medium term. Regular TA has had a difficult time doing that reliably.
We may have to simply stay with a scalping strategy. I am not at all convinced that any directional trades in this market will lead to profits; I have been stopped out of every direction trade base on EW and TA analysis the last several months so I am willing to take a different approach and do only scalping trades for the time being.
Yea… If you have been around a long time… Follow your Gut and Brain!
Price ain’t going to tell you shit in this world!!!! Not at this juncture or at this moment in time! Nothing is as it appears!
The algorithm’s are tainting the technicals!
I have seen dozens of Futures reversals from 3AM to 8AM in the last year… so those throwing in the towel already should remember that!
ES 2134 is ATH
2133 is high now
True. The bear has to be invalidated by cash data. Not futures.
It’s just not looking good. And unfortunately, my broker’s using futures data 🙁 🙁
A lot could happen before the open, /ES is off its highs at 2128 and oil is down.
Nikkei is blasting off…
The bears are jumping…
The Bulls will Blow themselves UP!
LOL
I got ran minus 6 on my last trade so redoubled on patience and have been SOH ever since, just watching.
Expecting cash to confirm futures later today and reckon there is about a 50 point range (2135-2185) to hunt for a short entry to take us back to circa 1950.
Before I’m stoned to death for another “random market prediction” I’m on mobile and so have no charts to back this idea up, but FWIW that’s what I’m on the look out for and will post trade when I take it.
Stuart,
Your projections sound similar to Lara’s alternate bull count posted in the comments below, no?
Yeah, similar.
However I have been calling for this for quite some time and thought it useful to post the range I’d like to see price reverse (which is absent on the alt bull count)
Thought this might be useful to other traders.
That said, If we break and hold 2185 then the chances of seeing 1950 again anytime soon essentially disappear imhumbleo, so fairly key trading range this
Absolutely. Much appreciated to hear your thoughts and trading ranges!
I have to agree and would go a step farther. The way the bears surrendered the 2100 pivot this time suggests to me that the bulls are not going to give it back anytime soon. I suspect it will now act as very strong support so I for one would not be expecting 1950 anytime in the near future. I am wondering if all the other indices will now play catch up? Would it be a bit ironic to think that all the TA that formerly indicated bearish price action, can now reliably tell us anything about how high this movement is likely to go? Feels like literally and figuratively uncharted waters… 🙂
Russell has been leading the way with this move up Verne.
Every time I doubted the Bulls I just had to look at that index for reassurance.
I’m still a bit unsettled about this move up sticking for too long though and still think we will see that 1950 area. Time will tell I guess.
You are a 100% right about a paradigm shift though. All usual correlations out the window!
This feels like a big funeral. Maybe a 20 point gap down will make everyone feel a bit better. After all, it isn’t even midnight here in the states.
Shots for everyone … who’s ever long has to buy!!
oddly I don’t feel too badly about this one.
The risk/reward setup was incredibly good. It didn’t work out. Regroup and move on.
Not crying at this funeral.
Exactly. It’s all an exercise in probability.
It didn’t work out on the short side. Now to look for an entry on the long side.
But before I do that, cash has to make a new ATH. Futures alone isn’t invalidation of the bear wave count. It just makes it look likely that the bear will be invalidated.
It is a bit frustrating to think that all the indicators of the expected bearish price action were not right. Hopefully the next few days will bring some clarity. How to view the price action going forward is going to be a challenge
I really have my doubts on the big drop.
Sure looks to me like an EW 5 “up” to S&P 2500 is unfolding vs the big drop. I watch the stochastic very closely as a momentum indicator and they have improved greatly in the daily/weekly/monthly of the SPY. Also, from a basic 101 trading perspective, I could see a few days of short covering from Brexit but not a week!!??
Of course, only another opinion but I’m looking to buy the dips rather than throw on the big short. In our wonderful 20-20 goggles, very frustrating when looking at that damn Brexit “emotional” plunge … which to me was now an absolute screaming buy on the long side!
If we break ATH why don’t we just board the train and profit to the upside?
We will.
My job will be to look for a good entry point.
We can make profits either way.
Futures have just made a new ATH.
For this wave count though to be invalidated we need the cash market to make a new ATH. Because the wave count is based on cash market data, not futures. The wave counts can be slightly different.
But it does indeed look like we shall see a new ATH now.
What data feed are you basing the new ATH high on? The data feed I have (thinkorswim) shows futures high so far at 2133…just wondering about the discrepancy.
My broker is CMC Markets, they’re a NZ broker. The prior ATH with that data was 2,137.14. It’s just now made a new ATH at 2,138.56.
Ok thanks. For some reason there is a few points difference in my broker, with the ATH (2134) still not reached by a point.
Lara how are you trading this with your short positions? Do you have a stop at or near ATH?
I sort of agree with the others here that we may get the ATH but still see a significant drop after reaching (and exceeding) the ATH by 10-30 points.
Any thoughts on your strategy at this juncture?
I’m stopped out.
Now I’ll wait for a correction down then go long. For now I need to SOH for a bit and breathe.
Got it – thanks!
Since we are just a few points shy of bear invalidation, it feels like it wouldn’t take much for the banksters/algos to put in some large coordinated buy orders and engineer a new all time high (I believe Verne mentioned this earlier as well).
With that said, I’m wondering if there’s a bullish count that allows for a new all-time high and then a significant drop/correction shortly thereafter? I’m sure there are significant short positions out there with stops in the 2135-2140 range, so wouldn’t it just be cute if the market runs all those stops, ramps quickly up to about 2140-2150, and then proceeds to thrust down? 🙂
This is has been a very tough market to trade, should be an interesting week.
To be very honest, it does seem to me that all the chatter about whether SPX is going to exceed 2134.71 is purely academic. I think it is a foregone conclusion based on the price action so far. I would be deeply suspicious if that level is not taken out. My problem is how that event is to be interpreted. We are clearly in a global slowdown with recessionary winds starting to blow and a continuing bull market in SPX, or any other index for that matter is a true enigma. In a strange way it would be nothing different from the enigma of the past seven years….I think you are right to expect some kind of pullback even with a new ATH…
The market is overdue for the axiom to hurt the most people most of the time. Expect the unexpected.
Truth…
I don’t think its a foregone conclusion at all.
We’ve been here before. 20th July, 2015. Almost exactly a year ago. The very first second wave correction reached 2,132.82 and couldn’t make a new all time high.
Second waves can be very deep. When they are very deep they convince everyone that the trend hasn’t changed. And they do it right before a strong third wave takes off.
Until a new ATH the bear wave count still on balance of probability is more likely. Because… all the reasons in the analysis above.
That’s not what I am wanting to see, that’s what I see.
“I’m wondering if there’s a bullish count that allows for a new all-time high and then a significant drop/correction shortly thereafter?”
Yes, there is.
Primary 2 could be continuing as a larger more time consuming expanded flat.
If we see a new ATH I’ll have two daily wave counts.
The daily bull wave count in the analysis above, and the alternate idea in the chart above here in comments.
The SPX daily and the VIX daily are both near their Bollinger bands. Of course the SPX is near the top BB and VIX near the lower BB. This itself would give good indication that a reversal in is order shortly. The same is true for both at the hourly level. In addition, it is my opinion that stochastics are overbought.
Thus, I would favor your alternate daily bull over the main bull count.
If we go to new all time highs and indicate a resumption of the bull market, I may just loose all confidence in TA and EW. We have been calling this bear market for 14 months. Of course we have not yet made a new ATH. Since the May 2015 high we have hit 2129.87, 2132.82, 2116.48, 2104, 2111, 2120.55 and now 2131.
All of those swing highs were within easy reach of the 2134 ATH. So it is possible that we will turn down in a third wave. Right now, however, my confidence level is very low. Tomorrow morning we should know the answer.
BTW, the Nikkie closed up 3.56% and right now the SPX futures are up 10.75 points.
That is the issue I have been hinting at and it is a sobering thought that all the clearly bearish signals the last many months could have been so wrong. I personally concluded a few days ago that the old highs would fall based on expectation of at least a 3% move beyond the 2100 pivot. What I am having some difficulty with is reconciling the clearly bullish price action with not only what the TA has been indicating all these past months, but what we know is going on in the real economy. I don’t mind admitting I have been wrong about market direction, I am now just forced to re-think the metrics we apply to try and make intelligent decisions in that regard. Could we be looking at a real paradigm shift when it comes to TA? Is it possible that determined CB intervention can actually reverse so many months of undeniable bearish market signals?
Just thinking out loud folks. I have no answers at this point. Time for me personally to step back, re-think and re-group.
The idea of a new ATH in SPX, a mere five points away, signaling possibly another year or so of upward movement would it seems to me turn marcro-economic theory on its head, and imply that there has come a final break between economic reality and equity prices as a result of CB infusions and irrational exuberance or both. After all, SPX earnings have been declining since 2014 and prices at these levels already are entirely divorced from reality. Stranger things have happened. I was certain that at this point the bond vigilantes would have called a stop to the insanity but longer term bond yields continue to decline and many are sure negative interest rates are on the way. That is the only explanation for bond bulls being at a multi year extreme. We are in the financial twilight zone people!
Here is a larger picture considerttion. It would be absolutely incredible for the indices, especially SPX to get this close to a new ATH and in the case of SPX not traverse the last five points. If the SPX is confirmed as still being in a bull market and DJI fails to make a new ATH how does that affect our view of the other indices, especially wrt to DOW theory? Does a new high in SPX imply that DJT also goes onto new highs? Is it possible for SPX to make a new ATH and other indices remain in bear market?!
I know there are instances in the past where an index has gone on to make a new ATH all alone only to join the others in bear markets in the past. Bottom line, does a new ATH obviate all other possible wave counts that permit a bear market to resume without first reaching the targets cited for the bull wave count? I know that is what has been stated but just wanted to confirm that to be the analytical viewpoint.
Vern,
Here is another one for you. What if SPX invalidates the Bear Count and NASDAQ does not? I expect SPX to complete a five way structure up and finish in August. While we may invalidate the BEAR count, I expect both SPX and NASDAQ to begin to decline in August. I cannot justify it with EWI analysis that everyone is working on but I can by signs of capitulation, fundamentals and long and short term Hurst cycles. Interesting times.
Looking for a Bear on my birthday now (8/16) 🙂
Jim,
Some are predicting markets at ATH around your Birthday so gives you a good entry point for opening a short position.
In fact Jim, that is exactly what it appears is about to happen. I know in prior bear markets an index has gone on to make a new ATH all alone prior to joining the others. What I think is difficult to see is how SPX could meet the new targets after confirming a bull count and join the other indices if they remain in bear markets. Ultimately the implication is if SPX goes on to new highs, the other indices would be expected to as well. I personally just don’t think there is any chance of that all things considered. There have been so many improbabilities of late I suppose anything is possible. We can almost be certain that the least likely outcomes are what we will see as that has been so often the pattern of late. I would be really bewildered of we do not make a new high in SPX after coming this close as it will not take much effort to get there.
Vern & Jim,
I am not too sure about NASDAQ dropping the shoe as S&P work towards a new ATH. If you look at the trend and interest on the FANG (with the exception of Netflix), there seems to be underlying bullish buildup. Additionally, like of TSLA, PCLN are looking to breakout towards new high (I know it the unreal how fast these stocks move). I am looking at AAPL and if that stock delivers a half decent qtr with some positive upcoming product cycle (iPhone7 update is due in fall), that alone will lend some seasonal positive bias to the NASDAQ along with S&P.
What is needed is a black swan event. This event if happens within North America might be expected to have a serious impact on the US and other markets in north america. I am not too sure about Europe etc as it feeds into the positive bias in the US markets.
So for the top 10 highest market cap, High Beta (>1.5) Nasdaq stocks, I am not seeing bullishness over the last month.
http://stockcharts.com/freecharts/perf.php?PCLN%2C%20BIDU%2C%20NFLX%2C%20LBTYA%2C%20NXPI%2C%20AMAT%2C%20CTRP%2C%20PCAR%2C%20AMTD%2C%20MU
Nor are Lowrys. This rise is driven by only a few large cap stocks.
All the rest are substantially off their ATHs.
It’s fundamentally weak.
Now, that doesn’t mean the S&P can’t make a new ATH, and that it can’t limp along upwards on declining volume to make new highs for another year.
The bull run from 2009 to 2015 was stark in how it continued on declining volume, particularly in the last couple of years. That could happen again.
If it does happen like that, then when it’s finally done, there’d be one whopping big collapse.
The candles in those indices seem to be telling a different story. A few strong components of the index can spur upside move for quite some time depending on how they are weighted and how much money flows into them specifically…in fact this may be one strategy being employed to mask weakness. It was certainly true for the so-called FANG stock which produced most of the recent index gains.
APPL is DONE as a mega growth stock! There is a long way down for that stock. All the analysts that love it are delusional! They have broken the golden rule… never fall in love with a stock. Love is clouding their judgement.
Joseph,
Agree on AAPL longer term but there are enough professionals with clients and position in AAPL that they just can’t drop over a shorter term and that too without any solid rationale. I think the large cash position and lack of a seriously bad move by AAPL management is saving the stock for now but product cycle looks very weak. Imagine if AAPL buys out TSLA (as this has been floated around for a while). They get hot product and a leader with vision which is what they are lacking. I suspect when they get desperate, things will happen (not necessarily the right moves) to create opportunities.
It is interesting that you mention Tesla. I was naturally assuming that big trade was made ahead of an expectation of a block-buster earnings report, but what if it is being made ahead of some sort of acquisition announcement? They do have an awful lot of cash and could continue to prop up their own shares for quite some time. They also recently floated additional bonds overseas.
Apple buying Tesla???
A Broken mega growth stock buying a company that is grossly overvalued (Revenue to Market Cap)… That would be one complete waste of Apple’s cash.
BTW: Cash Balance is NOT something normally talked about for a mega growth stock. 50%+++ Revenue Growth that is accelerating is what you should be discussing! Otherwise is a mature hardware company that can’t muster more than 10% to 15% growth of revenue.
Apple should NOT have anywhere near the market cap (Valuation) that it currently has. Neither does Tesla! Tesla is a cult stock… that has a delusional valuation.
I think Tesla is not nearly as attractive as some talking heads suggest. The offer to buy Solar City is somewhat strange as their cash flow is not that great. That purchase would make them even less attractive a target for Apple I would think.
Yeah. Those recent candles in small caps and NDX have been pretty impressive. It looks to me like big money is flowing into those indices. An then there is that monster trade someone placed on that APPL bull call spread for August…
From a Dow Theory perspective if the S&P makes a new ATH that doesn’t confirm a bull market. DJIA and DJT both need to make new ATH’s for a bull market to be confirmed.
DJIA and DJT at this point in time have confirmed they’re in a bear market. So they’re still in a bear market, until they both confirm they’re not.
But this is where Elliott wave makes the picture unclear, it moves before Dow Theory. If the S&P makes a new ATH because that changes the analysis so much for it then I’d have bull wave counts only for the other indices.
But here’s another spanner in the works. For FTSE a possible bull wave count looks so wrong. See the high of primary wave A (Feb 2011), see how price has now come back down to within that territory. That can’t be a fourth wave correction in an impulse continuing higher.
The only bull wave count for FTSE would be a series of 1-2, 1-2 from the low 2009. And the second 2 is so deep and time consuming, hugely breaching what would be a base channel about the first 1-2. It would look like a very strange wave count indeed.
FTSE is the clearest bear.
So if the S&P makes a new ATH could it mean that Britain and Europe dissociate from their relationship with the USA, they’re in a bear market and the USA is in a bull market for another one to two years before joining them? I suppose it’s possible.
Using Fib Arcs to estimate the time horizon if the Bear scenario wins out…
http://stockcharts.com/h-sc/ui?s=%24SPX&p=M&b=5&g=0&id=p82322287715&a=466762968
Hi Lara,
On using lower weekly volume as supporting the bear case, does it matter that it was a short week?
Very good point Ramona. I was curious about this as well.
I thought Friday’s ramp was supported by good volume across the markets.
It was higher than Thursday’s downwards day
But Friday’s volume was much lighter than the start of that upwards ramp. And it was lighter than Wednesday.
For the S&P.
That’s not a bullish volume profile.
A good point, but when you look at daily chart volume has still been declining from 26th June. While it is true that volume on Friday was slightly higher than Thursday, overall volume is still declining as price moves higher.
Friday’s volume (this is from StockCharts data) at 2,201 million was the lightest upwards day in the whole rise. With the sole exception of the very small daily candlestick of 1st July.
Another way to put it, the four days of last week still have lighter volume than the last four days of the prior week.
So the weekly volume bars are exaggerated in their difference, but by looking inside those two weeks we can see that the last week was indeed coming with lighter volume than the week prior.
Got it. Thanks!
Hi Lara:
Curious as to what you thought of the EWI chart. I am not sure why the degree on their fourth wave is so drastically different from your bullish count.
I thought the bigger picture which sees (2) (is that primary degree?) as a running flat for both S&P and DJIA is horrible.
But with (3) in the same place as I have cycle III for my bull wave count, it doesn’t matter too much.
I think that the end result in regards to expectations is the essentially the same as the bull wave count I have, in that it expects both markets are now in a fifth wave up, and within that fifth wave impulse a first and second wave is complete.
I think their short term structure is unnecessarily clunky (yes, that’s a technical term 🙂 ) with the first wave ending where it does, and so it looks like a three wave structure.
I also can’t see from the charts how they resolved the problem of C of 4 not looking good as a five, but having to count that wave as a five. That’s crucial. I strongly suspect that if I could see their solution I’d not like it. Why have they glossed over that huge problem?
I really would like to know why the degrees are different too. It would have something to do with the even bigger picture, the larger count on the monthly chart.
I know that back in 2009 I had essentially the same count as EWI, but over the years since then I’ve substantially diverged from them.
I stopped paying any attention to what they were up to for years. I was curious at this most critical juncture what they had…. just in case there was something obvious that I’ve missed.
But my conclusion is I don’t like their counts. I can see solutions that don’t have rare structures (with huge truncations) and have fives that look better.
So yeah. That’s my two cents worth. FWIW (about 2 cents)
Thank You! 🙂
I sometimes get the impression that they first decide what the market SHOULD be doing, then count the waves accordingly…
TBH I’m getting the impression that there are rather a lot of people that have decided what they want the market to be doing, what they desire and wish, and fitting into that view what they see.
Everyone is entitled to have an opinion. But the thing about technical analysis is it’s based on numbers. And numbers don’t have opinions.
If the numbers tell a specific story and your opinion differs, then your opinion is just wrong.
Like, if the S&P makes a new ATH on Monday then my bear wave count is just flat out wrong. I can’t try to come up with another one because I “feel” we’re in a bear market.
Feelings don’t count in this exercise.
Consumer Discretionary Vs Consumer Staples teetering on the edge…
http://stockcharts.com/freecharts/pnf.php?c=XLY%3AXLP,PLAIWANRBO%5BPA%5D%5BD%5D%5BF1!3!1.0!!2!20]
Deutsche Bank collapsing should be the trigger. 52 Trillion Euro in derivatives poof! When it gets to less than $10.00, game over.
http://www.zerohedge.com/news/2016-07-09/charting-epic-collapse-worlds-most-systemically-dangerous-bank
Thanks Jim. I heard the same thing last night, if or when DB hits single digits the collapse in Europe and banks everywhere will lead to a global bear market.
Look at the volume the last three days. Strong volume on down days.
Been bearish on DB for awhile but didn’t want to short because of the danger of a German government backstop. But I just read somewhere they said no bailout would be forth coming… That could likely change when it hits the fan of course. DB also has ties into Italy, so it is easy to see how this house of cards wipes out a lot of banks already teetering. DB looks to be well past the recover zone but when will failure occur? Without a trigger, it could grind along for awhile. If something puts the squeeze on DB – like Italy – this could go to zero fast.
Yes, agree, they will be forced to step-in and save but I believe it will be the rescue that will reveal how unstable everything else is and that is what will get be another step in the unravel.
Yeah, if they crash you can be sure a lot is going to go down with them. Germany may likely bail out DB but the other dominoes that fall won’t have a safety net, like Italy.
If a market is in a bear market then nothing any central government can do can ultimately stop it from falling.
If DB is in a bear market, then short it. They can’t stop it falling.
They can make corrections deeper, offering better entry points for bears though 🙂
A very bearish volume profile there for DB.
Not sure I’d want to jump in right now though, with volume falling for the last two days.
But prior falls, almost all on volume increases. Prior rises almost all on volume declines.
With a market cap of 15.8 B and levered 40X, the question is why is anyone willing to pay 12.60 for shares of the stock? That kind of leverage implies liabilities of around just under 740 B and it clearly does not include the stated notional value of their derivatives portfolio of some 52 T Euros. Astonishing that regulators allow derivatives to be kept off balance sheets. It sounds like now is a good time to start accumulating shares of FAZ…
I don’t follow or review the financials of DB… Can someone explain why a stock price of Sub $10 is the trigger and game over for the derivatives?
Does < $10 trigger some type of Capital Call that is written into their derivative contracts? Are the derivative contracts written to specify a EU stock price or a $ stock price?
That is exactly what I am thinking. The numbers already clearly say that DB is a dead bank walking…another two points to the downside or even the upside will alter nothing. I suspect the effect of a single digit stock price is expected to be primarily psychological….
turd!
Second
Primus