
Downwards movement was expected for Wednesday’s session, but this is not what happened.
Price remains below the invalidation point on the hourly Elliott wave chart.
Summary: Downwards movement should continue from here with lower lows and lower highs. In the short term, volume strongly suggests some more upwards movement tomorrow. A short term target is now at 2,029. A mid term target is 1,912.
Last published monthly charts are here.
New updates to this analysis are in bold.
BEAR ELLIOTT WAVE COUNT
WEEKLY CHART
Click chart to enlarge.
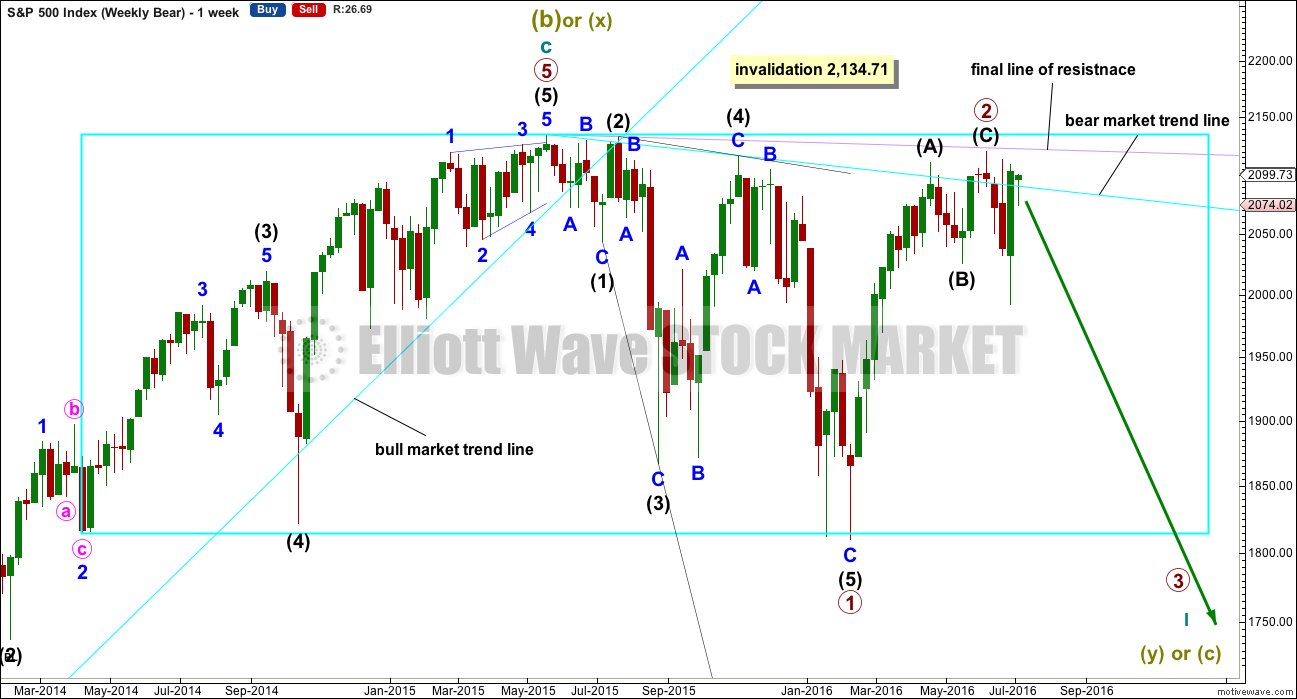
The box is added to the weekly chart. Price has been range bound for months. A breakout will eventually happen. The S&P often forms slow rounding tops, and this looks like what is happening here at a monthly / weekly time frame.
Primary wave 1 is seen as complete as a leading expanding diagonal. Primary wave 2 would be expected to be complete here or very soon indeed.
Leading diagonals are not rare, but they are not very common either. Leading diagonals are more often contracting than expanding. This wave count does not rely on a rare structure, but leading expanding diagonals are not common structures either.
Leading diagonals require sub waves 2 and 4 to be zigzags. Sub waves 1, 3 and 5 are most commonly zigzags but sometimes may appear to be impulses. In this case all subdivisions fit perfectly as zigzags and look like threes on the weekly and daily charts. There are no truncations and no rare structures in this wave count.
The fourth wave must overlap first wave price territory within a diagonal. It may not move beyond the end of the second wave.
Leading diagonals in first wave positions are often followed by very deep second wave corrections. Primary wave 2 would be the most common structure for a second wave, a zigzag, and fits the description of very deep. It may not move beyond the start of primary wave 1 above 2,134.72.
So far it looks like price is finding resistance at the lilac trend line. Price has not managed to break above it. If price continues higher, then look for upwards movement to end again if it comes up to the lilac trend line.
All three daily wave counts remain valid and all expect the same direction next: down. They will begin to diverge in coming weeks, so at that stage the differences will be important. Eventually, price behaviour will tell us which one is correct.
MAIN DAILY CHART
Click chart to enlarge.
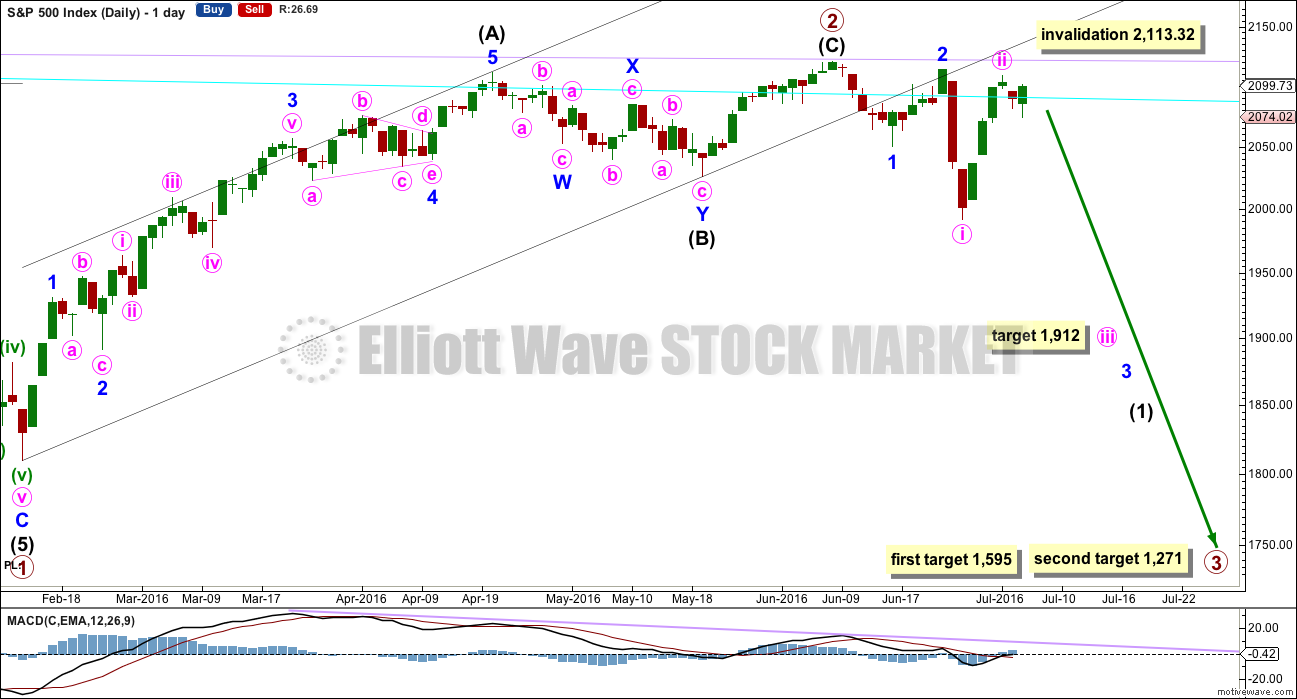
If primary wave 2 was over earlier on 8th of June, then primary wave 3 has begun. At 1,595 primary wave 3 would reach 1.618 the length of primary wave 1. At 1,271 it would reach 2.618 the length of primary wave 1. Primary wave 1 lasted 38 weeks and primary wave 2 lasted 17 weeks. Primary wave 3 may be expected to be longer in length and duration than primary wave 1. In the first instance, a Fibonacci 55 weeks is expected, but maybe also 89 weeks is possible.
Within primary wave 3, intermediate wave (1) may be incomplete. It may have begun with a series of two overlapping first and second waves for minor waves 1 and 2 then minute waves i and ii. This indicates minor wave 3 may be extending, which is common.
Within the middle of intermediate wave (1), a mid term target for minute wave iii is at 1,912 where it would reach 1.618 the length of minute wave i.
If minute wave ii moves any higher (and it may), then it may not move beyond the start of minute wave i above 2,113.32. If minute wave ii continues higher, then it would have a clearer three wave look to it. It may end if price again comes to almost touch the lilac final line of resistance.
HOURLY CHART
Click chart to enlarge.
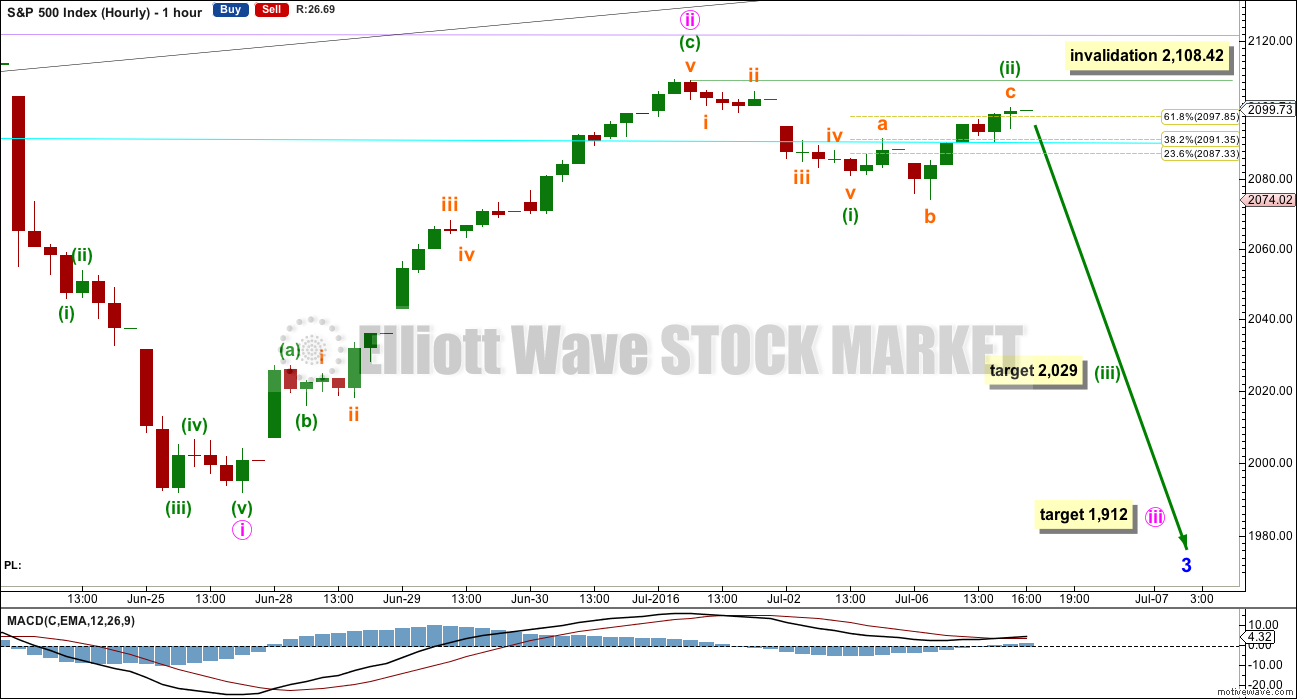
If the invalidation point here is breached tomorrow, then minute wave ii may be moving higher. Expect it to end if price comes close to the lilac trend line.
If minute wave ii is over, then at 1,912 minute wave iii would reach 1.618 the length of minute wave i.
The degree of labelling within minute wave iii is moved up one degree today because the strong green daily candlestick for Wednesday’s session looks too be for a correction at subminuette degree. This may be minuette waves (i) and now (ii) complete. Minuette wave (ii) fits as an expanded flat correction, and subminuette wave c within it is 1.11 points short of 2.618 the length of subminuette wave a. Minuette wave (ii) has reached up to just above the 0.618 Fibonacci ratio so far.
If minuette wave (ii) continues any higher when the market opens tomorrow, then it may not move beyond the start of minuette wave (i) above 2,108.42.
If minuette wave (iii) has begun here, then at 2,029 it would reach 2.618 the length of minuette wave (i).
ALTERNATE DAILY CHART
Click chart to enlarge.
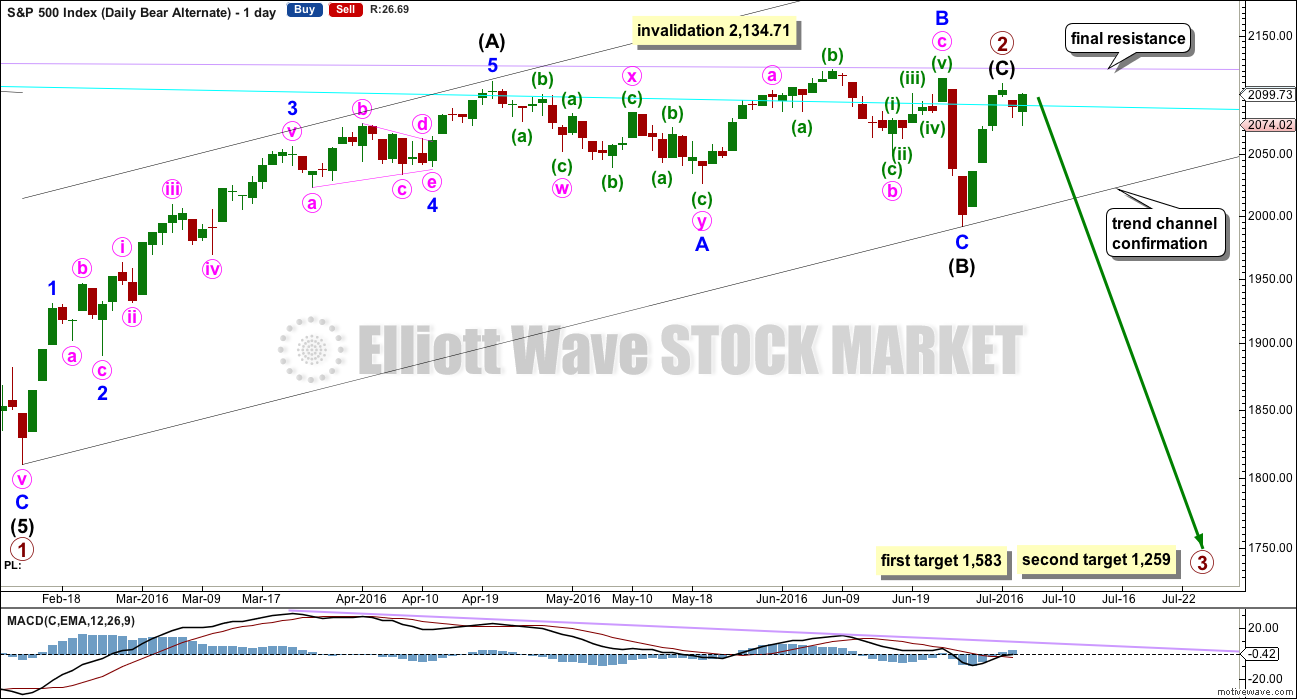
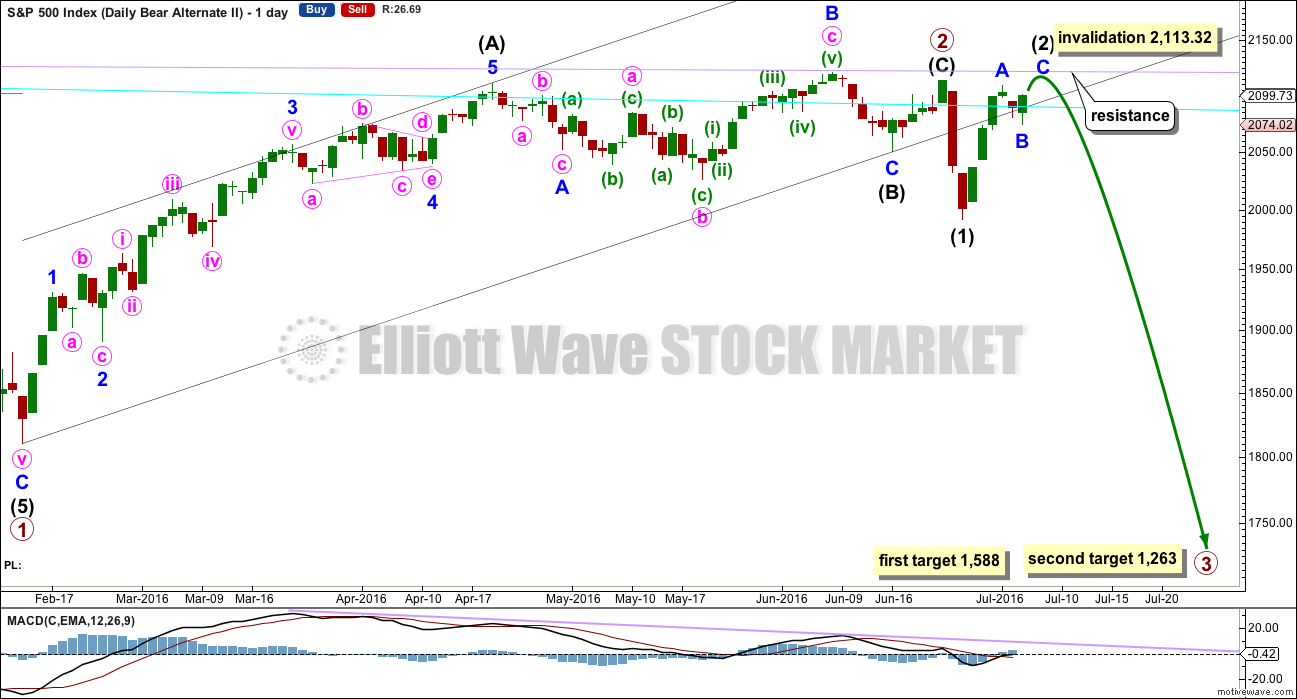
Primary wave 2 may be a complete zigzag, but intermediate wave (C) would be truncated by 2.34 points. This is possible right before a strong third wave down, but the truncation does reduce the probability of this wave count. Intermediate wave (C) for this wave count should be over.
Intermediate wave (B) may have been over at the last low as a regular flat correction. Minor wave B within it is a 1.02 length of minor wave A, shorter than the 1.05 requirement for an expanded flat but longer than the minimum requirement of 0.9. There is no Fibonacci ratio between minor waves A and C; minor wave C is shorter than 1.618 the length of minor wave A and was not truncated.
This wave count still has better proportions than the other two wave counts. Intermediate wave (C) may be over in a few days. This is more acceptable for a C wave within a zigzag than it would be for a second wave within a new trend. Overall, primary wave 2 would have lasted months as a primary degree wave should. This proportion looks about right.
The cyan line has been overshot a few times. It continues to provide some resistance and then support after price breaks above it. The lilac line has been tested only twice, last time at the high of 8th of June. If price comes up to it again, then it should be expected to offer very strong resistance, and that should be where upwards movement ends if a bear market is intact.
At 1,583 primary wave 3 would reach 1.618 the length of primary wave 1. At 1,259 primary wave 3 would reach 2.618 the length of primary wave 1. The lower target should have a higher probability because primary wave 2 was very deep.
SECOND ALTERNATE DAILY CHART
Click chart to enlarge.
Primary wave 2 may have ended on 23rd of June. Primary wave 3 may have begun there.
Within primary wave 3, intermediate wave (1) may be complete. The labelling today within intermediate wave (2) is changed to look at the possibility that it may not be complete. It may move higher tomorrow, so that it has a clearer three wave look to it on the daily chart.
This wave count does not look right with the channel about primary wave 2. If that channel is correctly drawn, then intermediate wave (2) would most likely have ended when price came up to touch the lower edge for a typical throwback after a breach.
At 1,588 primary wave 3 would reach 1.618 the length of primary wave 1. At 1,263 primary wave 3 would reach 2.618 the length of primary wave 1. The lower target is more likely because primary wave 2 was very deep.
Intermediate wave (2) may not move beyond the start of intermediate wave (1) above 2,113.32.
BULL ELLIOTT WAVE COUNT
WEEKLY CHART
Click chart to enlarge.
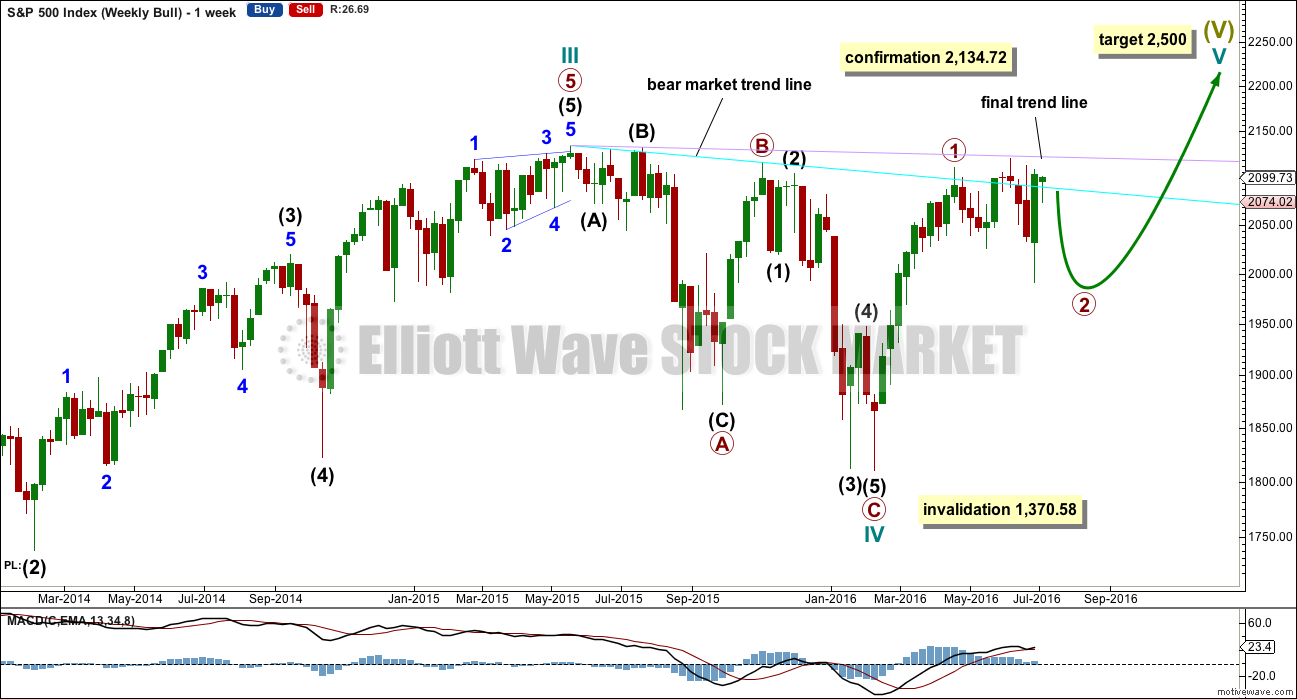
Cycle wave IV is seen as a complete flat correction. Within cycle wave IV, primary wave C is still seen as a five wave impulse.
Intermediate wave (3) has a strong three wave look to it on the weekly and daily charts. For the S&P, a large wave like this one at intermediate degree should look like an impulse at higher time frames. The three wave look substantially reduces the probability of this wave count. Subdivisions have been checked on the hourly chart, which will fit.
Cycle wave II was a shallow 0.41 zigzag lasting three months. Cycle wave IV may be a complete shallow 0.19 regular flat correction, exhibiting some alternation with cycle wave II and lasting nine months. Cycle wave IV would be grossly disproportionate to cycle wave II, and would have to move substantially out of a trend channel on the monthly chart, for it to continue further sideways as a double flat, triangle or combination. For this reason, although it is possible, it looks less likely that cycle wave IV would continue further. It should be over at the low as labelled.
At 2,500 cycle wave V would reach equality in length with cycle wave I.
Price has now broken a little above the bear market trend line. This line is drawn from the all time high at 2,134.72 to the swing high labelled primary wave B at 2,116.48 on November 2015. This line is drawn using the approach outlined by Magee in the classic “Technical Analysis of Stock Trends”. To use it correctly we should assume that a bear market remains intact until this line is breached by a close of 3% or more of market value. Now that the line is breached, the price point at which it is breached is calculated about 2,093.58. 3% of market value above this line would be 2,156.38, which would be above the all time high and the confirmation point.
This wave count requires price confirmation with a new all time high above 2,134.72.
While price has not made a new high, while it remains below the final trend line (lilac) and while technical indicators point to weakness in upwards movement, this very bullish wave count comes with a strong caveat. I still do not have confidence in it. It is produced as an alternate, because all possibilities must be considered. Price managed to keep making new highs for years on light and declining volume, so it is possible that this pattern may continue to new all time highs for cycle wave V.
The invalidation point will remain on the weekly chart at 1,370.58. Cycle wave IV may not move into cycle wave I price territory.
This invalidation point allows for the possibility that cycle wave IV may not be complete and may continue sideways for another one to two years as a double flat or double combination. Because both double flats and double combinations are both sideways movements, a new low substantially below the end of primary wave C at 1,810.10 should see this wave count discarded on the basis of a very low probability long before price makes a new low below 1,370.58.
DAILY CHART
Click chart to enlarge.
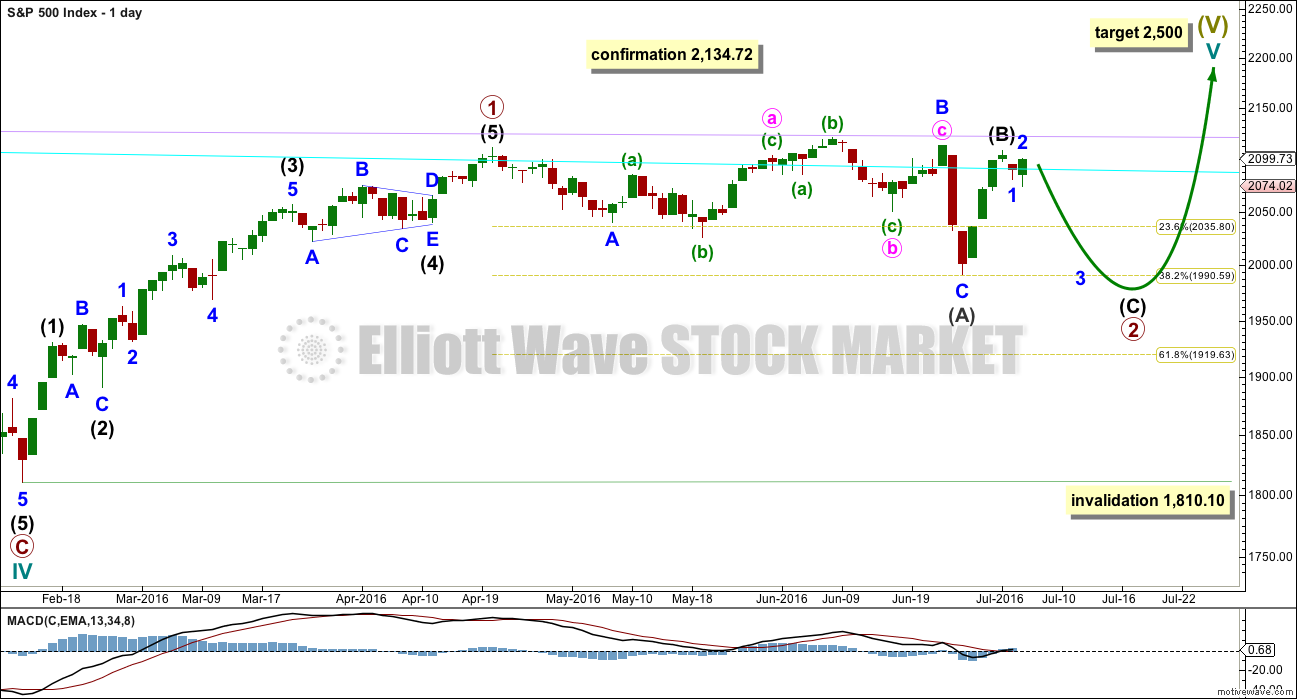
While primary wave 2 may be a complete regular flat correction over at the low of intermediate wave (A), with continuing weakness to upwards movement and price remaining range bound, it looks like for a bull wave count primary wave 2 may not be over.
Primary wave 2 may be continuing sideways as a longer lasting flat, with intermediate wave (A) a complete three and now intermediate wave (B) also a complete three. Intermediate wave (C) may end slightly below the end of intermediate wave (A) at 1,991.68 to avoid a truncation.
Intermediate wave (B) may also be relabelled to be incomplete. If price makes a new high above 2,108.71, then intermediate wave (B) would be relabelled to end higher, and it would then have a clearer three wave look to it on the daily chart.
Primary wave 2 may not move beyond the start of primary wave 1 at 1,810.10.
TECHNICAL ANALYSIS
DAILY CHART
Click chart to enlarge. Chart courtesy of StockCharts.com.
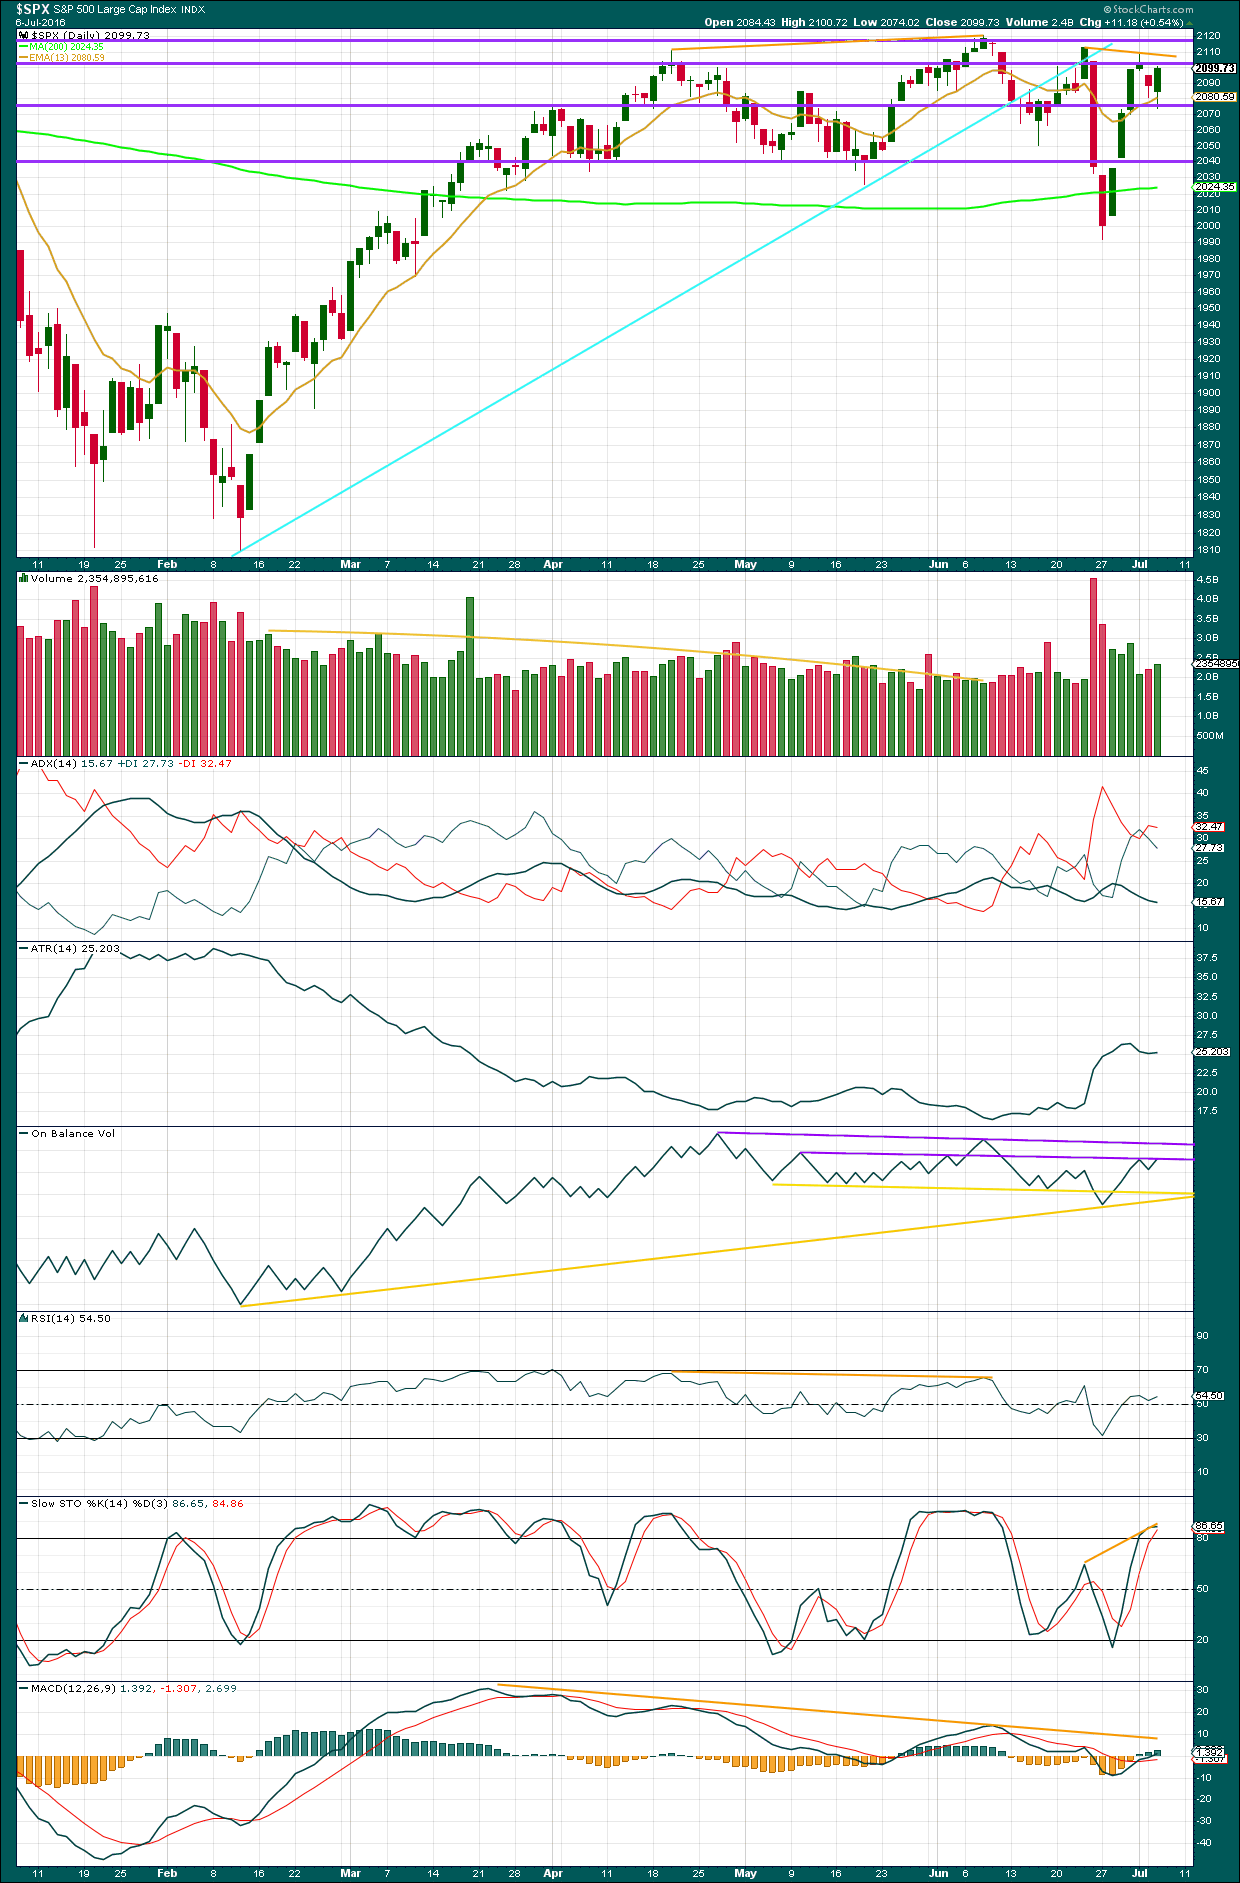
There was support today from volume for the rise in price. Volume today is higher than the prior downwards day. This is a strong warning that price is likely to continue higher tomorrow, and this fits with the second alternate daily Elliott wave count and not the main daily Elliott wave count.
Wednesday’s session completes a relatively strong green daily candlestick with a long lower wick. The bulls were in charge for the whole session to push price higher.
ADX is still declining indicating the market is consolidating. Price is range bound between about 2,120 above and 2,040 below. During this range bound movement, which began back in the end of March, it is three downwards days of 29th of April, 24th of June, and 27th of June which have strongest volume. This suggests a downwards breakout is more likely than an upwards breakout.
ATR is overall flat, mostly in agreement at this time with ADX. The market is consolidating.
On Balance Volume is interesting today. It has come up to find resistance at the first purple trend line again. This line is shallow and repeatedly tested, but it has been broken once before only for OBV to then return below it, so the strength was weakened. This line may provide some resistance and stop price rising any further. If it is breached, then the next purple line quite close by should provide stronger resistance.
RSI is neutral. There is plenty of room for price to rise or fall. Price and RSI showed bearish divergence at the last major high at 2,120 on 8th of June. Price has made lower lows and lower highs since that high. That bearish divergence was followed by reasonable downwards movement.
Stochastics shows some divergence today with price still. Between the two highs from 23rd June to 1st July, price has made a lower high while Stochastics has made a higher high. This is hidden bearish divergence and indicates weakness in price.
MACD also exhibits divergence with price at the two highs on 20th of April and 8th of June. MACD failed to make corresponding highs as price made new highs, indicating weakness to upwards movement. MACD may be held down by this trend line extended outwards.
VOLATILITY – INVERTED VIX MONTHLY CHART
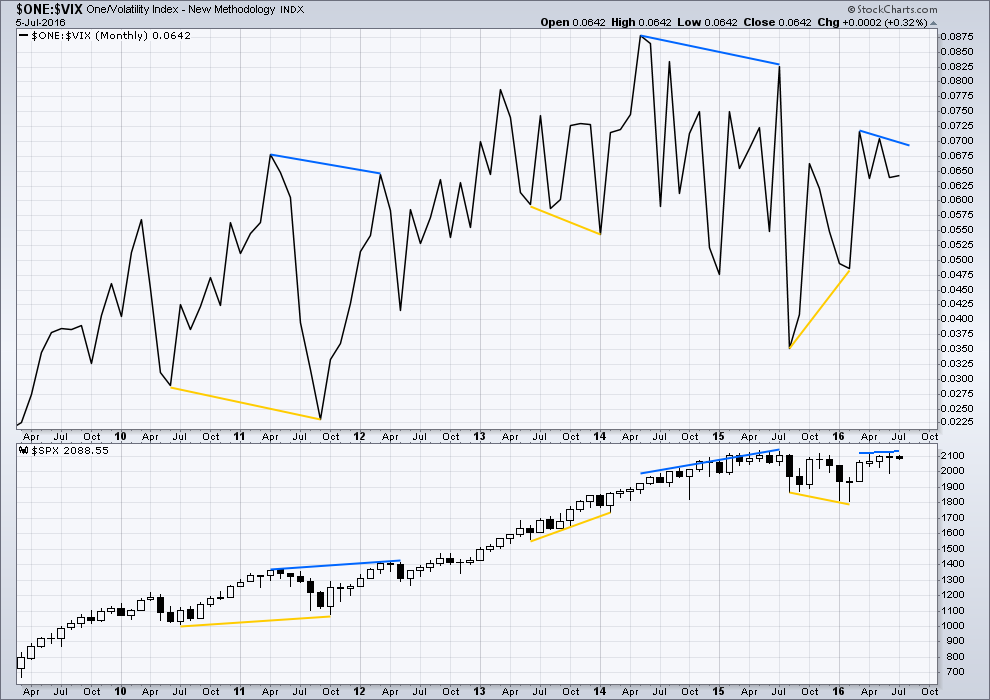
Click chart to enlarge. Chart courtesy of StockCharts.com.
Several instances of large divergence between price and VIX (inverted) are noted here. Blue is bearish divergence and yellow is bullish divergence (rather than red and green, for our colour blind members).
Volatility declines as inverted VIX rises, which is normal for a bull market. Volatility increases as inverted VIX declines, which is normal for a bear market. Each time there is strong multi month divergence between price and VIX, it was followed by a strong movement from price: bearish divergence was followed by a fall in price and bullish divergence was followed by a rise in price.
There is still current multi month divergence between price and VIX: from the high in April 2016 price has made new highs but VIX has failed so far to follow with new highs. This regular bearish divergence still indicates weakness in price.
VOLATILITY – INVERTED VIX DAILY CHART
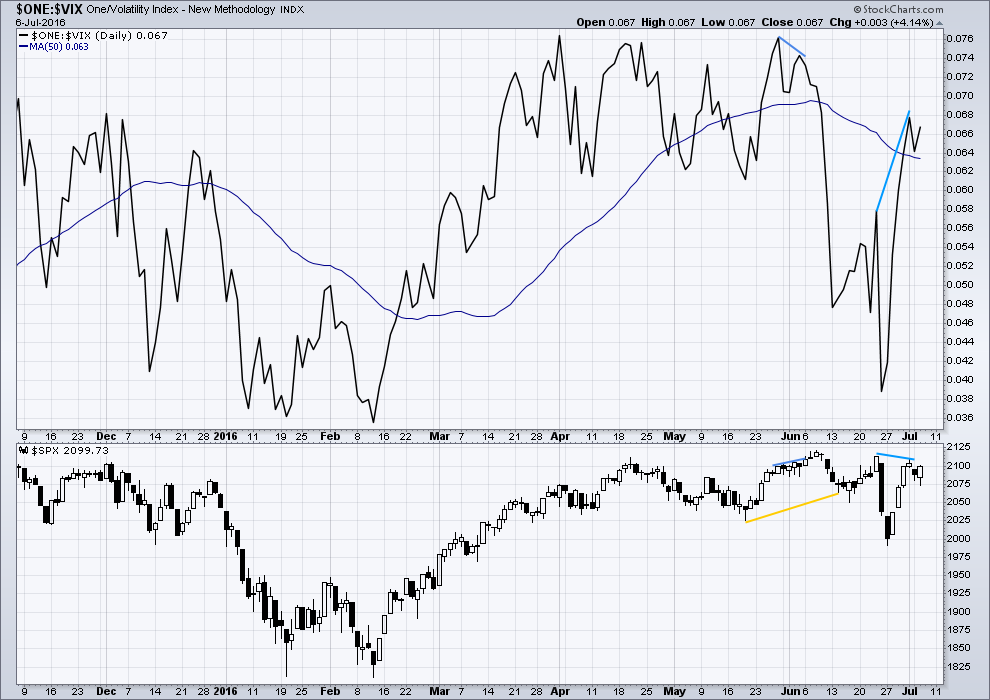
Click chart to enlarge. Chart courtesy of StockCharts.com.
VIX from StockCharts is inverted. As price moves higher, inverted VIX should also move higher indicating a decline in volatility which is normal as price moves higher. As price moves lower, inverted VIX should also move lower indicating an increase in volatility which is normal with falling price.
As price moved higher last week for four days in a row, inverted VIX moved strongly higher. Volatility declined last week to a point which was lower than at the last swing high on 23rd of June. This is hidden bearish divergence and indicates weakness in price.
I would give a lot of weight to price and VIX. It is usually a reliable guide to an impending trend change. So far, following this strong divergence between price and VIX, price has barely fallen. More downwards movement should be expected to follow this divergence.
BREADTH – ADVANCE DECLINE LINE
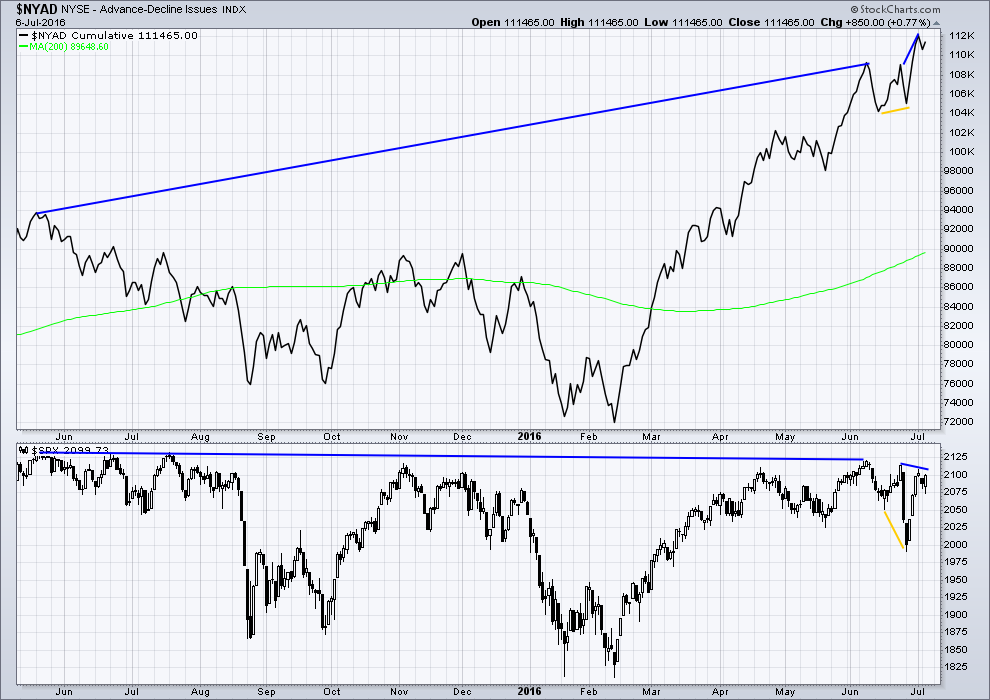
Click chart to enlarge. Chart courtesy of StockCharts.com.
With the AD line increasing, this indicates the number of advancing stocks exceeds the number of declining stocks. This indicates that there is breadth to prior upwards movement.
Taking a look at the bigger picture, the AD line is making substantial new highs but price so far has not. While market breadth is increasing beyond the point it was at in May 2015, this has not translated (yet) into a corresponding rise in price. Price is weak. This is hidden bearish divergence (long blue lines).
There is divergence between price and the AD line indicated by short yellow lines. Price made new lows but the AD line failed to make corresponding new lows. This indicates some weakness to downwards movement from price. Upwards movement over four days may be enough to resolve this bullish divergence.
The AD line has now made a new high above its prior high of 23rd of June yet price has not made a corresponding new high (short blue lines). This divergence now is bearish. It indicates that price is weak.
DOW THEORY
The last major lows within the bull market are noted below. Both the industrials and transportation indicies have closed below these price points on a daily closing basis; original Dow Theory has confirmed a bear market. By adding in the S&P500 and Nasdaq a modified Dow Theory has not confirmed a new bear market.
Within the new bear market, major highs are noted. For original Dow Theory to confirm the end of the current bear market and the start of a new bull market, the transportation index needs to confirm. It has not done so yet.
Major lows within the prior bull market:
DJIA: 15,855.12 (15th October, 2014) – closed below on 25th August, 2015.
DJT: 7,700.49 (12th October, 2014) – closed below on 24th August, 2015.
S&P500: 1,821.61 (15th October, 2014) – has not closed below this point yet.
Nasdaq: 4,117.84 (15th October, 2014) – has not closed below this point yet.
Major highs within the new bear market:
DJIA: 17,977.85 (4th November, 2015) – closed above on 18th April, 2016.
DJT: 8,358.20 (20th November, 2015) – has not closed above this point yet.
S&P500: 2,116.48 (3rd Nobember, 2015) – has now closed above this point on 8th June, 2016.
Nasdaq: 5,176.77 (2nd December, 2015) – has not closed above this point yet.
It is a reasonable conclusion that the indices are currently in a bear market. The trend remains the same until proven otherwise. Dow Theory is one of the oldest and simplest of all technical analysis methods. It is often accused of being late because it requires huge price movements to confirm a change from bull to bear. In this instance, it is interesting that so many analysts remain bullish while Dow Theory has confirmed a bear market. It is my personal opinion that Dow Theory should not be accused of being late as it seems to be ignored when it does not give the conclusion so many analysts want to see.
This analysis is published @ 08:49 p.m. EST.
We need a down open in the morning….
For what it’s worth, I’ve written some VXX puts for tomorrow, 13.50 strike for $0.39. They are clearly in the put holders favor but have not been exercised. I’d like to have the shares…lol…but someone will not put them to me…
You won’t get assigned until Saturday, if they so choose. Occasionally in the money puts will not get assigned but that is the exception. The shares will most likely show up if VXX closes below 13.5 Friday, and that is by no means certain. You may get to pocket the premium and rinse and repeat! 🙂
We still have a series of lower lows and lower highs after that high of 2,120 on 7th June, a month ago now.
This upwards wave now looks strongly like a three wave structure on the daily chart. That’s narrowing down the possibilities.
The main wave count will now see this as minute ii, a zigzag, with a three wave look on the daily chart. Invalidation 2,113.32. Almost no room left to move now, so if that’s the correct count it must be over today.
The first alternate now looks wrong. Intermediate (C) should be a five, not a three. That looks like a three. I’ll probably not publish that idea today.
The second alternate also looks better, now intermediate (2) looks like a three.
Two daily wave counts today, both with invalidation points at 2,113.32.
If 2,113.32 is breached then I would expect a few more days of upwards movement, that first alternate should then see intermediate (C) complete as a five and look like a five.
The market is not really being sold aggressively, but traders are starting to get the sense that something is really amiss. VIX continues to move steadily higher, the trading bots and knee-jerk short sellers keep shorting UVXY. This ought to be quite interesting.
One data feed showed VIX up 0.08 to close at 15.04 another flat at 14.96.
Remaining on the sidelines. Have a great evening all!
currently 14.76
A close in the red unusual for a third wave down. I have not seen that ever happen for a minute two correction. It could be we will get an extended wave but I am inclined to thin we are in at the very least a minor degree wave two….assuming the bear count is unfolding…
So is their a Price Level whereby we can reasonably conclude a strong wave down based on any of the bear counts above is possibly in progress?
i.e. 2091 or 2074.02, etc. etc.
Does anyone have a lower degree count with a price level to answer the above question?
I am not impressed so far. This week’s lows need to be taken out for us to have any real confidence that the banksters have been finally routed. Anything above 2077.5 and I am neutral. Will not get fully short until 2040 decisively taken out.
Thanks Vern, Is that based on a lower degree count you have or based on some other technical metric?
2077.50 is this week’s lows. There have already been several bounces from the 2040 area so it represents strong support.
Correction: SPX low this week actually 2074.02; not sure where I got that 2077.50 number…
1,991.68.
both daily wave counts would see a third wave down unfolding, and for both the rule for the third wave to move beyond the end of the first wave would be met below 1,991.68.
But, the problem with trading a bear market is that the rallies can be deep and sharp. A new low below 1,991.68 doesn’t eliminate the possibility of yet another deep second wave correction.
Thanks Lara… Would that be P3 at 1991.68?
Is there a higher price level that may give a heads up to the possibility at this point in the counts?
No, that would be only minute iii confirmed for the main wave count.
For the second alternate it would be intermediate (3).
A new low below 2,074.02 would confirm that the upwards wave which made a high today was a three and is complete. That would be the highest price confirmation we could get, and it would be reasonably strong.
Great Thank You…
One cannot help but wonder how much CB intervention and manic algorithmic trading it’s going to take to break this market irrevocably. We are probably going to go from propped up, to projectile down.
Waiting for the end of the day algos to kick in and ruin the party. Oil is down today, so at least that helps the bearish cause.
But the vigor from the bears is unconvincing, not even .5% down atm. At least UVXY is showing some life. But half an hour rally from the bulls could wipe out this decline pronto.
Or maybe there will be selling into the close. That would be novel 🙂
The selling has not started yet. The market is top heavy and needing more bankster juice just to maintain par. Not sure why the bears are lurking but they are not really doing much so far as I can determine. There will probably be a big cash dump into the close. Maybe potential sellers are waiting for tomorrow’s job report.
Hopefully the jobs report will be a stinker 🙂
Oil is likely to continue its decline.
David,
The way this market is parked into the close, I will not be a bit surprised if it is not and as a result safety gets clobbered i.e. GOLD.
In fact if the job report is ad they will celebrate as no rate increase for the remainder of the year… The fix is in until masses start to see that the emperor has no clothes…
I suspect next action is to smash gold before it heads into seasonal high demand season in South Asia I.e. China and india
Crude is down. Gold may be hit but it will likely rebound if the sell off arrives. I’d like SPX and Gold to be both at 1575 🙂
(Tim Knight chart)
And the day ends only down .06%
In fact a slightly decent report tomorrow is going to bring money from overseas into US markets. Whether we like this or not US markets appear to the most stable amounts all (agree this is just a appearance from FED). USD is the only game left as other currencies are suffering uncertainties
Yes, there has to be a flood of money coming in for safe positive yield. Between that and the deep pockets of banks and PPT, it makes it hard to get a downturn going.
Clean rejection of the sloping trendline line on the hourly. Bearish divergences on the RSI. Could this be the start of our elusive third wave?
Probably no because it’s been perpetually elusive to this point. I will say that we will know it when we see it and it will be after the fact.
If VIX goes back in the red, I would say a definite no. VIX will tell the tale….
Closing my spread trade for a small loss. Sold for 2.00, bought back for 2.08.
I am neutral short term until 2040 taken out.
Anything other than at least a 20 point SPX decline today and I am using this move down to close short trades. I want to see not only a move down but one with ramping momentum. Lacking that I will be watching the bankster wars from the sidelines thank you very much….no more 2100 pivot perambulating for moi… 🙂
If they are beginning to rattle us, mightn’t this be the time to add to shorts? 😉
The thought did occur to me that I just might be a contrarian indicator! 🙂
Vern,
How long have we had this feeling that this is it? only to find out that it breaks out into a rally taking the shorts down. I am very skeptical and waiting on sidelines. I think we have another push in the making as NASDAQ just doesn’t want to give up… maybe I am not seeing things but it has been a long wait and still counting…
I am very close to moving to the sidelines and taking a bit of a break. Price action once again looks like consolidation which means we are going still higher. It can be frustrating when the expected waves do not unfold or take longer than anticipated. I think you are wise to SOH until things become clearer. I am just about ready to join you on the sidelines as I don’t like what I am seeing so far. I am looking for a turn down again in VIX and I will be going to cash short term as soon as that happens…
IWM is also positive today and that is not good for the immediate bearish case…
Vern,
Bingo on IWM and I think it can run hard if markets start to ramp up. Expecting some indication from GOLD to guide but this market doesn’t want to go away easily. What is worrying to me is every time if drops, bears just don’t take control and let the bulls recover. This has been the theme since Feb drop and not likely to change with looming elections.
If any following the 2min chart with oscillator strategy, I’m going long around 2095.50ish. There is bullish divergence showing (only on a very short scalp trade), more to come too with a last spike down in price to finish the little c down of a iv.
I’m in long now, good fill on e-minis. Just a scalping trade for the day.
VIX heading higher. Quite content to watch what UVXY does into the close. I would be impressed with a close at 10.00 or higher…
A reclaim of SPX 2100 is a no-brainer long trade for more upside….
Hope your stops were tight Peter….
And I got stopped out for a loss – see how easy it is? Ha! 🙂
Trading this market is a nightmare for bull and bear alike. The MMs have developed the whipsaw to a fine art form. I am not executing any trades until we are at support or resistance. Not worth the headache! 🙂
A green close after a new 52 week low in UVXY would in my mind eliminate any likelihood of our being in an impulsive wave to the upside FWIW…
The banksters are not going to give up this pivot with a fight- they are going to have to be dragged kicking and screaming bloody murder away from this round number pivot. If the bears cannot do it today that is a big problem…I really and truly do not like this kind of hesitation around the pivot numbers. It is almost always bullish- I have never ever seen it not be bullish….
Here is one way to trade scalps for those who aren’t familiar with it, simply go to a 2min chart (or 1min or 3min) and apply the Awesome Oscillator. Two minute chart shown. I like to use a histogram type indicator myself. Let the oscillator tell you the strength of the waves. The down right now, and shown to the lower right of the screen, is most likely a wave 4 correction because first you have the wave 1 up, then stronger wave 3 up confirmed by the oscillator going higher. Next, and it is only the best probability not for sure, will be a small wave v up….and then look for the oscillator to not go as high as it did at the “3” wave. The one thing you must watch out for is the bigger picture, it could be a corrective C wave up which then you’ll drop down pretty good, versus being a 3 going higher on a solid basis: then you’ll get caught with a loss when the larger degree takes over….use a stop loss. Try adding in other indicators to boost the accuracy. Look for divergences.
SO is their a Price Level whereby we can reasonably conclude a strong wave down based on any of the bear counts above is possibly in progress?
i.e. 2091 or 2074.02, etc. etc.
Below 2099.73 makes this gap open this morning an exhaustion gap…
The banksters should show up any minute….
A surrender of the 2100 pivot and my faith is restored….
FWIW, I only see 3 waves up from yesterday’s lows….at least so far.
and now 5 down off the highs of today…hmmm.
Unfortunately that has meant absolutely nada of late. Too many times I have seen what looked like impulse declines get completely retraced. I think the key is 2100. We absolutely must fall impulsively AWAY from that pivot for me to be convinced the down-trend has resumed.
covered shorts, nice scalp; will short for another scalp at next high around 2112ish.
Also disclosing I’m sitting on about 4,200 put options, for my longer time trade as a devot Bear. Wide mix, strikes at Jul 22, 29 and Aug 5. Otherwise in and out each day for little scalps using e-minis.
Nice and Nimble! 🙂
Nice trade. You have to be quick in this market.
So you are short 420,000 shares per your options position ?
Only if they they are in the money…. 🙂
I got tired of the banksters and moved my puts to 2017 leaps. I cannot believe we are this close to all time highs after sitting on those puts for almost a year…!
Ditto, I feel all the TA is fine and good work but it is the other influences that we (retail) investors have no control over that will determine when the markets turn and who will benefit from it. Tough to outsmart Mr. Market or Banksters …
New low in UVXY at 8.15…sideways movement looks to me like consolidation. A break of 8.00 in UVXY and I am closing spread and not waiting for a close under 8.50. At some point you have to admit you were incorrect on a trade and volatility is not looking good for the immediate bearish case imo…
Another UVXY low at 8.22; it continues with VIX to head South and showing some divergence with market price action; we really should see a turn quite soon if this is a topping second wave….
Of course another possibility is that minute two continuing higher. Invalidation at 2113.32….
New 52 week low in UVXY at 8.25 suggests a a higher degree correction…
Main hourly wave count invalidated with movement above 2108.42.
Our original assessment that it was too deep to be a minuette degree correction was right.
Second alternate looks likely and should bring new 52 week low in UVXY…
going short some eminis here
I can’t do it, be careful Peter.
I’m done fighting the tape and went long on the ES this am at 2092.75. Got one eye open for the exits…just in case.
Retake of SPX 2100 a very cautionary tale. If not surrendered today I am out of short trades as I think it means we go higher…
A close of UVXY under 8.50 means a busted spread trade..
my trade is only a little scalp, will post that in the future so it is clearer, I’ll cover here soon in this little 4 down. Then short again up around the 2112 area. Noting I’m in and out of markets all day long….
Peter thanks for posting & disclosing the time of your trade entry.
Interesting how USDJPY keeps going lower. That is supposed to be bearish and forces unwinding of carry trades…
Looking for SPHB to either break above the 20-day average to the upside $29.50 or below $28.00 on the downside to help figure things out…
BEAR STEARNS, THE SEQUEL: Property fund suspensions are on the cusp of triggering the next financial crisis
Seven investment firms suspended trading in their property funds this week, freezing £15 billion ($19.4 billion) of assets since Monday, out of a total of £24 billion sunk into UK open-end real estate funds.
The credit crisis of 2007 began with the freezing of two property funds at Bear Stearns, for instance.
http://www.businessinsider.com/guide-why-uk-property-fund-suspensions-trigger-financial-crisis-risks-analysis-2016-7?&platform=bi-androidapp
Hi Lara, yes this is so frustrating. Who keeps buying this market? And if it the central banks is it legal?
I had a short on S&P opened on 3rd July at 2,103. Stop was moved to just below breakeven. Now stopped out after hours.
Trying to trade this bear with its deep corrections is exhausting work!
I think I’ll leave this for one day or so, and see what happens tomorrow.
Happy with trades on Gold and EURUSD right now.
🙂
Boo Hoo…
2 🙂
2 Remi Martins in starting 3rd.