
Overall, the session unfolded mostly as expected with downwards movement first then upwards movement.
A green daily candlestick was expected to continue a bounce.
Summary: A multi day correction has most likely begun to a target at 2,094 or 2,099 -2,102. If this unfolds as expected, it should offer a good low risk high reward opportunity to join the downwards trend. A new high above 2,085.65 would confirm this view short term. Risk and the invalidation point remain at 2,120.55. Alternatively, a new low tomorrow below 2,050.37 would indicate a surprise to the downside may be underway, with a target at 1,994.
Trading advice (not intended for more experienced members): Short positions entered above 2,100 should at least have stops moved to break even if not a little below. Position traders holding short positions opened reasonably above 2,100 may like to hold onto those; 2,100 should offer strong resistance now for any bounce.
Looking at the bigger picture, any short positions entered here should be profitable within a week and may still offer a very good risk / reward set up. However, any members entering short here must understand there is a risk the position may be underwater for several days before becoming profitable. With that in mind, it is essential to manage risk: no more than 2-3% of equity should be risked if entering short here.
Choosing to be patient and wait may offer a better entry but runs the risk of missing a strong downwards movement. On balance, it is still my judgement that price will continue up for a reaction to test the trend line, so I will still not be adding to my short position for another two or so days. If I did not yet have a short position, I may choose to enter a small position here and wait to enter another slightly larger position higher up.
Stops (and risk) for new positions must be just above 2,120.55
Last published monthly charts are here.
New updates to this analysis are in bold.
BEAR ELLIOTT WAVE COUNT
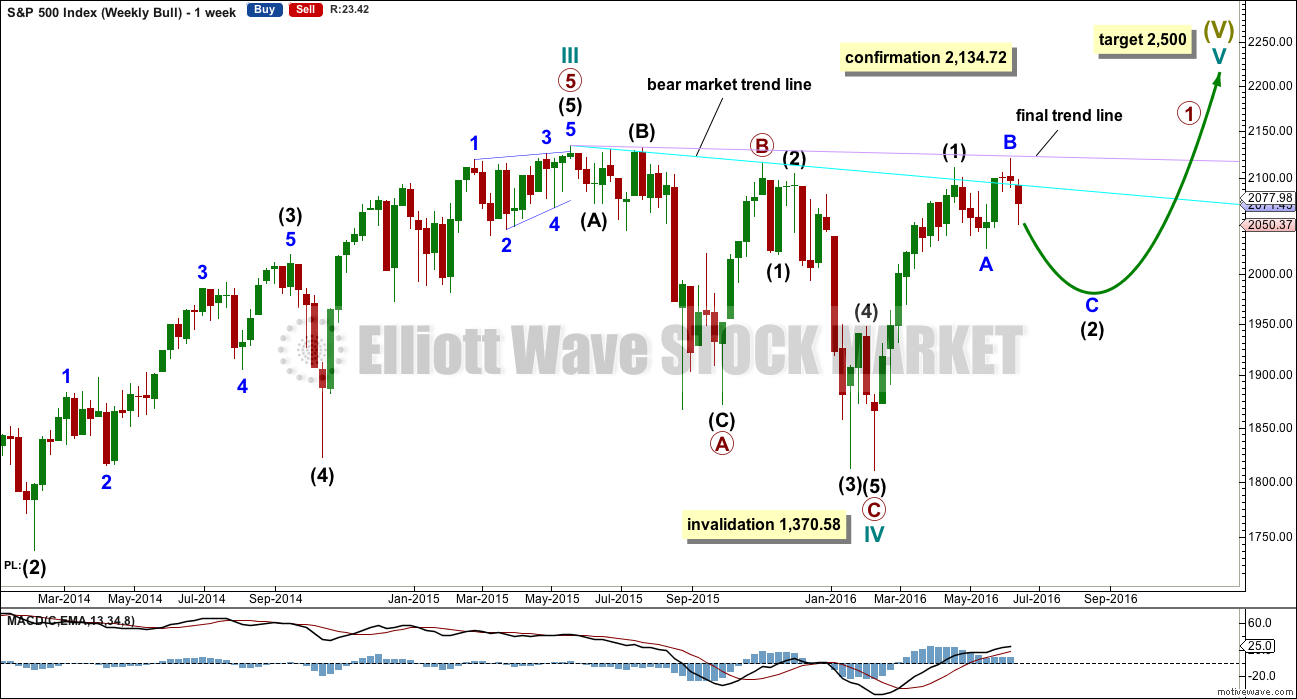
WEEKLY CHART
Click chart to enlarge.
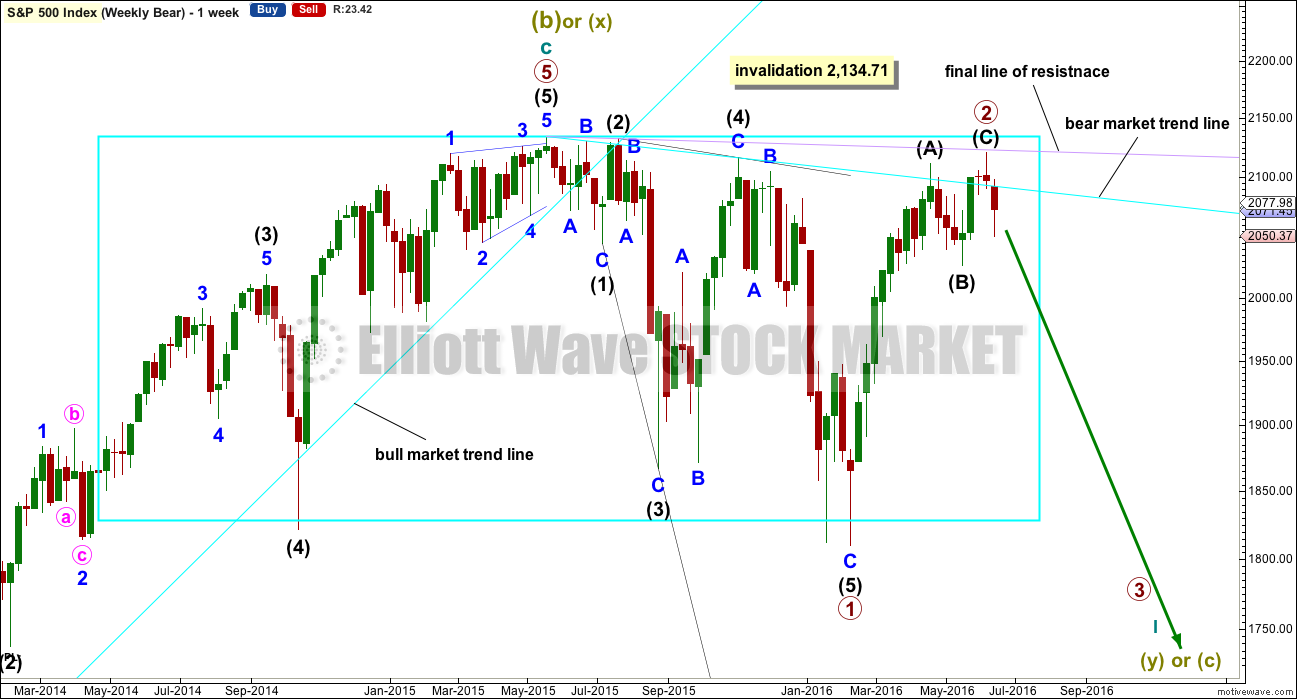
The box is added to the weekly chart. Price has been range bound for months. A breakout will eventually happen. The S&P often forms slow rounding tops, and this looks like what is happening here at a monthly / weekly time frame.
Primary wave 1 is seen as complete as a leading expanding diagonal. Primary wave 2 would be expected to be complete here or very soon indeed.
Leading diagonals are not rare, but they are not very common either. Leading diagonals are more often contracting than expanding. This wave count does not rely on a rare structure, but leading expanding diagonals are not common structures either.
Leading diagonals require sub waves 2 and 4 to be zigzags. Sub waves 1, 3 and 5 are most commonly zigzags but sometimes may appear to be impulses. In this case all subdivisions fit perfectly as zigzags and look like threes on the weekly and daily charts. There are no truncations and no rare structures in this wave count.
The fourth wave must overlap first wave price territory within a diagonal. It may not move beyond the end of the second wave.
Leading diagonals in first wave positions are often followed by very deep second wave corrections. Primary wave 2 would be the most common structure for a second wave, a zigzag, and fits the description of very deep. It may not move beyond the start of primary wave 1 above 2,134.72.
So far it looks like price is finding resistance at the lilac trend line. Price has not managed to break above it.
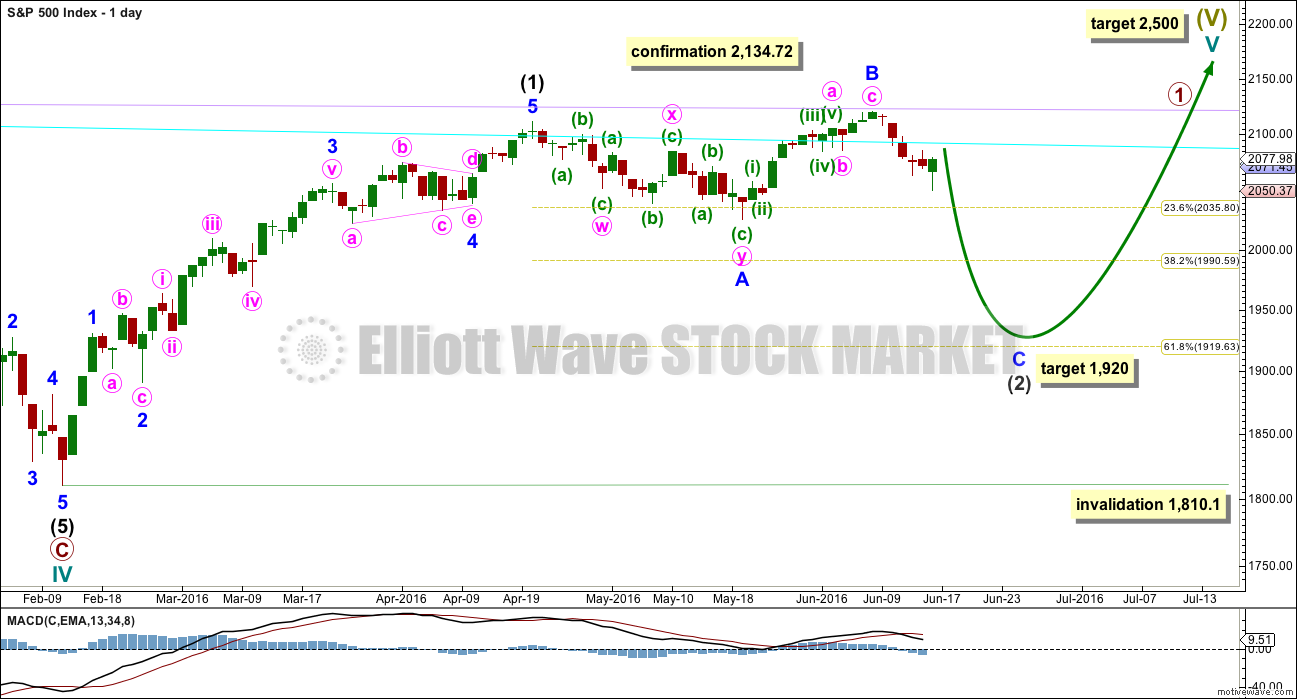
DAILY CHART
Click chart to enlarge.
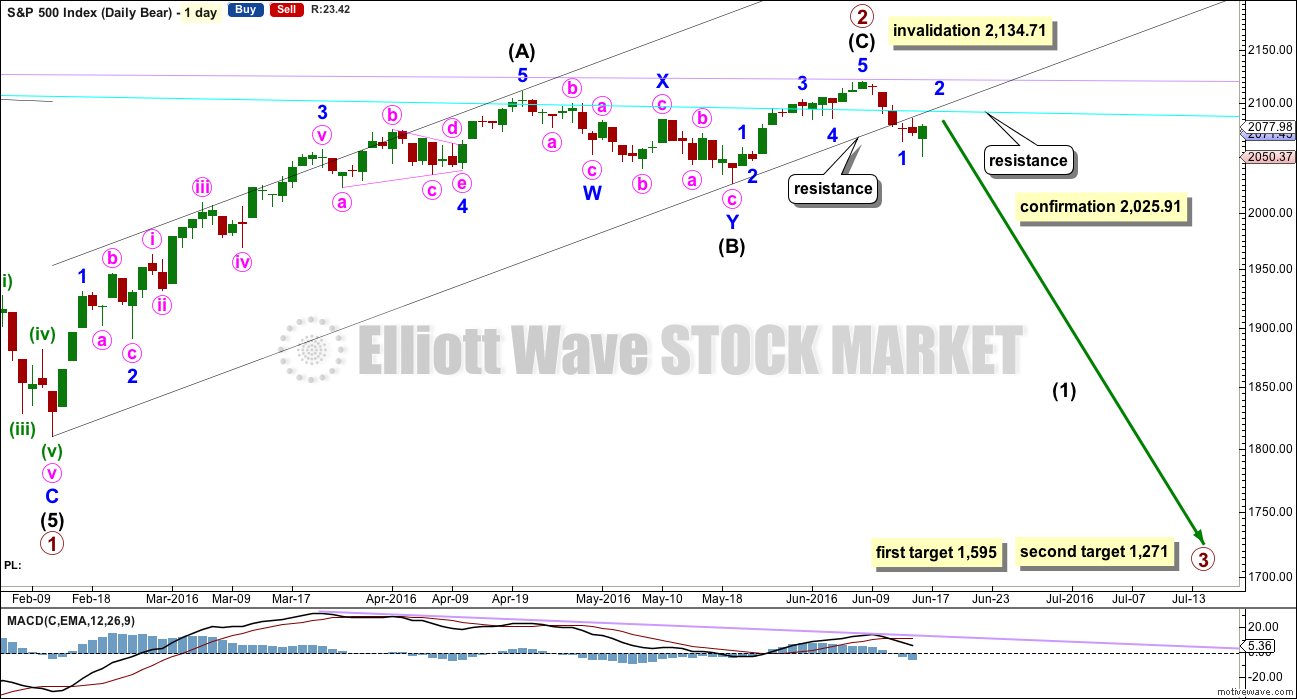
Primary wave 2 would be a 0.96 correction of primary wave 1. Second wave corrections following first wave leading diagonals are commonly very deep, so this fits the most common pattern if primary wave 1 was a leading diagonal.
The most common structure for a second wave correction is a zigzag.
There is no Fibonacci ratio between intermediate waves (A) and (C).
Draw a channel about primary wave 2 using Elliott’s technique for a correction: draw the first trend line from the start of the zigzag, then a parallel copy on the end of intermediate wave (A).
Intermediate wave (C) is a complete impulse and primary wave 2 is a complete zigzag. With a full daily candlestick below the wide black channel and not touching the lower edge, there is some confidence that primary wave 2 is over.
At this stage, within intermediate wave (1) down, minor wave 1 is complete. Minor wave 2 should be expected to last a few days and come up to test the lower edge of the black channel at least once and quite likely more than once. This would be most typical behaviour. This is one reason why the main and second alternate hourly wave counts are judged to be most likely today.
So far minor wave 2 may have lasted one or two days. It may be expected to continue for another one to three days.
Intermediate wave (C) lasted a Fibonacci thirteen days. Intermediate wave (B) lasted a Fibonacci twenty-one days and intermediate wave (A) lasted forty seven days (not a Fibonacci number). Primary wave 2 would have lasted eighty one days (also not a Fibonacci number). If primary wave 3 exhibits a Fibonacci duration, then a reasonable estimate would be a Fibonacci 144 days.
A new low below 2,025.91 would provide final price confirmation of a trend change. At that stage, downwards movement could not be a second wave correction within intermediate wave (C) and so intermediate wave (C) would have to be over.
The targets calculated are provisional only. They come with the caveat that price may yet move higher which means the targets would move correspondingly higher. They also come with the caveat that at this very early stage a target for primary wave 3 may only be calculated at primary degree. When intermediate waves (1) through to (4) within primary wave 3 are complete, then the targets may change as they can be calculated at more than one wave degree. Primary wave 3 may not exhibit a Fibonacci ratio to primary wave 1.
The first target at 1,595 is where primary wave 3 would reach 1.618 the length of primary wave 1. This target would most likely not be low enough because primary wave 2 is very deep at 0.96 the length of primary wave 1. Primary wave 3 must move below the end of primary wave 1, and it must move far enough below to allow subsequent room for primary wave 4 to unfold and remain below primary wave 1 price territory. Normally, there is a gap between first wave and fourth wave price territory, particularly in a bear market.
The next target may be more likely. At 1,271 primary wave 3 would reach 2.618 the length of primary wave 1.
If primary wave 3 does not exhibit a Fibonacci ratio to primary wave 1, then neither of these targets would be correct.
Well before these targets, it should be obvious if the next wave down is a primary degree third wave. It should exhibit increasing ATR, strong momentum, and a steep slope. However, please note that although it may begin very strongly it does not have to. It may also be that intermediate wave (1) maintains an ATR about 20 – 30 and has some deep time consuming corrections within it. That was how the last primary degree third wave began within the last bear market, so it may happen again.
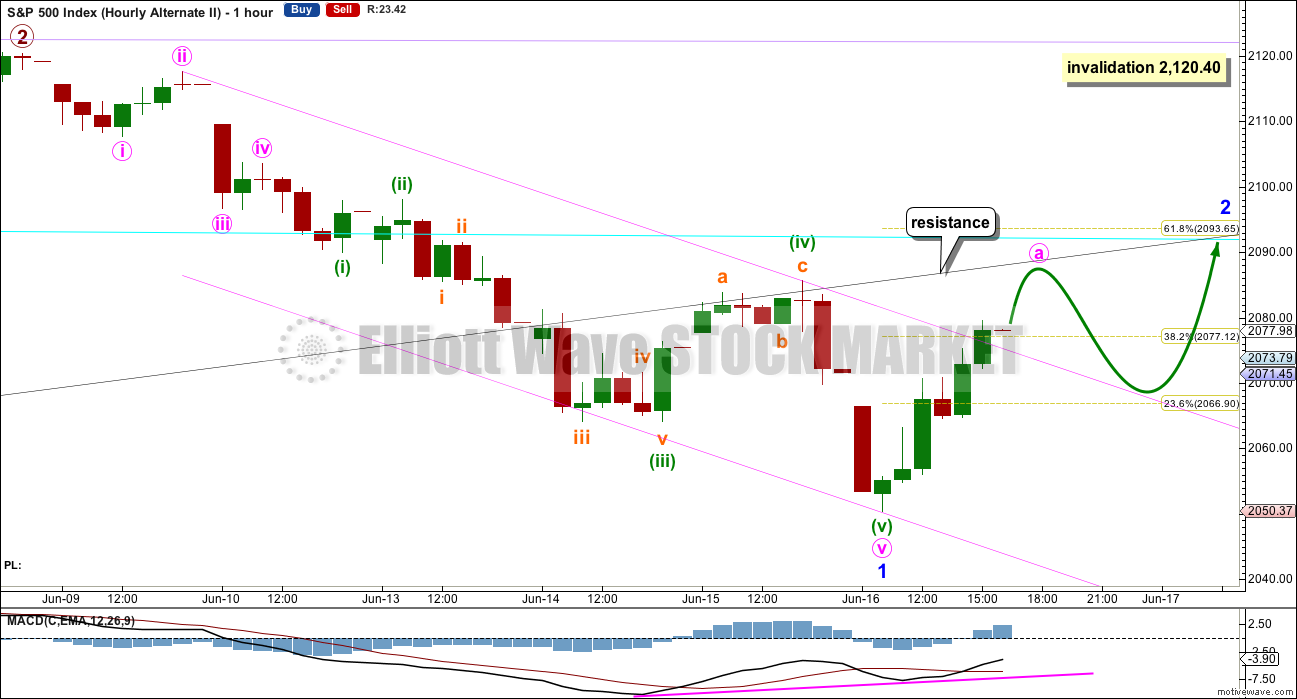
MAIN HOURLY CHART
Click chart to enlarge.
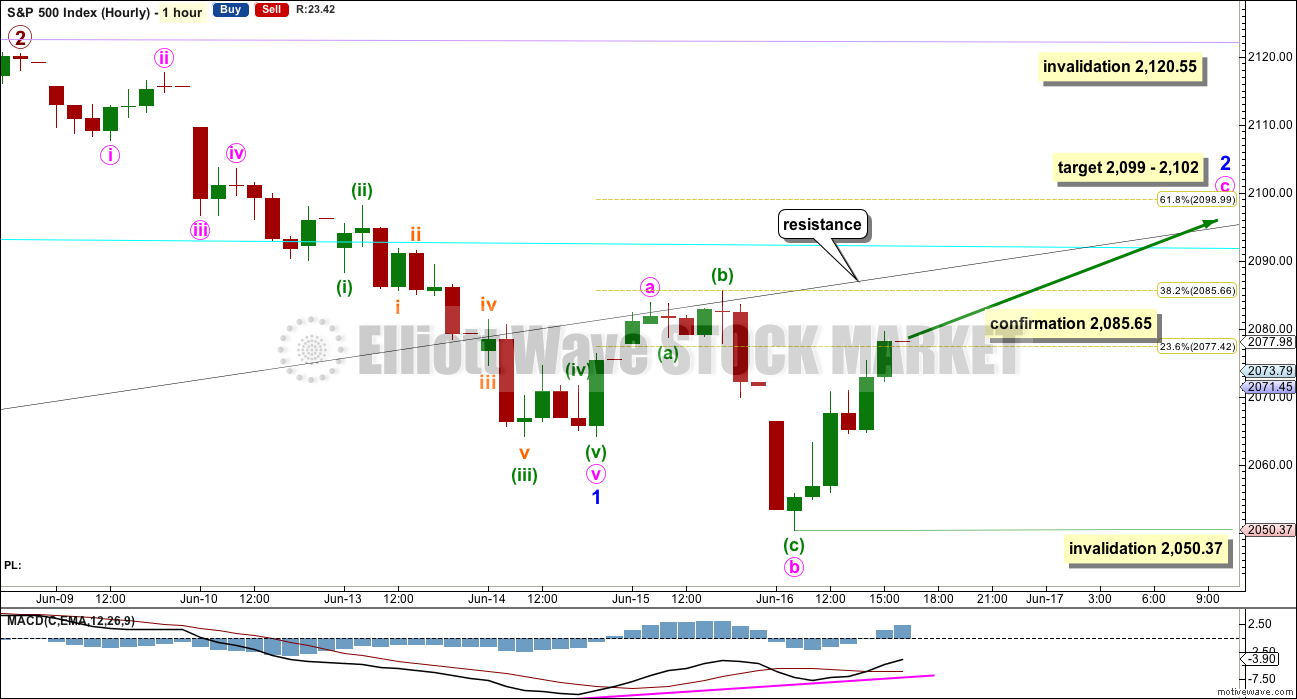
It is my judgement today that this main wave count has about an even probability with the second alternate, based on the overall look and Fibonacci ratios.
Minor wave 2 may be unfolding as an expanded flat correction. Divergence between price and MACD at the hourly chart level supports this wave count, but it is not supported at lower time frames.
Minor wave 2 may also be unfolding as a combination but at this stage that structure looks less likely, so for clarity’s sake it will not be charted.
Ratios within minor wave 1 are: minute wave iii is just 0.24 points longer than 1.618 the length of minute wave i, and minute wave v has no Fibonacci ratio to either of minute waves i or iii.
Ratios within minute wave v are: there is no Fibonacci ratio between minuette waves (i) and (iii), and minuette wave (v) is just 0.06 short of 0.382 the length of minuette wave (i) (ratios here calculated on the five minute chart).
With reasonable Fibonacci ratios for this labelling, it has a reasonable probability.
Within minor wave 2, minute wave b would be a 1.69 length of minute wave a. This is longer than the common length but within allowable limits.
At 2,102 minute wave c would reach 2.618 the length of minute wave a. This is close to the 0.618 Fibonacci ratio of minor wave 1 at 2,099 giving a 3 point target zone.
If it lasts long enough, this target may be met when price comes up again to touch the lower edge of the black channel.
A new high above 2,085.65 would invalidate the first alternate below and provide some price confirmation of this main wave count. If that happens, then if price comes up to touch the black trend line, whether or not the target is met, then enter short there. Stops and risk must be at 2,120.55. Invest no more than 3-5% of equity on any one trade and always use a stop loss.
Within minute wave c, no second wave correction may move beyond the start of its first wave below 2,050.37. Invalidation of this main wave count would confirm the alternates below.
FIRST ALTERNATE HOURLY CHART
Click chart to enlarge.
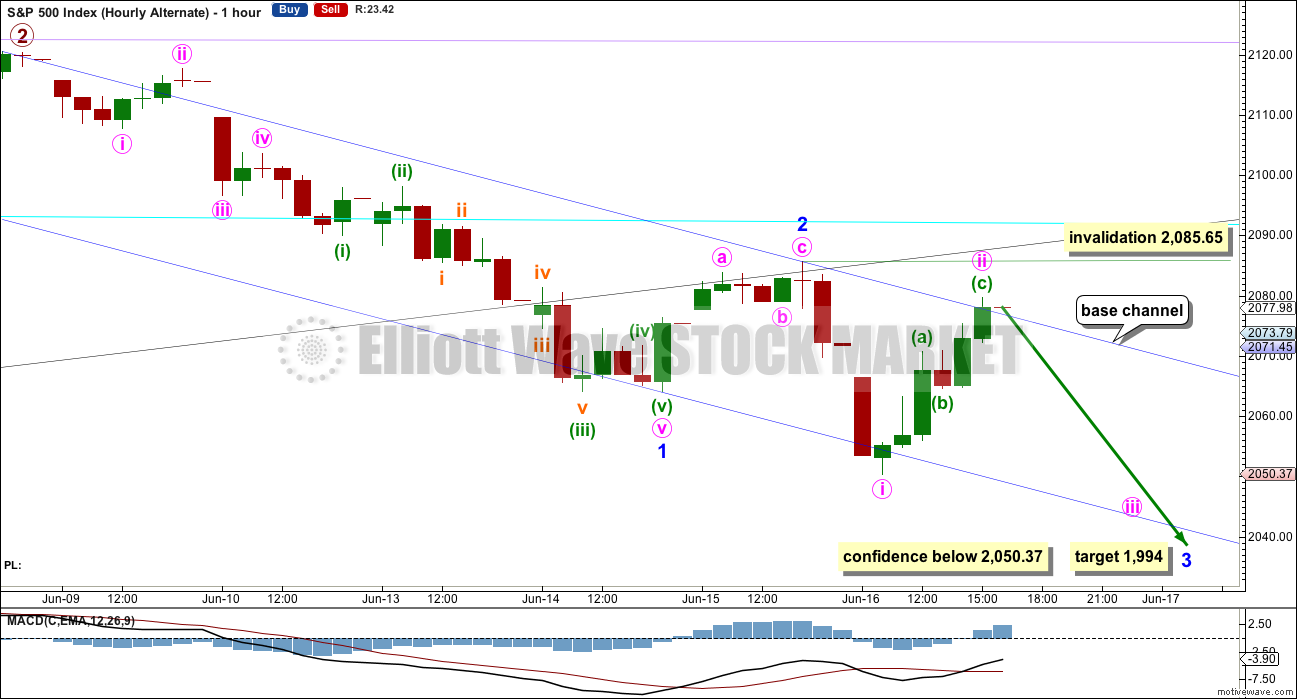
This wave count is identical to the main hourly wave count with the sole exception of the degree of labelling for today’s upwards movement. It is possible but less likely that minor wave 2 is over as a quick shallow 0.382 zigzag.
At any stage, a new high by any amount above 2,085.65 would invalidate this wave count. No second wave correction may move beyond the start of its first wave within minor wave 3.
At 1,994 minor wave 3 would reach 1.618 the length of minor wave 1.
Minor wave 1 lasted four days (not a Fibonacci number) and minor wave 2 may have lasted just one day. Minor wave 3 may be expected to last a Fibonacci eight or thirteen days. It would most likely show its subdivisions on the daily chart, so two small corrections within it for minute waves ii and iv may turn up as doji or green candlesticks with small real bodies.
This wave count is possible but due to the brevity of minor wave 2 it has a low probability. A new low below 2,050.37 would increase the probability of this alternate substantially. However, the second alternate would remain viable, so a new low below 2,050.37 at this stage cannot confirm a third wave down.
SECOND ALTERNATE HOURLY CHART
Click chart to enlarge.
It is possible that minor wave 1 ended at the low for today’s session.
Ratios within minor wave 1 are: minute wave iii is just 0.24 points longer than 1.618 the length of minute wave i, and minute wave v is 1.69 points short of 2.618 the length of minute wave iii.
Ratios within minute wave v are: minuette wave (iii) is 1.72 points short of 2.618 the length of minuette wave (i), and minuette wave (v) is 1.26 points longer than equality in length with minuette wave (iii).
With excellent Fibonacci ratios, this labelling has a good probability. The only problem is the proportion of minuette wave (iv) to minuette wave (ii), but the S&P does not always exhibit good proportions.
At the end of minor wave 1, there is divergence in momentum for the final fifth wave at the hourly chart level. This looks typical.
The most likely structure for minor wave 2 would be a zigzag or zigzag multiple. It may also be a flat correction or a combination which may include a new low below its start at 2,050.27. For this reason, there is no lower invalidation point for this wave count which is the largest most significant difference between this alternate and the main wave count.
This alternate wave count may have about an even probability with the main wave count. It expects overall upwards movement for another one or two days at least to find resistance at the lower edge of the black channel.
The target for minor wave 2 here would be most likely the 0.618 Fibonacci ratio of minor wave 1 at 2,094.
Minor wave 2 may not move beyond the start of minor wave 1 above 2,120.40.
BULL ELLIOTT WAVE COUNT
WEEKLY CHART
Click chart to enlarge.
Cycle wave IV is seen as a complete flat correction. Within cycle wave IV, primary wave C is still seen as a five wave impulse.
Intermediate wave (3) has a strong three wave look to it on the weekly and daily charts. For the S&P, a large wave like this one at intermediate degree should look like an impulse at higher time frames. The three wave look substantially reduces the probability of this wave count. Subdivisions have been checked on the hourly chart, which will fit.
Cycle wave II was a shallow 0.41 zigzag lasting three months. Cycle wave IV may be a complete shallow 0.19 regular flat correction, exhibiting some alternation with cycle wave II and lasting nine months. Cycle wave IV would be grossly disproportionate to cycle wave II, and would have to move substantially out of a trend channel on the monthly chart, for it to continue further sideways as a double flat, triangle or combination. For this reason, although it is possible, it looks less likely that cycle wave IV would continue further. It should be over at the low as labelled.
At 2,500 cycle wave V would reach equality in length with cycle wave I.
Price has now broken a little above the bear market trend line. This line is drawn from the all time high at 2,134.72 to the swing high labelled primary wave B at 2,116.48 on November 2015. This line is drawn using the approach outlined by Magee in the classic “Technical Analysis of Stock Trends”. To use it correctly we should assume that a bear market remains intact until this line is breached by a close of 3% or more of market value. Now that the line is breached, the price point at which it is breached is calculated about 2,093.58. 3% of market value above this line would be 2,156.38, which would be above the all time high and the confirmation point.
This wave count requires price confirmation with a new all time high above 2,134.72.
While price has not made a new high, while it remains below the final trend line (lilac) and while technical indicators point to weakness in upwards movement, this very bullish wave count comes with a strong caveat. I still do not have confidence in it. It is produced as an alternate, because all possibilities must be considered. Price managed to keep making new highs for years on light and declining volume, so it is possible that this pattern may continue to new all time highs for cycle wave V.
The invalidation point will remain on the weekly chart at 1,370.58. Cycle wave IV may not move into cycle wave I price territory.
This invalidation point allows for the possibility that cycle wave IV may not be complete and may continue sideways for another one to two years as a double flat or double combination. Because both double flats and double combinations are both sideways movements, a new low substantially below the end of primary wave C at 1,810.10 should see this wave count discarded on the basis of a very low probability long before price makes a new low below 1,370.58.
DAILY CHART
Click chart to enlarge.
Intermediate wave (2) may still be an incomplete flat correction. Minor wave A will subdivide as a three, a double zigzag, and minor wave B may be seen as a single zigzag.
The most likely point for intermediate wave (2) to end would be the 0.618 Fibonacci ratio at 1,920.
Intermediate wave (2) may not move beyond the start of intermediate wave (1) below 1,810.10.
While it is possible that intermediate wave (2) may be a complete double zigzag at the low labelled minor wave A, this would be a very shallow and rather quick second wave correction. The first reasonable second wave correction within a new bull market should be expected to be deeper and more time consuming for this bull wave count, so intermediate wave (2) is expected to continue.
TECHNICAL ANALYSIS
WEEKLY CHART
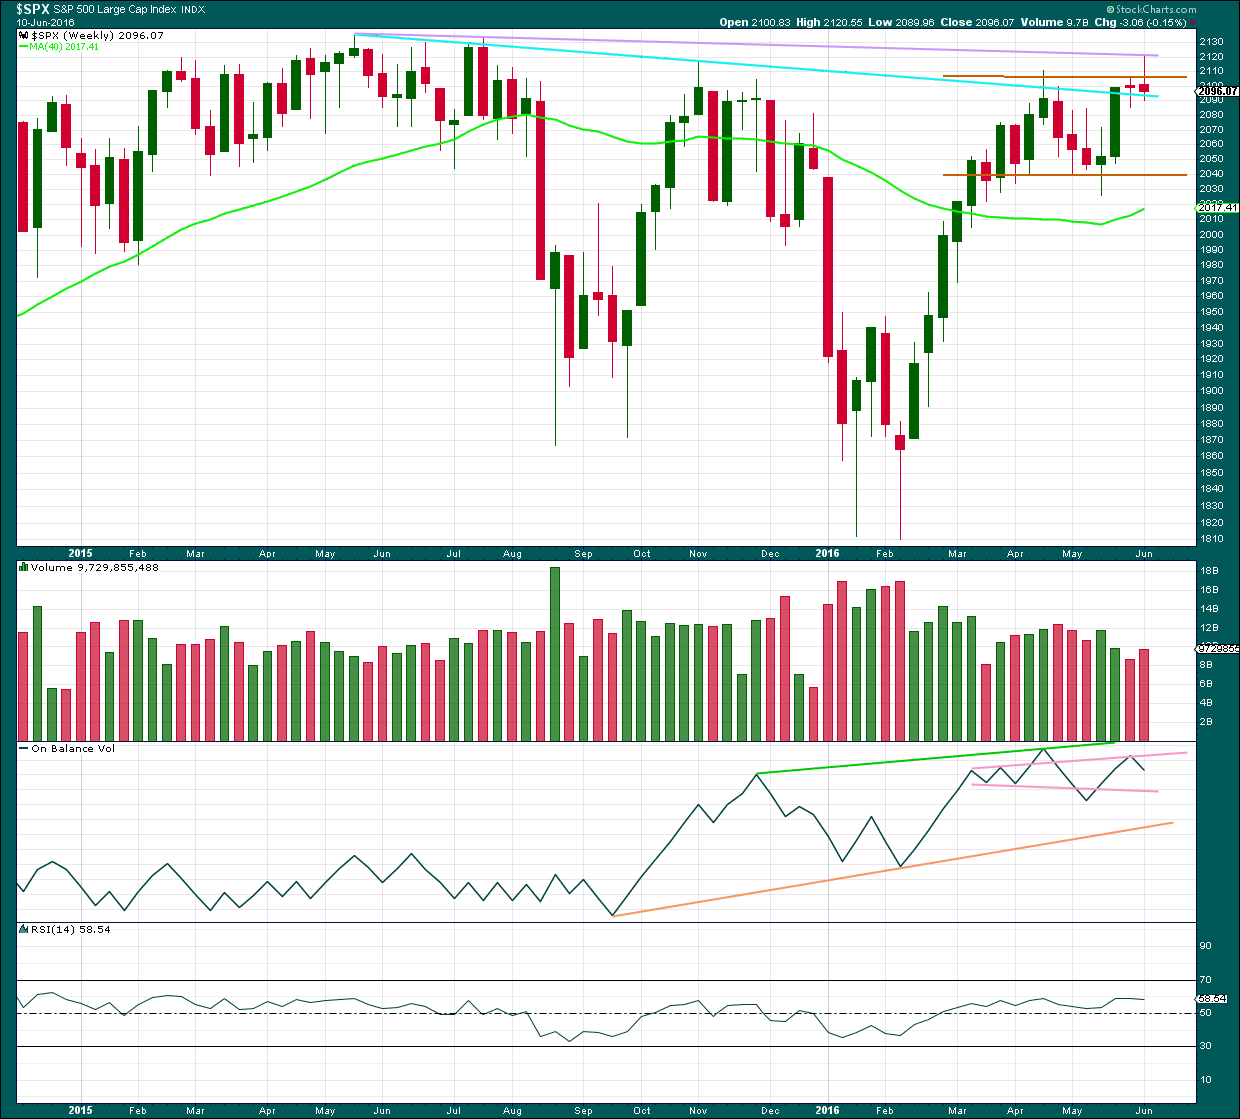
Click chart to enlarge. Chart courtesy of StockCharts.com.
Price is the final determinator and the most important aspect of market analysis. So what has price been doing since the all time high in May 2015?
Price has made an important new high above the prior major high of November 2015. Price is now finding resistance at the lilac line. It can no longer be said that price is making lower highs and lower lows because it no longer has a lower high. This is the most bullish indication from price for many months. This supports the bull wave count over the bear.
Last week completes a shooting star candlestick, which is bearish but on its own not overly so. In this instance, because the upper wick of the shooting star is touching an important trend line, the strength of that line is reinforced and should hold if price again comes up to test it.
On Balance Volume this week gives a bearish signal with a move down and away from the upper pink trend line. There is bearish divergence between the last two highs and OBV: OBV could not make a corresponding new high while price this week made a new high above the prior high of 20th of April. This indicates weakness in upwards movement from price.
Volume is declining while price has essentially moved sideways for the last ten weeks in a zone delineated by brown trend lines. The longer price meanders sideways the closer a breakout will be. During this sideways range, it is a downwards week which has strongest volume suggesting a downwards breakout may be more likely. Last week price overshot the upper edge of this range, but could not break out as it closed back within the range completing a red candlestick.
There is some increase in volume for last week’s red candlestick indicating there was some support for the overall fall in price.
The 40 week moving average has turned upwards, another bullish signal. However, this has happened before in October 2015 yet it was followed by a strong downwards wave. On its own this bullish signal does not necessarily mean price is going to make new all time highs.
DAILY CHART
Click chart to enlarge. Chart courtesy of StockCharts.com.
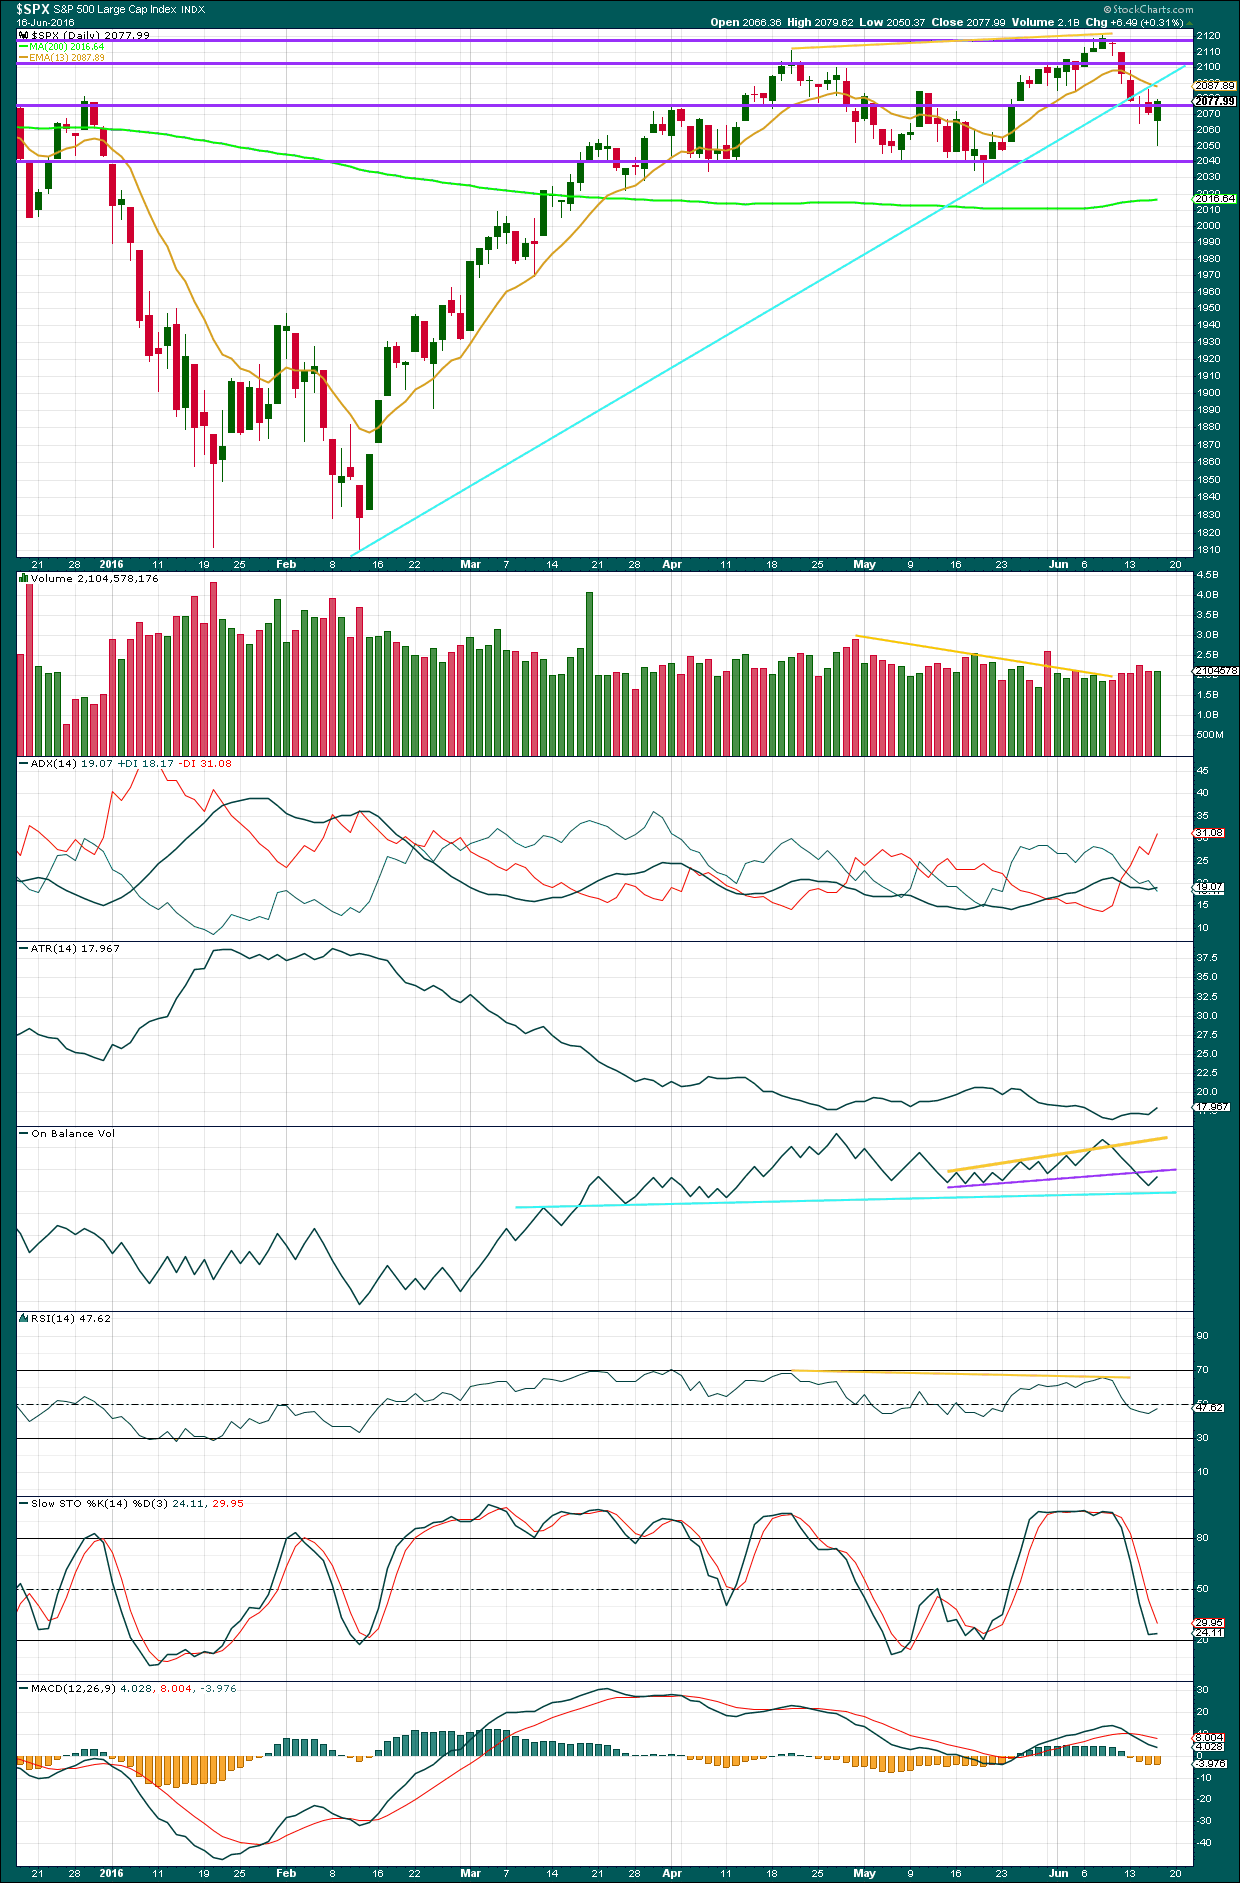
Volume data on StockCharts is different to that given from NYSE, the home of this index. Comments on volume will be based on NYSE volume data when it differs from StockCharts.
The real body of today’s candlestick fully engulfs the real body of yesterday’s candlestick. This completes a bullish engulfing candlestick pattern, and this is the strongest bullish reversal pattern. However, it is not supported by volume; the reversal implications are weakened. Volume for today’s overall upwards session is lighter than yesterday’s downwards session. The rise in price is not supported by volume.
The lower wick of today’s candlestick is less than twice the length of the real body, so this is not a hammer pattern.
ADX today turned slightly upwards indicating a downwards trend is in place. ATR is in agreement as it too is increasing. The trend is down. Upwards movement should be expected to be a counter trend movement.
On Balance Volume today turned upwards in agreement with price. It is very close to the purple trend line which should be expected to provide strong resistance. This may serve to hold down the rise in price; price may not be able to move high enough to reach the targets.
RSI is neutral. There is plenty of room for price to rise or fall.
Stochastics has not reached oversold. There is room yet for price to fall.
MACD indicates momentum is currently downwards.
VOLATILITY – INVERTED VIX MONTHLY CHART
Click chart to enlarge. Chart courtesy of StockCharts.com.
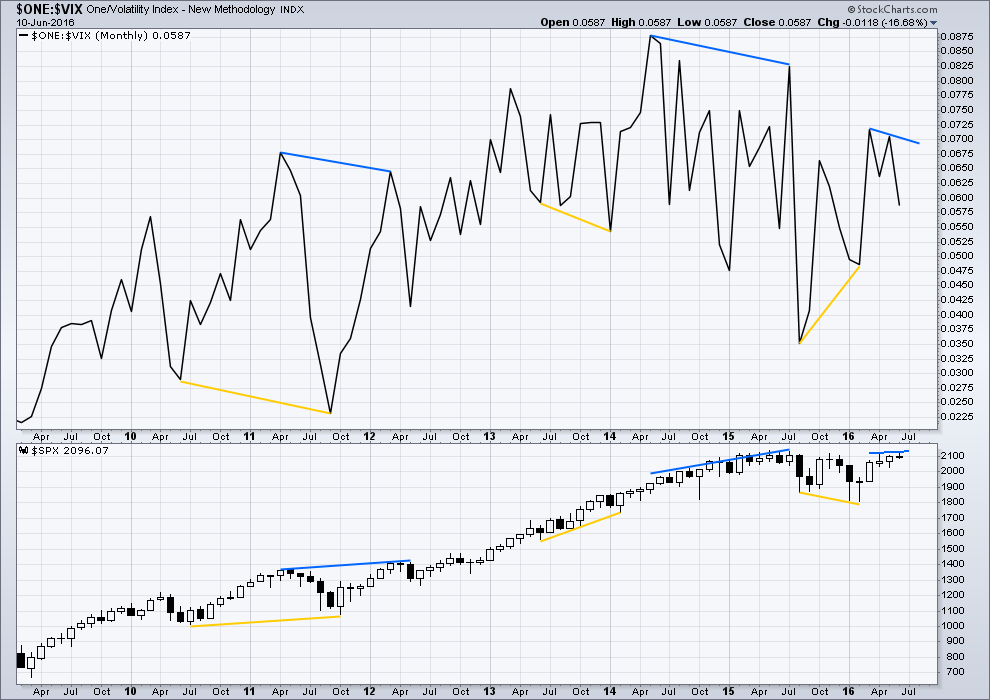
Several instances of large divergence between price and VIX (inverted) are noted here. Blue is bearish divergence and yellow is bullish divergence (rather than red and green, for our colour blind members).
Volatility declines as inverted VIX rises, which is normal for a bull market. Volatility increases as inverted VIX declines, which is normal for a bear market. Each time there is strong multi month divergence between price and VIX, it was followed by a strong movement from price: bearish divergence was followed by a fall in price and bullish divergence was followed by a rise in price.
There is still current multi month divergence between price and VIX: from the high in April 2016 price has made new highs in the last few days but VIX has failed so far to follow with new highs. This regular bearish divergence still indicates weakness in price.
VOLATILITY – INVERTED VIX DAILY CHART
Click chart to enlarge. Chart courtesy of StockCharts.com.
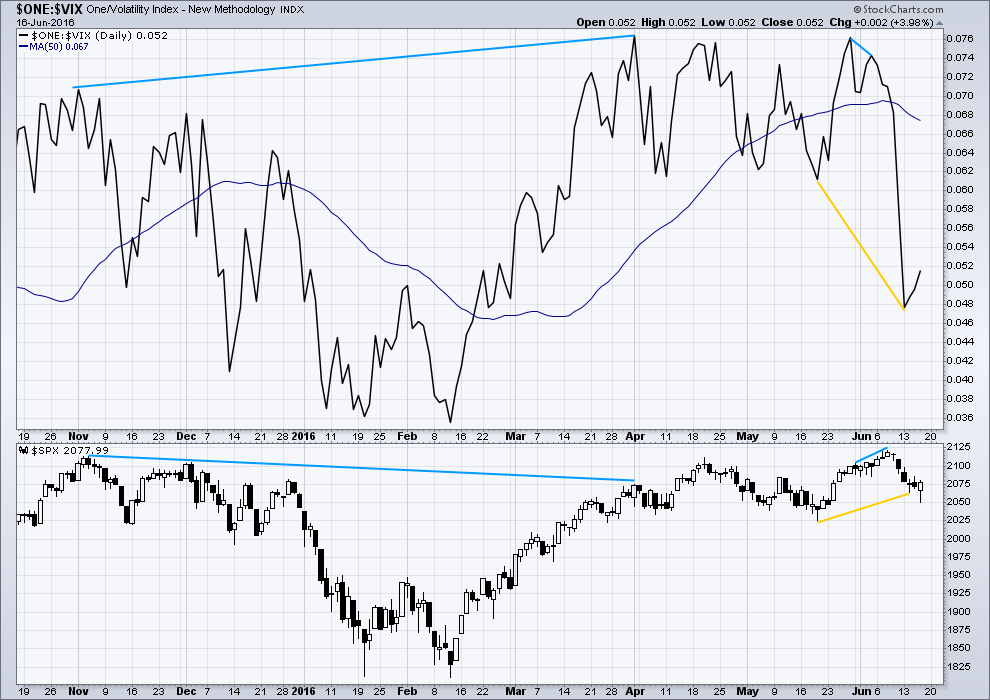
There is now only one instance of hidden bearish divergence noted on this daily chart of price and VIX (blue lines). VIX makes higher highs as price makes lower highs. The decline in volatility is not matched by a corresponding rise in price. Price is weak.
There is also very short term regular bearish divergence (short blue lines). VIX did not make a corresponding new high as price made a new high. This indicates exhaustion for bulls and underlying weakness in price.
Price moved higher for three days in a row (6th, 7th and 8th of June) completing green daily candlesticks yet VIX moved lower. This short term divergence between price and VIX is unusual. It indicates further exhaustion from bulls. This trend in price is weak, especially for the last three days up to the last high.
VIX (inverted) has run away strongly from price. Volatility sharply increased beyond the prior point of 19th May (yellow lines) while price fell.
A divergence 101 interpretation of this is bullish. Volatility is stronger than it was on 19th of May, but this has not translated into a corresponding new low for price. Price is weak. Some upwards reaction would be a reasonable expectation about here to resolve this divergence. At this stage, it looks like that interpretation was correct as it has been followed by some upwards movement from price.
Volatility has declined for the last three days while overall now price has moved mostly sideways. Sideways movement may not be enough to resolve the bullish divergence seen up to four days ago, so it is my interpretation that at least some more upwards movement is likely.
While I would not give much weight to divergence between price and many oscillators, such as Stochastics, I will give weight to divergence between price and VIX. Analysis of the monthly chart for the last year and a half shows it to be fairly reliable.
BREADTH – ADVANCE DECLINE LINE
Click chart to enlarge. Chart courtesy of StockCharts.com.
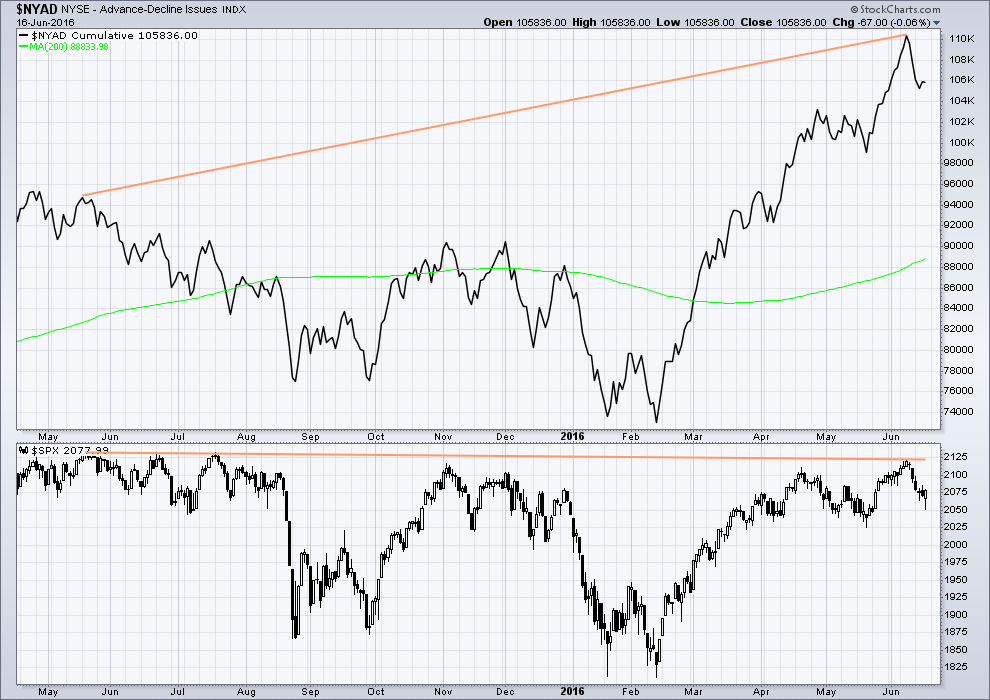
With the AD line increasing, this indicates the number of advancing stocks exceeds the number of declining stocks. This indicates that there is breadth to prior upwards movement.
Taking a look at the bigger picture back to and including the all time high on May 2015, the AD line is making substantial new highs but price so far has not. While market breadth is increasing beyond the point it was at in May 2015, this has not translated (yet) into a corresponding rise in price. Price is weak. This is hidden bearish divergence.
DOW THEORY
The last major lows within the bull market are noted below. Both the industrials and transportation indicies have closed below these price points on a daily closing basis; original Dow Theory has confirmed a bear market. By adding in the S&P500 and Nasdaq a modified Dow Theory has not confirmed a new bear market.
Within the new bear market, major highs are noted. For original Dow Theory to confirm the end of the current bear market and the start of a new bull market, the transportation index needs to confirm. It has not done so yet.
Major lows within the prior bull market:
DJIA: 15,855.12 (15th October, 2014) – closed below on 25th August, 2015.
DJT: 7,700.49 (12th October, 2014) – closed below on 24th August, 2015.
S&P500: 1,821.61 (15th October, 2014) – has not closed below this point yet.
Nasdaq: 4,117.84 (15th October, 2014) – has not closed below this point yet.
Major highs within the new bear market:
DJIA: 17,977.85 (4th November, 2015) – closed above on 18th April, 2016.
DJT: 8,358.20 (20th November, 2015) – has not closed above this point yet.
S&P500: 2,116.48 (3rd Nobember, 2015) – has now closed above this point on 8th June, 2016.
Nasdaq: 5,176.77 (2nd December, 2015) – has not closed above this point yet.
It is a reasonable conclusion that the indices are currently in a bear market. The trend remains the same until proven otherwise. Dow Theory is one of the oldest and simplest of all technical analysis methods. It is often accused of being late because it requires huge price movements to confirm a change from bull to bear. In this instance, it is interesting that so many analysts remain bullish while Dow Theory has confirmed a bear market. It is my personal opinion that Dow Theory should not be accused of being late as it seems to be ignored when it does not give the conclusion so many analysts want to see.
This analysis is published @ 09:41 p.m. EST.
Beginning with the Bear daily count chart, wave (C) was much less of a move in points than (A) wave. Noting wave C’s are typically a ratio of A such as 0.618; equal to; 1.618; 2.618. Wave (C) was dramatically less in time too versus (A): 73% less. This is worrisome to me as a Bear.
Gary,
Earlier (10:39 am) I posted a 5 minute chart of the rally from roughly 2050 to 2080. You had a question regarding the subdivisions especially the fifth wave. I have a 2 minute chart with these subdivisions. Let me know if you think it works or if I missed something, a violation etc. Certainly I welcome comments from anyone on this forum. Thanks
Also, in checking MACD, it appears wave iii has the greatest momentum.
Rodney, the only issue I can observe is in w(iii). It appears to be a series of overlapping waves suggesting an ending diagonal. Wave iii must be an impulse.
It is absolutely fascinating how the old adage of “follow the money” is playing out with regard to giving some clues as to what is going to happen in the UK next Thursday with the Brexit vote. Several analysts whose work I read have remarked on the incredible number of trades being made that are betting on a “remain” vote prevailing. The bets are all so large, and so one-sided that they are opining that the chances of Britain leaving are virtually zero, despite what the polls are showing. I have a slightly different view on how this should be interpreted. My own view is that is does not matter how the people vote, the outcome is a foregone conclusion because of how much entrenched interests, and I don’t necessarily mean the British peole, have to loose. The only question in my mind is how the staid British are going to react to wanton thuggery by EU apparatchiks unceremoniously thwarting the expressed will of the people by rigging and corrupting the voting process to achieve their desired ends. Interesting times!
Vern,
I am looking at British Pound and wondering if the exit is good for the economy why is the currency dropping. It doesn’t make sense and hence would agree with your assessment that the vote will be for Britain to stay in the EU. It might be a good play to consider long position on British Pound, outcome of the vote will result in a ramp in the currency to recover some of the current drop.
GBP has been dropping for nearly 2 years from 1.70 (USD). I’ve been watching and expecting GBP to fall well before a referendum was ever contemplated (and stated that on here).
The EW context suggests to me GBP has much further to fall in future imho. The bounce from 1.39 looks corrective to me – only a move above 1.60 would make me reconsider.
You both make some good points.
My friends over at Bottarelli Research run a trading service they call “Sharp Paper” that follow option traders laying out typically six, and not infrequently seven figures in pure premium on option trades. Considering how often these kinds of trades play out favorably, I imagine these traders get frequent visits from the folks at the SEC. At any rate, the options expert Dan Levy who monitors those trades is noting unusual option buying activity in EWU, VGK, and EUFN. Traders have put over 5 million in pure premium on these trades with July expirations so they must be pretty confident of the Brexit vote outcome. I will be most curious to see how these all trade over the next few weeks.
Vern,
If this vote is indeed going to be for ‘out of euro’, it will probably be the black swan event that tanks the markets huge…hmmm let’s see how markets work but my thinking will be if the markets are ramping into the event, I will cash the positions and place some money on short side just in case. What do you think?
It seems to me the smart way to play an uncertain, but big momentum event like this is with a straddle trade; that will be my approach. It will definitely be a small position as I will be mostly neutral prior to the event. 🙂
Did you mean they are buying call or put options on the symbols you listed?
Yep. Most trades are all one-sided bullish trades with millions in pure call options premium. That is one gutsy trade…a few are debit spreads…but they are all bullish…
I have to say, this is the biggest market mover that has been laid out in front of us in a long while. While I can’t imagine the power brokers letting this go through, this is one trade I don’t want to be on the wrong side of. If this goes through it will be the will of the people and the markets will likely crash. On the other hand if the UK stays in the EU the euphoria will likely send markets to all time highs. Since the smart money is betting on this outcome, you really have to pay attention to that, they don’t make a big bet without good odds. It’s not often there is a line in the sand like this vote. Don’t know what the best play is but I would bet their will be a lot of people who will want to be neutral going into this. That means a lot of unwinding and volatility.
Yep. Those big bets draw a lot of attention. It is not uncommon (although it’s illegal) for market makers to gang up on retail investors who make big option trades. You can be sure those kinds of big bets have a lot of additional money backing them to allow them to defend the positions if it looks like the MMs are trying to manipulate the trade. For small investors like us, the smart way to make a big trade is to ladder into it so as not to draw too much MM attention…. 🙂
Vern, could it be traders straddling this market also? For instance, short the equity futures and at the same time buy a ton of calls?
No question about it. It is one of the reasons the market has been range bound…they are clearly trading around support and resistance in large numbers…anybody saw that volume on Friday for essentially a flat day??! 🙂
(Looks like a few folk accumulating UVXY)
It’s hard to predict what the outcome will be for the uk vote, but I have to say I don’t know anybody personally that is voting to stay in the EU!
Results should be out by 7am on the 24th of June but they will have a rough idea at about 4am, anybody watching Independence Day 2 which is being released that day?
Exactly my point. I would have to conclude foul play if the results are NOT to leave. I would, however, not be at all surprised considering the type of people we are dealing with. Of course another even more interesting outcome, other than outright fraud in the vote counting, would be for the politicians to ignore the results if the leave vote prevails…
Here’s what I see, maybe I have rose colored glasses, and I promise I’m not trying to…I see several 1-2’s, with 3 of 3 starting.
Lara, am I crazy?
No, you’re not crazy. I’m assuming you mean the hourly chart?
That will be my third least likely option today.
YUP,, you are crazy,, I should know,,,,
haaaa….. you are the doc!
That’s it Quang Vo. The Doc’s diagnosed you as crazy.
It’s all downhill from here….. 🙂
Here’s another RTM trade to liven up your weekend…Enjoy! 🙂
(Chart of TLT)
This whole action since the 15th feels like some sort of 4th wave imho. Olga got me looking at something different.
Aaaahh… yes, another possibility!
Will chart that and look into it…
How many charts to publish? I have to keep it manageable for me and for you all too.
Looking closer I think W(c) from above chart is the complex wave of the triangle.
I don’t really like seeing wave b down as a zigzag, I think that move fits much better as an impulse. But, to be fair, it’s impossible to tell with certainty which one it is.
I’ve decided to not publish this idea for clarity sake. There are enough charts, and this idea does not diverge substantially enough in terms of expected direction at this stage to warrant a fourth chart. That may also lead to paralysis by over analysis.
I will keep an eye on it and if it shows itself to be correct then I will publish it.
Thank you Gary. Keep the ideas coming!
Market action looking very bearish. UVXY clambered back above that support shelf going into the close and really should be heading South ahead of a strong c wave corrective wave. I suspect surprises are going to be to the downside. Have a great weekend everyone!
Thanks Verne! You have a fabulous weekend yourself.
Me, no waves left. But surfed several days this week so my arms need a rest 🙂 I’m so happy….
Much happy many wow
Good morning every body 🙂
I’m thinking so far that the second alternate now has a better fit and look to it today. I’ll be switching the order of those three hourly charts around:
most likely the second alternate (will be new main hourly) minor 2 unfolding up as a zigzag
next likely first wave count (will be first alternate) minor 2 unfolding as a flat, and minute b within it could be a triangle as per Olga’s idea below
least likely and reduced in probability today first alternate (will be second alternate) minor 3 down underway. this move down today is just too weak on all time frames, it just doesn’t look right as the start of a third wave
conclusion short term: target 2,094. if that target is too low then the round number of 2,100 may be tested again next week. the black and cyan trend lines should provide strong resistance, so if when price gets up to one / both and is close to the target it would very likely end there.
my plan is to hold onto my shorts and get more shorts at the end of minor 2.
I am doing same Lara, thanks for all your work. Have a great weekend.
So what happened to this big triple option expiration that was to occur?
One BIG non-event!
One BIG snooze session!
BIG Volume on the close… I guess that is the effect of Triple. Very Little Price effect though! SO Non-Event wins!
Volume 1290.240 Million atm and still moving higher!
Well what a snooooze fest. Could (b) of Minor 2 be tracing out a triangle???
Thanks for the wave count Olga! Looks good. 🙂
A lot more bears around this week.
June 16th: 25.35% (bullish), 37.15% (netrual), 37.50% (bearish)
June 9: 27.83% (bullish), 44.34% (netrual), 27.83% (bearish)
That index reading of sentiment never works. AAII??? A waste!
http://www.barrons.com/public/page/9_0210-investorsentimentreadings.html
73% Bulls Consensus Index
UVXY getting sold despite markets in RED, tells me turn coming soon..
Yep. Short sellers having the last party on this final wave up.We are going probably to close the 12.09 open gap and I think that will be all she wrote! 🙂
Short sellers pushing back against MM ramp up in UVXY. If they take out 13.44 we will close the 12.09 gap in very short order…I did not think the MMs would win that options expiration brou-ha-ha..too many folk shorting that animal…
Let’s print that SPX green candle so I can close screens and go do something on my “honey-do” list… 🙂
Someone posted yesterday the VIX put call ratio was 1.22 and I missed the fact that they were talking about the VIX itself and not SPX. They were correct is stating that that figure for VIX did indeed mean lots of traders were expecting it to tank. The spikes up in volatility today was probably designed to shake out a few folk from that crowded trade… 🙂
Just sold out of SPXS etf for the same price I paid, less my $1 commission loss. A crappy 3x inverse ETF, was right by 50 spx basis points and made nothing!
A lot of those instruments are designed by crooks. It is a huge mistake to make position trades with them. Believe me, I Iearned that the hard way! One of the very worst is DUST. The folk issuing that dog should be in jail for securities fraud…
It’s a daily reset (settles out daily)… meaning they are not designed to hold for very long. 1 to 3 weeks is what it is designed for. Chop for a long period really kills it.
Based on my experience with them and what I am using it for … 2 to 3 months MAX! But you have to get the price break and a continued move down. For a P3 move down to the target 1595 or even better 1271, you will make a ton. If you sell out on a day of max volatility you will really make out. In Aug 2015 I sold 50%… I should have sold 100%. Then reposition at the right time.
If you want less erosion… a 2 X is better (SDS) than 3 X and a 1 X has the least erosion.
I’m going stick with my futures, dabble in ETF’s once and awhile.
Peter, Do you hold ES or E-mini’s overnight? Or just day trade them?
What is the best Broker to trade E-Mini from a margin perspective? For both day trades and for overnight or longer?
Who has the most comfortable platform?
I am looking to start using them… But not sure I figured out how the margin works for these. How much to control 1 contract for the day and 1 contract overnight? What time begins a new day from a margin perspective if a trade is put on after hours?
EWI just released Prechter’s Elliot Wave Theorist for June. It’ll probably be the last one I see, as I called last week and canceled.
I haven’t read it in full yet, but from a quick scan here’s what appears to be the bottom line…
He went big-time bullish at the February low. Now he’s not so sure. He’s wondering if the top may be in at the June high, calling it a possible truncated 5th and citing some key time relationships going back to 1932.
We’ll see, won’t we?
Bob really needs to retire imo…. 🙁
He seems to have been “phoning it in” for the last year or so, with more and more large charts that fill up a lot of space. Very few new insights about anything related to financial markets.
He’s turned his best attention to Socionomics. Fine.
Some of the recent issues of EWT have been an outright embarrassment. I did not even bother to read the last few ones he published. I had no idea what relevance they had to the markets- fact is I did not think they had any…
And EWFF and STU. Haven’t been reading any of them lately, so it was time to trim the expense.
Curtis,
So the way I see it, he was right in going bullish off Feb lows so far as the markets have not given much in terms of the gains from Feb lows.
I think he was calling for new ATHs. So he’s right until price make a new low below 1,810.10.
But I haven’t seen his wave count for that, so I don’t know how he resolved the problems I have with cycle wave IV not fitting properly as a completed correction.
He is looking for new highs after correction. Looks to be preferred count.
He says” there is a slim chance that wave (5) just ended in a rare event called a truncation meaning that it is already over and failed to climb above the peak of wave (3)”
He goes on to say that “a break of the Feb low in the DOW would erase all chances for a new all-time high and confirm that a Grand Supercycle bear market is already underway.”
He is keeping options open.
I am actually glad that they are looking for new highs…
since my more recent sub (Have followed him in late 70’s through 80’s) with them which started in mid 2012 he has called the top several times. All proved wrong except the May 2015 Top and now they have moved away from it as the preferred.
Well, to be fair, with price range bound for over a year the situation isn’t that clear from a technical perspective, not EW.
Civacco Capital’s last video I watched (the start of it anyway, haven’t finished yet) covers the confusion… and repeats that the market is currently in a huge consolidation. I like them, very solid TA.
I will take a look at them… Thanks Lara.
He wasn’t pounding the table in Feb… it was like oh BTW… this may still happen.
I will be cancelling very soon as well. They have made that big Bear call since 2012… and some how always extended.
I think it moved low enough for the MMs at around 2063.38. It won’t be an expanded flat but it probably fulfilled its purpose…
It would be nice to see the possible b wave move a bit lower; does not have the right look so far as a % of the a wave goes….UVXY really fighting to maintain that support shelf around 14.00….interesting!
Vern,
Or Likely has been parked there for triple witching …
Indeed! The MMs may not be able to hold off the short sellers though. It may be a loosing battle for them to try and hold that pivot…
Move down should have snagged a few more eager beavers. Made a quick double on puts expiring today. Now for the whipsaw…
I’m having conflicting thoughts on the market. If the Brexit referendum vote will proceed as before, it would only make sense that next week will be volatile. But today’s VIX and UVXY action suggests we’ve bottomed in the short-term…
Any thoughts?
Beware the paralysis of analysis! 🙂
Ari,
You really think that after yesterday’s horrible tragedy the vote will be unbiased.
It’s biased already IMO because there seems to be quite a lot of propaganda about it, and not so much facts reported. But then, that’s the modern media landscape for you.
I think yesterdays shooting it will amplify emotion that was already existing.
FWIW, My thoughts
don’t like it because it means we’ll have to wait and wait for Minor 2 to finish 🙂
Can’t see how you’re counting your w(v) of w(1) Rodney, but w(iii) of w(5) of w(1) may be the shortest.
He’s okay. (i) is 12.86 points, (iii) is 14.91 points (or 14.73 if (iv) is a flat which works better).
Rules met ✔
I was looking at w(v) of 1.
took profits, the blue VIX line is too far on the top of the chart for a sell signal for me. 2 hour chart
Seems like the market gravitates to round numbers during options exp. I’m guessing there are a lot of 1950 and 2000 options that will expire worthless….1975 is in the middle but wouldn’t be surprised to see either 1950 or 2000 by days end
I think the second alternate in play so we should see a bit more donwards movement to trap a few more bears. Hedging long bullish UVXY spread with bearish 15/20 call spread…UVXY will not hold support shelf and will probably fill open gap at 12.09 today…
Yesterday’s SPX daily bullish engulfing candlestick not only engulfed the previous day, Wednesday, but it also engulfed Tuesday’s red candlestick. According to Nison, this adds strength to the bullish engulfing candle.
This being the first 2nd wave correction showing on the daily charts, I will not be surprised to see it test the 2120 level again. If that proves to be correct, we should see UVXY close both lower gaps bringing it down below 10.50.
Rodney,
Bang on, I am expect UVXY to go below 10.00 over the coming week if not today/Monday.
This is the /ES futures ichimoku 4H. Most likely parallel the cloud down but it could test the cloud edge before resuming downtrend.
ES futures Ichimoku cloud suggest it is downwards today paralleling the shadow down.
This is the 1H cloud.
Lara – for subscribers born with little patience (me), your short-detailed summary’s in first paragraph are awesome! Gives us targets to watch and idea of direction.
Keep up great work!
Kevin
You’re welcome Kevin. Gotta make it easy for everyone!
One of my favorite trade set-ups is the RTM (reversion to the mean) trade. It is one of those “bread and butter” kinds of trade every trader should cultivate, and keep a few in his/her back pocket. It is especially reliable when it comes with the distribution signal of very high volume and stalled price or even better a bearish (or bullish) reversal. 🙂
(BTW, that is a chart of GLD)
Thanks Verne, this is one I need to cultivate myself.
That was a nice blowoff top in Gold yesterday, with a sharp reversal.
I noticed something about the psychology of that. When commodities have those blowoff moves (tops or bottoms) if traders aren’t well positioned it tells them “get in now! quick! you’ve missed most / all of this move and now it’s running away from you!” and they’ll get in at exactly the wrong time.
If traders already have positions they’ll see the strong move and think “yay! more profits coming my way! this thing is really starting to move now” and they’ll not exit at the right time, they’ll hold on.
When actually those blowoff moves that commodities do are the sweetest nicest indicator of a trend change you’ll ever see in a market. Easy to see when they arrive, and they almost always mean a trend reversal at that point.
Amen to that Lara! 🙂
Futures strangely muted. European bourses all up 1% +
The banksters are holding cards closely so today could be a good SOH day for short term trades until we see what they are up to. A strong upside move should be signaled by at least another point drop in UVXY to well below the 14.00-14.50 shelf area and probably fill last Friday’s open gap at 12.09…
FWIW, Lara’s second alternate fits the volatility price action perfectly, with initial upper BB penetration coming at the end of minuette three down on Tuesday, and a slightly higher high in both VIX and UVXY today at the end of minuette five down. The implications are profound. Many traders could get ambushed by a new low in a wave b correction tomorrow if this wave count is indeed the correct one. Keeping this possibility in mind will keep everyone here one step ahead of the banksters! Cheerio! 🙂
PS I think Gary also alluded to this possible wave count earlier today…
Correction: It was actually Ari who posited the completion of minor one down today. Gary actually posited the possibility of a fifth wave down to complete an impulse…
🙂
Still musing over today’s action and peering into the UVXY tea leaves for some inkling of what might be afoot. There is no question the long upper wick in VIX and movement around the BB are quite bullish short term. There is however a plethora of other indicators that point to considerable downside risk in this market. I have always thought the 14.00- 14.50 area was an important pivot for UVXY as a clue to where the market likely was headed. That area the last few days has acted as a kind of shelf of support and it was interesting to see how it clambered back above after being briefly driven below it in price action yesterday. It appeared to have made another attempt to reclaim it today and I think what happens tomorrow with regard to this shelf will give us some idea of what to expect over the next few trading sessions. Also interesting to note so far only one of four “stacked gaps” has been filled. I would expect at least two to be filled on a second wave correction at this degree.
Hi! 🙂
Hey Carty, second again 🙂
Hello.