
A small bounce began mostly as expected, but it did not begin with a final low first.
Summary: The trend is down; look out for surprises to the downside. There is now enough technical indication of a trend change for a short position to be entered. Corrections are an opportunity to join the trend. In the short term, a small multi day bounce may continue tomorrow for a few days. It should find strong resistance at the lower edge of the black channel on the daily chart, and at the cyan trend line.
Trading advice (not intended for more experienced members): Short positions entered above 2,100 should at least have stops moved to break even if not a little below. Position traders holding short positions opened reasonably above 2,100 may like to hold onto those; 2,100 should offer strong resistance now for any bounce.
Looking at the bigger picture, any short positions entered here should be profitable within a week and may still offer a very good risk / reward set up. However, any members entering short here must understand there is a risk the position may be underwater for several days before becoming profitable. With that in mind, it is essential to manage risk: no more than 2-3% of equity should be risked if entering short here.
Choosing to be patient and wait may offer a better entry but runs the risk of missing a strong downwards movement. On balance, it is still my judgement that price will continue up for a reaction to test the trend line, so I will still not be adding to my short position for another two or so days. If I did not yet have a short position, I may choose to enter a small position here and wait to enter another slightly larger position higher up.
Stops (and risk) for new positions must be just above 2,120.55
Last published monthly charts are here.
New updates to this analysis are in bold.
BEAR ELLIOTT WAVE COUNT
WEEKLY CHART
Click chart to enlarge.
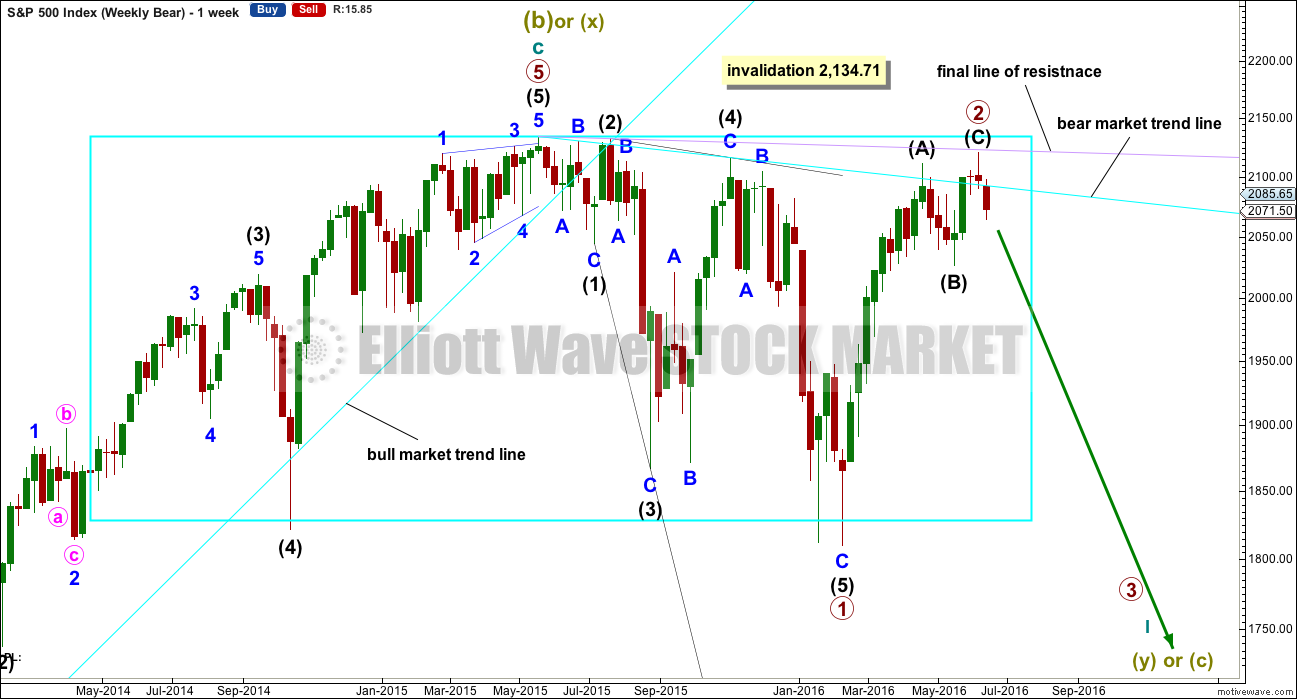
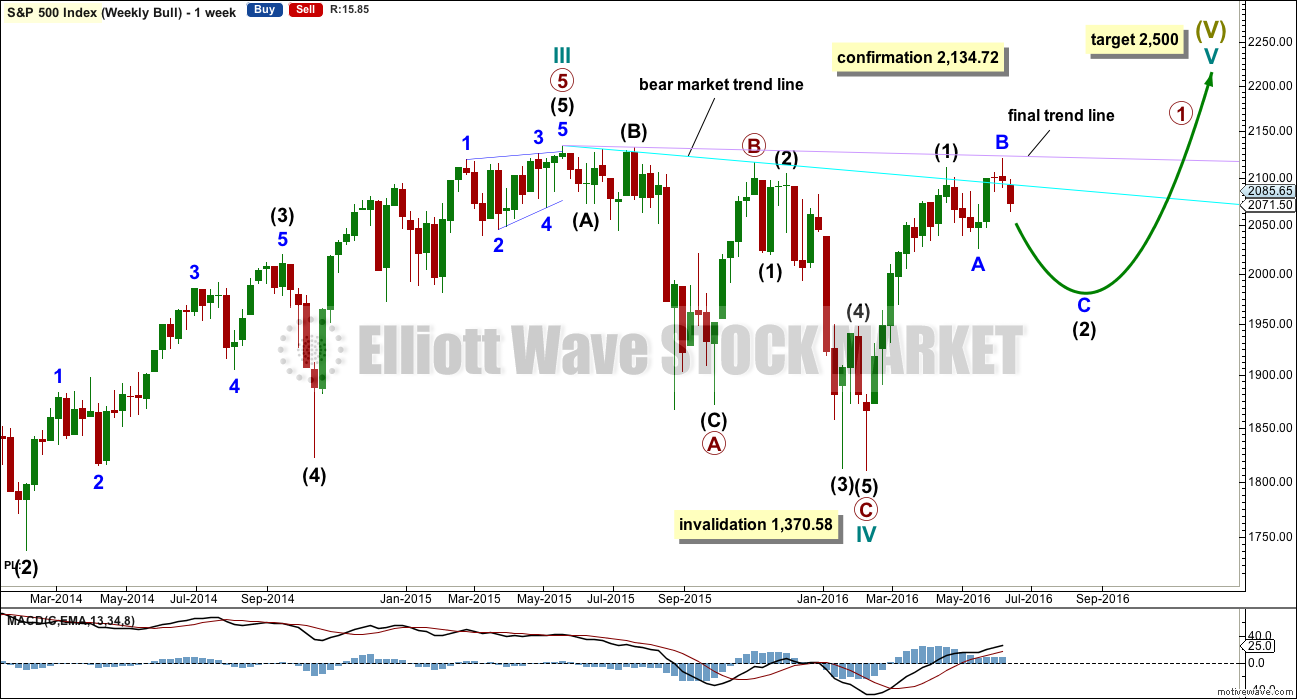
The box is added to the weekly chart. Price has been range bound for months. A breakout will eventually happen. The S&P often forms slow rounding tops, and this looks like what is happening here at a monthly / weekly time frame.
Primary wave 1 is seen as complete as a leading expanding diagonal. Primary wave 2 would be expected to be complete here or very soon indeed.
Leading diagonals are not rare, but they are not very common either. Leading diagonals are more often contracting than expanding. This wave count does not rely on a rare structure, but leading expanding diagonals are not common structures either.
Leading diagonals require sub waves 2 and 4 to be zigzags. Sub waves 1, 3 and 5 are most commonly zigzags but sometimes may appear to be impulses. In this case all subdivisions fit perfectly as zigzags and look like threes on the weekly and daily charts. There are no truncations and no rare structures in this wave count.
The fourth wave must overlap first wave price territory within a diagonal. It may not move beyond the end of the second wave.
Leading diagonals in first wave positions are often followed by very deep second wave corrections. Primary wave 2 would be the most common structure for a second wave, a zigzag, and fits the description of very deep. It may not move beyond the start of primary wave 1 above 2,134.72.
So far it looks like price is finding resistance at the lilac trend line. Price has not managed to break above it.
DAILY CHART
Click chart to enlarge.
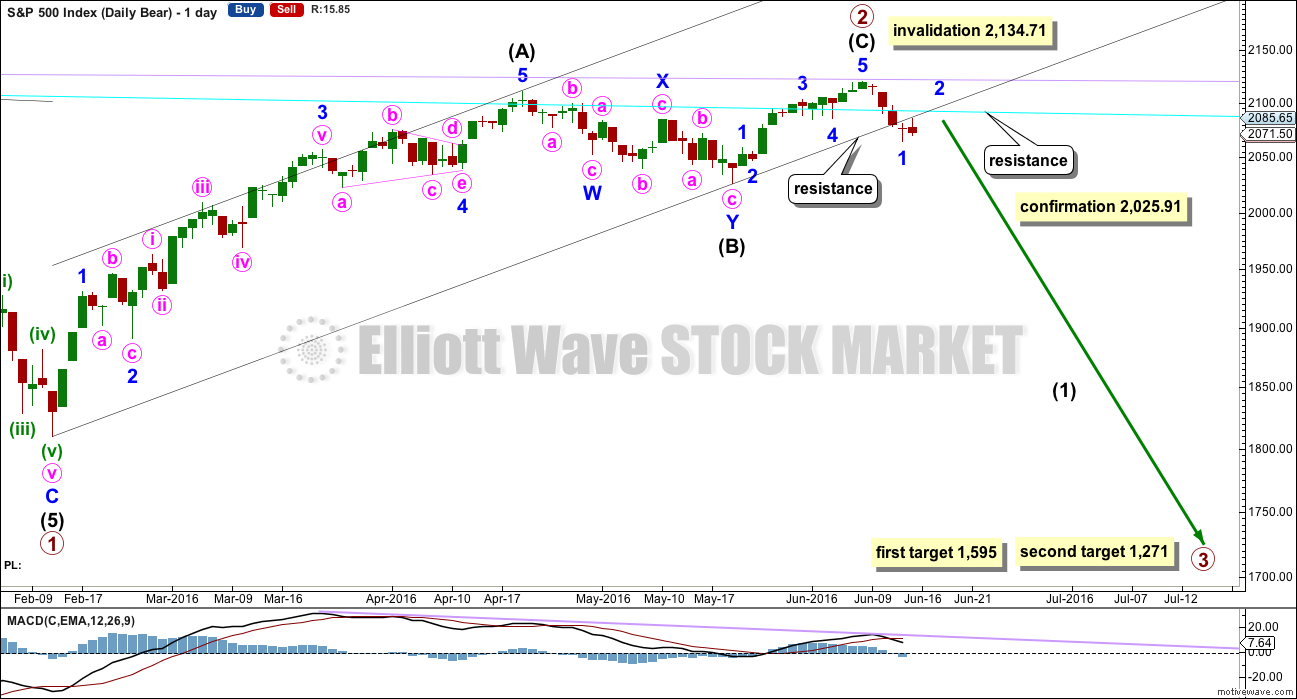
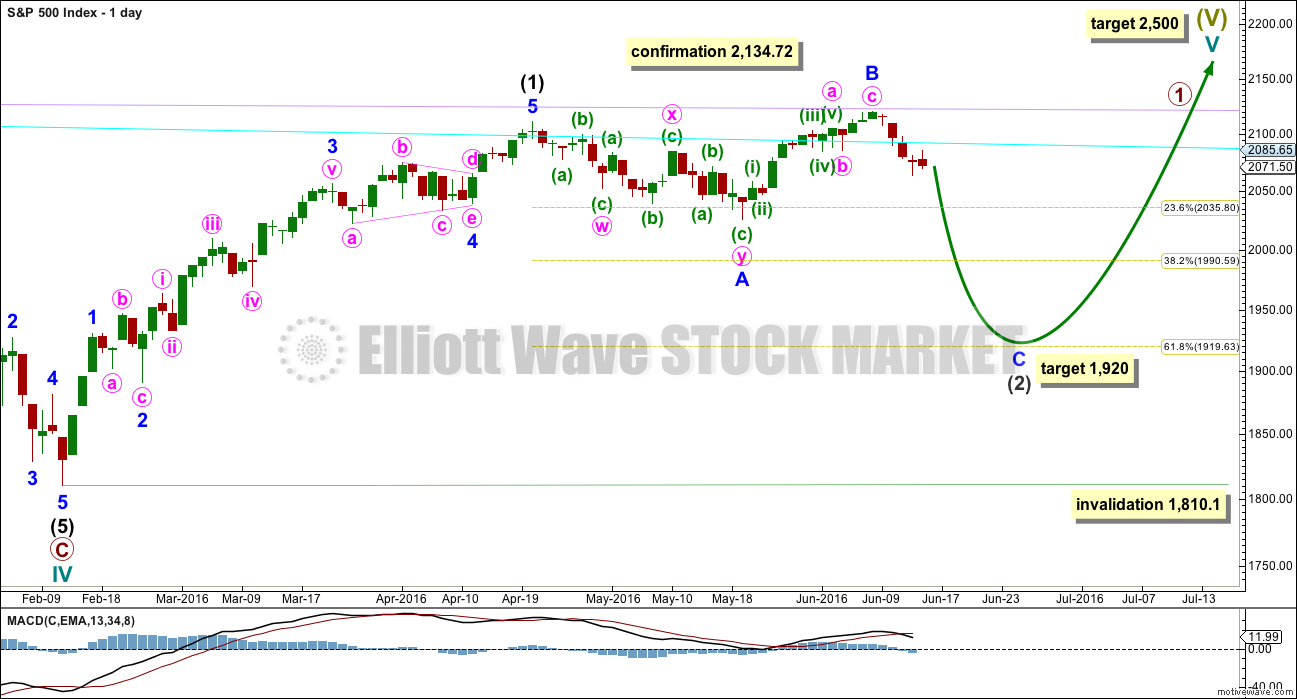
Primary wave 2 would be a 0.96 correction of primary wave 1. Second wave corrections following first wave leading diagonals are commonly very deep, so this fits the most common pattern if primary wave 1 was a leading diagonal.
The most common structure for a second wave correction is a zigzag.
There is no Fibonacci ratio between intermediate waves (A) and (C).
Draw a channel about primary wave 2 using Elliott’s technique for a correction: draw the first trend line from the start of the zigzag, then a parallel copy on the end of intermediate wave (A).
Intermediate wave (C) is a complete impulse and primary wave 2 is a complete zigzag. With a full daily candlestick below the wide black channel and not touching the lower edge, there is some confidence that primary wave 2 is over.
Intermediate wave (C) lasted a Fibonacci thirteen days. Intermediate wave (B) lasted a Fibonacci twenty-one days and intermediate wave (A) lasted forty seven days (not a Fibonacci number). Primary wave 2 would have lasted eighty one days (also not a Fibonacci number). If primary wave 3 exhibits a Fibonacci duration, then a reasonable estimate would be a Fibonacci 144 days.
A new low below 2,025.91 would provide final price confirmation of a trend change. At that stage, downwards movement could not be a second wave correction within intermediate wave (C) and so intermediate wave (C) would have to be over.
The targets calculated are provisional only. They come with the caveat that price may yet move higher which means the targets would move correspondingly higher. They also come with the caveat that at this very early stage a target for primary wave 3 may only be calculated at primary degree. When intermediate waves (1) through to (4) within primary wave 3 are complete, then the targets may change as they can be calculated at more than one wave degree. Primary wave 3 may not exhibit a Fibonacci ratio to primary wave 1.
The first target at 1,595 is where primary wave 3 would reach 1.618 the length of primary wave 1. This target would most likely not be low enough because primary wave 2 is very deep at 0.96 the length of primary wave 1. Primary wave 3 must move below the end of primary wave 1, and it must move far enough below to allow subsequent room for primary wave 4 to unfold and remain below primary wave 1 price territory. Normally, there is a gap between first wave and fourth wave price territory, particularly in a bear market.
The next target may be more likely. At 1,271 primary wave 3 would reach 2.618 the length of primary wave 1.
If primary wave 3 does not exhibit a Fibonacci ratio to primary wave 1, then neither of these targets would be correct.
Well before these targets, it should be obvious if the next wave down is a primary degree third wave. It should exhibit increasing ATR, strong momentum, and a steep slope. However, please note that although it may begin very strongly it does not have to. It may also be that intermediate wave (1) maintains an ATR about 20 – 30 and has some deep time consuming corrections within it. That was how the last primary degree third wave began within the last bear market, so it may happen again.
Normally, the first second wave correction within a new trend is relatively time consuming and deep. Even to start primary wave 3, this should be expected as fairly likely. Although it is possible today that minor wave 2 was over as a very brief shallow correction, it is still more likely that it will continue for a few days more to have a more typical look on the daily chart. I would expect at least one green candlestick or doji within it. So far it has lasted one day. It may continue for a further two or four to total a Fibonacci three or five.
MAIN HOURLY CHART
Click chart to enlarge.
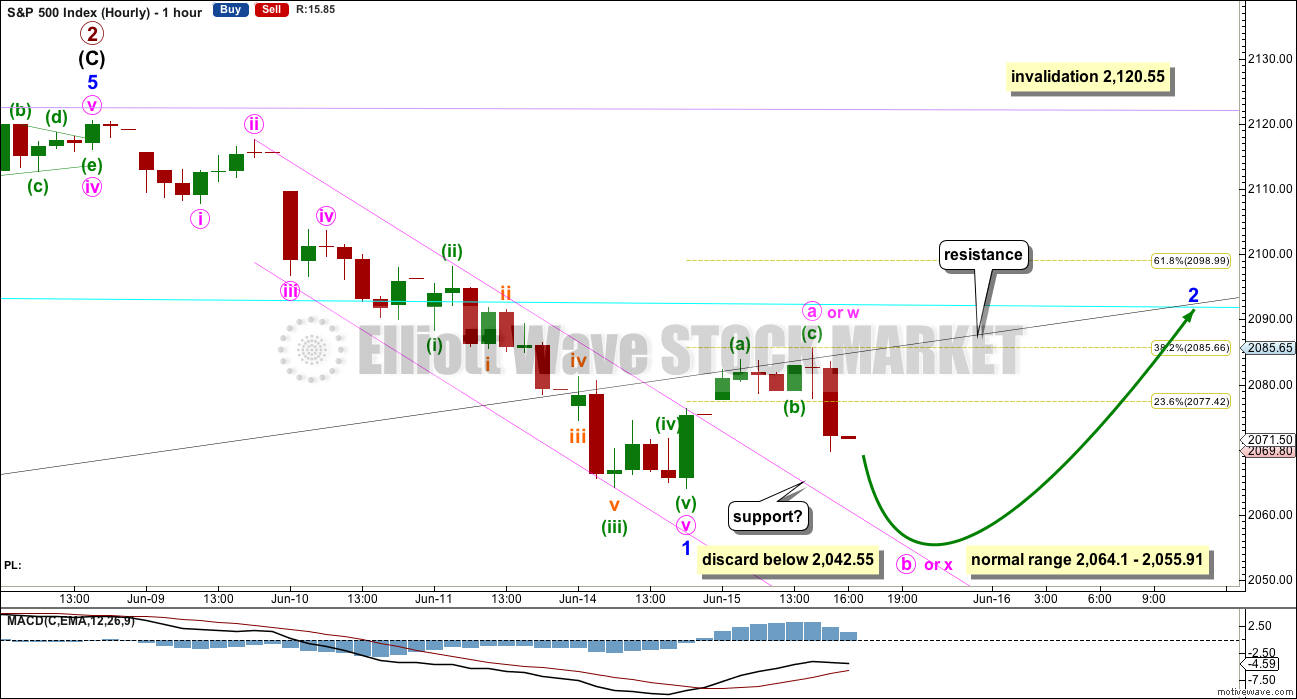
Both hourly wave counts today will see minor wave 1 as over. The channel about it is breached. This may still be a fourth wave correction, but at this stage that does look less likely due to the size of it. That possibility will be kept in mind and published if it begins to look correct. At this stage, it would not diverge much in terms of expected direction (I choose to not publish it today to keep the number of charts manageable and present a simpler picture).
This main wave count sees minor wave 2 as incomplete because it would most likely be longer lasting and deeper than today’s small upwards movement. This is supported a little by lighter volume for today’s red candlestick.
Minor wave 2 may unfold as any corrective structure except a triangle. So far the first movement within it subdivides as a zigzag. This eliminates a larger zigzag for minor wave 2 if it is continuing and leaves a flat or combination open.
If minor wave 2 is a flat correction, then minute wave b within it must reach down to a minimum 0.9 length of minute wave a at 2,066.26.
If minor wave 2 is a flat correction, then the normal range for minute wave b within it is 1 to 1.38 the length of minute wave a, giving a range from 2,064.10 to 2,055.91. Minute wave b may make a new price extreme beyond the start of minute wave a below 2,064.10 as in an expanded flat. A new low tomorrow does not mean minor wave 2 is over.
If minor wave 2 is a double combination, then the first structure in the double would be a completed zigzag labelled minute wave w. The double needs to be joined now by a three in the opposite direction labelled minute wave x. There is no minimum requirement for X waves within combinations and they may make a new price extreme beyond the start of the first structure in the double. X waves may subdivide as any corrective structure.
If minor wave 2 is a double combination, then minute wave y may be either a flat (most likely) or a triangle (least likely). A double combination would be a very choppy overlapping sideways movement that continues for at least another two days, and maybe longer.
There is no Elliott wave rule which gives a limit for a B wave within a flat (or an X wave within a combination). There is a convention within Elliott wave that states when the potential B wave is more than twice the length of the A wave the probability that a flat is unfolding is so low the idea should be discarded. Here, that price point would be 2,042.55.
If the next wave down subdivides as a three and exhibits weaker momentum than the end of minor wave 1, then this wave count would be supported. Structure of the next wave down and MACD will be watched closely tomorrow.
If the next wave down shows a strong increase in momentum beyond that seen at the end of minor wave 1, then use the alternate wave count below.
ALTERNATE HOURLY CHART
Click chart to enlarge.
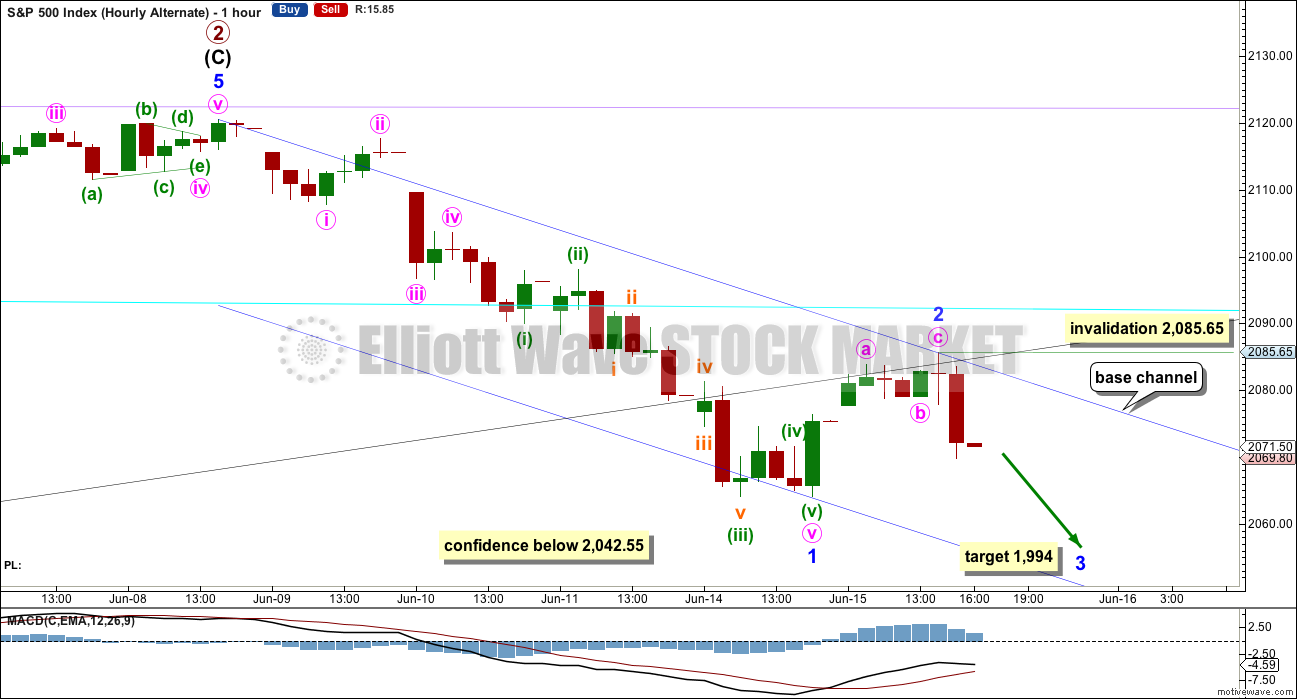
This wave count is identical to the main hourly wave count with the sole exception of the degree of labelling for today’s upwards movement. It is possible but less likely that minor wave 2 is over as a quick shallow 0.382 zigzag.
At any stage, a new high by any amount above 2,085.65 would invalidate this wave count. No second wave correction may move beyond the start of its first wave within minor wave 3.
At 1,994 minor wave 3 would reach 1.618 the length of minor wave 1.
Minor wave 1 lasted four days (not a Fibonacci number) and minor wave 2 may have lasted just one day. Minor wave 3 may be expected to last a Fibonacci eight or thirteen days. It would most likely show its subdivisions on the daily chart, so two small corrections within it for minute waves ii and iv may turn up as doji or green candlesticks with small real bodies.
If price falls strongly tomorrow and MACD shows stronger momentum than the end of minor wave 1, then this wave count would increase in probability.
A new low below 2,042.55 would see the main wave count discarded in favour of this alternate.
BULL ELLIOTT WAVE COUNT
WEEKLY CHART
Click chart to enlarge.
Cycle wave IV is seen as a complete flat correction. Within cycle wave IV, primary wave C is still seen as a five wave impulse.
Intermediate wave (3) has a strong three wave look to it on the weekly and daily charts. For the S&P, a large wave like this one at intermediate degree should look like an impulse at higher time frames. The three wave look substantially reduces the probability of this wave count. Subdivisions have been checked on the hourly chart, which will fit.
Cycle wave II was a shallow 0.41 zigzag lasting three months. Cycle wave IV may be a complete shallow 0.19 regular flat correction, exhibiting some alternation with cycle wave II and lasting nine months. Cycle wave IV would be grossly disproportionate to cycle wave II, and would have to move substantially out of a trend channel on the monthly chart, for it to continue further sideways as a double flat, triangle or combination. For this reason, although it is possible, it looks less likely that cycle wave IV would continue further. It should be over at the low as labelled.
At 2,500 cycle wave V would reach equality in length with cycle wave I.
Price has now broken a little above the bear market trend line. This line is drawn from the all time high at 2,134.72 to the swing high labelled primary wave B at 2,116.48 on November 2015. This line is drawn using the approach outlined by Magee in the classic “Technical Analysis of Stock Trends”. To use it correctly we should assume that a bear market remains intact until this line is breached by a close of 3% or more of market value. Now that the line is breached, the price point at which it is breached is calculated about 2,093.58. 3% of market value above this line would be 2,156.38, which would be above the all time high and the confirmation point.
This wave count requires price confirmation with a new all time high above 2,134.72.
While price has not made a new high, while it remains below the final trend line (lilac) and while technical indicators point to weakness in upwards movement, this very bullish wave count comes with a strong caveat. I still do not have confidence in it. It is produced as an alternate, because all possibilities must be considered. Price managed to keep making new highs for years on light and declining volume, so it is possible that this pattern may continue to new all time highs for cycle wave V.
The invalidation point will remain on the weekly chart at 1,370.58. Cycle wave IV may not move into cycle wave I price territory.
This invalidation point allows for the possibility that cycle wave IV may not be complete and may continue sideways for another one to two years as a double flat or double combination. Because both double flats and double combinations are both sideways movements, a new low substantially below the end of primary wave C at 1,810.10 should see this wave count discarded on the basis of a very low probability long before price makes a new low below 1,370.58.
DAILY CHART
Click chart to enlarge.
Intermediate wave (2) may still be an incomplete flat correction. Minor wave A will subdivide as a three, a double zigzag, and minor wave B may be seen as a single zigzag.
The most likely point for intermediate wave (2) to end would be the 0.618 Fibonacci ratio at 1,920.
Intermediate wave (2) may not move beyond the start of intermediate wave (1) below 1,810.10.
While it is possible that intermediate wave (2) may be a complete double zigzag at the low labelled minor wave A, this would be a very shallow and rather quick second wave correction. The first reasonable second wave correction within a new bull market should be expected to be deeper and more time consuming for this bull wave count, so intermediate wave (2) is expected to continue.
TECHNICAL ANALYSIS
WEEKLY CHART
Click chart to enlarge. Chart courtesy of StockCharts.com.
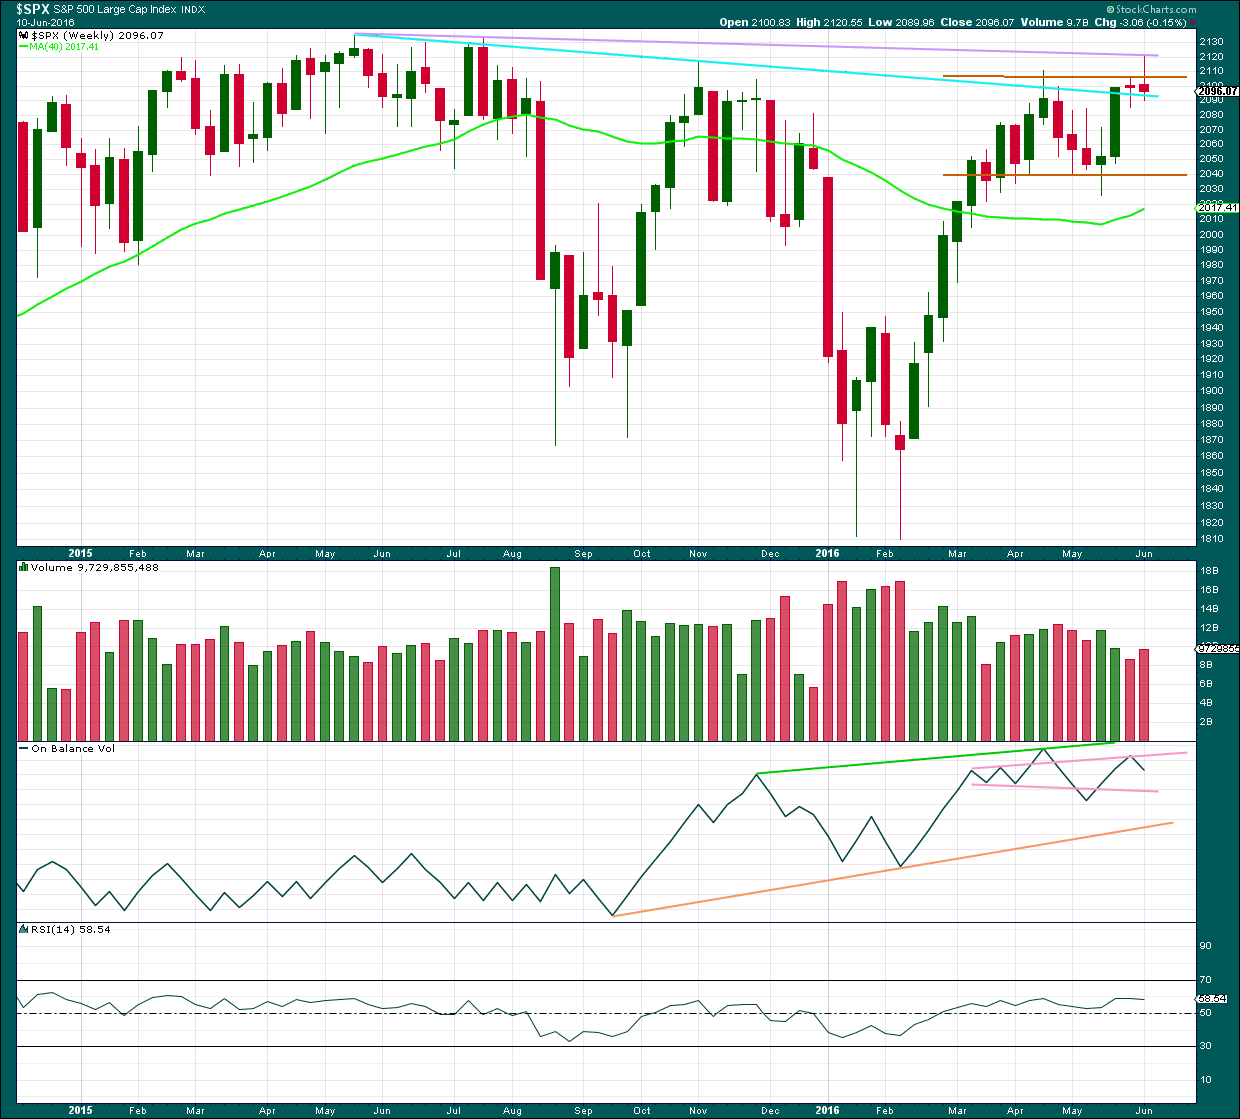
Price is the final determinator and the most important aspect of market analysis. So what has price been doing since the all time high in May 2015?
Price has made an important new high above the prior major high of November 2015. Price is now finding resistance at the lilac line. It can no longer be said that price is making lower highs and lower lows because it no longer has a lower high. This is the most bullish indication from price for many months. This supports the bull wave count over the bear.
Last week completes a shooting star candlestick, which is bearish but on its own not overly so. In this instance, because the upper wick of the shooting star is touching an important trend line, the strength of that line is reinforced and should hold if price again comes up to test it.
On Balance Volume this week gives a bearish signal with a move down and away from the upper pink trend line. There is bearish divergence between the last two highs and OBV: OBV could not make a corresponding new high while price this week made a new high above the prior high of 20th of April. This indicates weakness in upwards movement from price.
Volume is declining while price has essentially moved sideways for the last ten weeks in a zone delineated by brown trend lines. The longer price meanders sideways the closer a breakout will be. During this sideways range, it is a downwards week which has strongest volume suggesting a downwards breakout may be more likely. Last week price overshot the upper edge of this range, but could not break out as it closed back within the range completing a red candlestick.
There is some increase in volume for last week’s red candlestick indicating there was some support for the overall fall in price.
The 40 week moving average has turned upwards, another bullish signal. However, this has happened before in October 2015 yet it was followed by a strong downwards wave. On its own this bullish signal does not necessarily mean price is going to make new all time highs.
DAILY CHART
Click chart to enlarge. Chart courtesy of StockCharts.com.
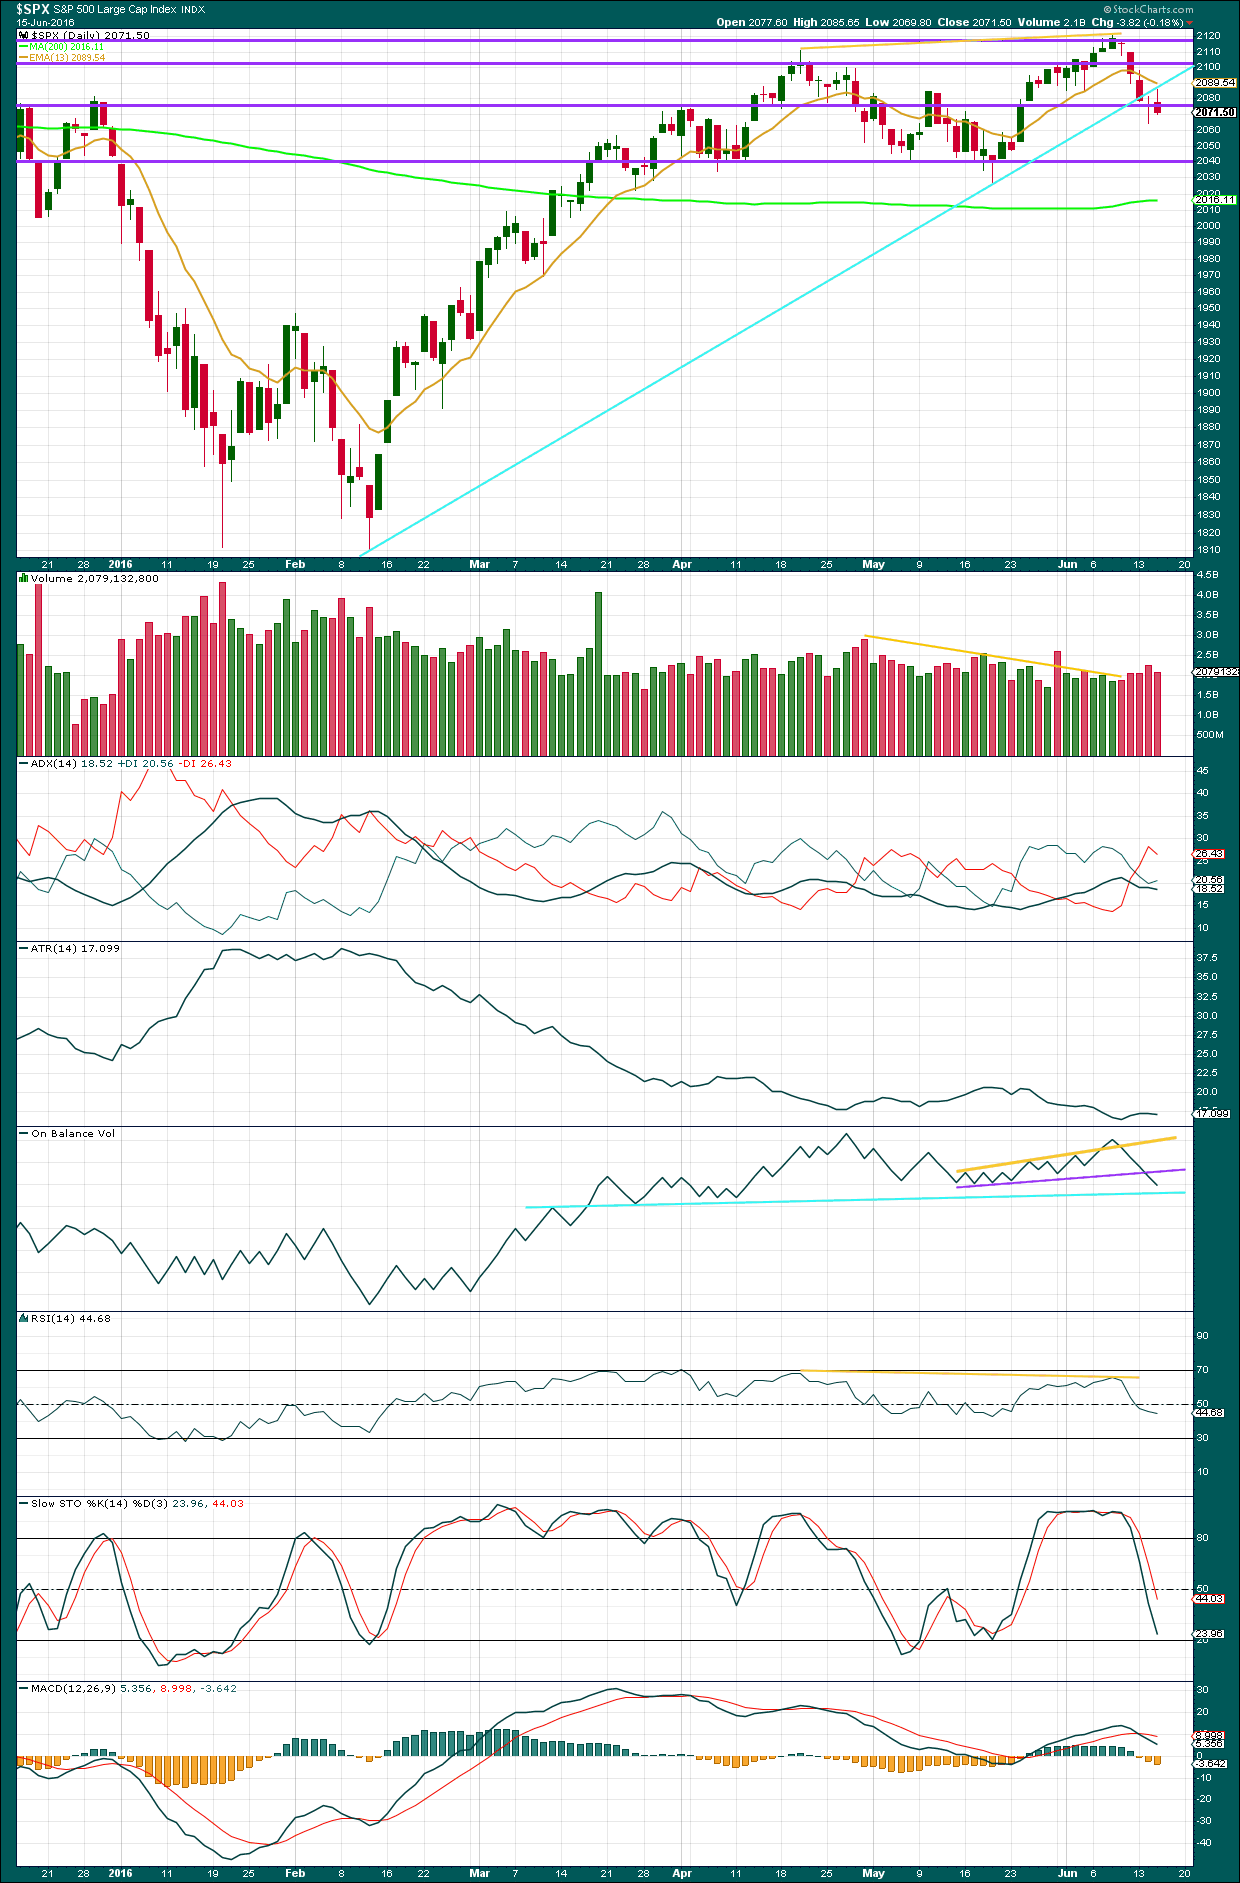
Volume data on StockCharts is different to that given from NYSE, the home of this index. Comments on volume will be based on NYSE volume data when it differs from StockCharts.
A red daily candlestick after the doji would normally not be confirmation of the reversal implications of the doji, but in this case today has a higher high and a higher low than the doji. The situation short term is unclear: price moved higher, which may support a reversal, but ended the session lower to complete a red candlestick which indicates the reversal may be over already. This is essentially the same situation as outlined by the two Elliott wave hourly counts.
Price is finding resistance at the cyan trend line and the 13 day moving average. The first bounce within a new trend does not always find support or resistance about the 13 day moving average. If tomorrow’s session closes higher above this average, then a further few days of corrective upwards movement may be expected.
Volume for today’s session was lighter than yesterday, but looking “inside” this daily candlestick shows overall more volume for downwards hours than upwards hours. This is indicated by On Balance Volume moving lower today. The fall in price at the end of the session had more support than the rise in price in the first hours. At the daily chart level, the decline in volume may be read as bullish short term supporting the main hourly Elliott wave count, but at the hourly chart level the volume profile looks bearish and would support the alternate hourly Elliott wave count.
Overall, volume for the session is still lighter than the prior downwards day; the bears were less active. Overall, it is my judgement that on balance short term this is bullish.
ADX today has flattened off indicating the market is not yet trending. ATR agrees as it too has flattened off today.
The cyan trend line has been redrawn on On Balance Volume. This may provide some support and halt a fall in price. The break below the purple line was a strong bearish signal from OBV.
RSI is still close to neutral. There is plenty of room for price to fall.
Stochastics is not oversold yet. There is plenty of room for price to fall.
MACD has offered a sell signal at the daily chart level with the shorter average crossing below the longer average.
VOLATILITY – INVERTED VIX MONTHLY CHART
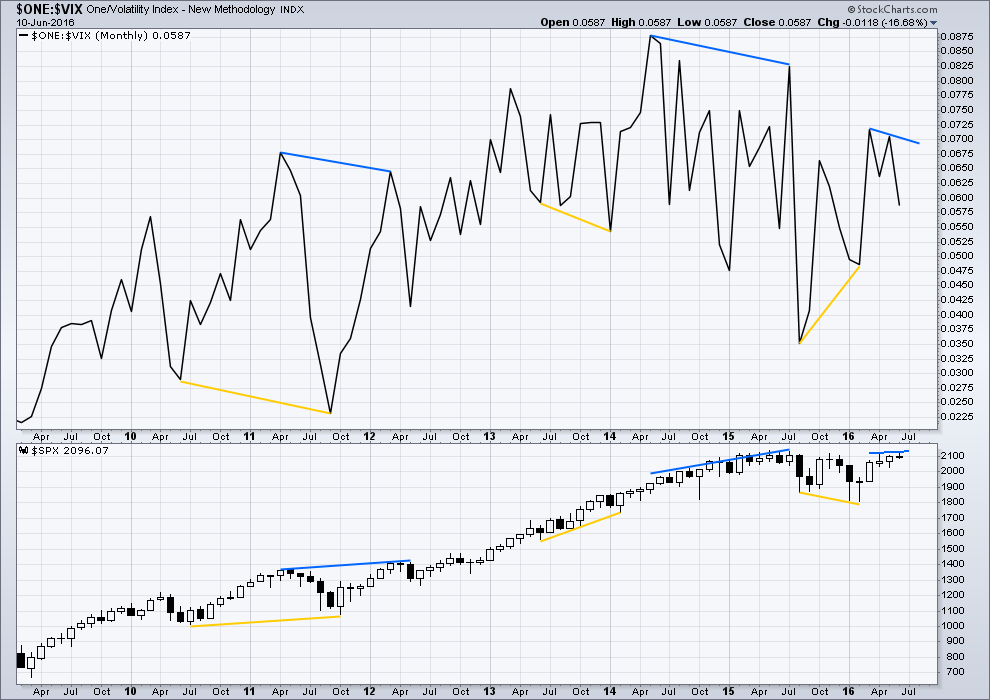
Click chart to enlarge. Chart courtesy of StockCharts.com.
Several instances of large divergence between price and VIX (inverted) are noted here. Blue is bearish divergence and yellow is bullish divergence (rather than red and green, for our colour blind members).
Volatility declines as inverted VIX rises, which is normal for a bull market. Volatility increases as inverted VIX declines, which is normal for a bear market. Each time there is strong multi month divergence between price and VIX, it was followed by a strong movement from price: bearish divergence was followed by a fall in price and bullish divergence was followed by a rise in price.
There is still current multi month divergence between price and VIX: from the high in April 2016 price has made new highs in the last few days but VIX has failed so far to follow with new highs. This regular bearish divergence still indicates weakness in price.
VOLATILITY – INVERTED VIX DAILY CHART
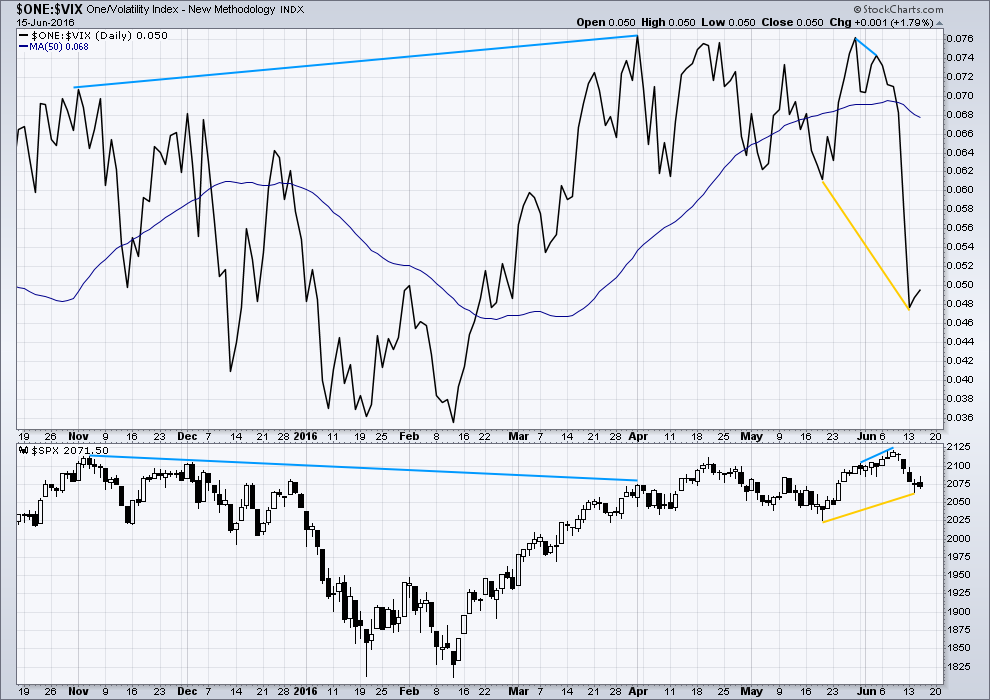
Click chart to enlarge. Chart courtesy of StockCharts.com.
There is now only one instance of hidden bearish divergence noted on this daily chart of price and VIX (blue lines). VIX makes higher highs as price makes lower highs. The decline in volatility is not matched by a corresponding rise in price. Price is weak.
There is also very short term regular bearish divergence (short blue lines). VIX did not make a corresponding new high as price made a new high. This indicates exhaustion for bulls and underlying weakness in price.
Price moved higher for three days in a row (6th, 7th and 8th of June) completing green daily candlesticks yet VIX moved lower. This short term divergence between price and VIX is unusual. It indicates further exhaustion from bulls. This trend in price is weak, especially for the last three days up to the last high.
VIX (inverted) has run away strongly from price. Volatility sharply increased beyond the prior point of 19th May (yellow lines) while price fell (yellow lines).
A divergence 101 interpretation of this is bullish. Volatility is stronger than it was on 19th of May, but this has not translated into a corresponding new low for price. Price is weak. Some upwards reaction would be a reasonable expectation about here to resolve this divergence. At this stage, it looks like that interpretation was correct as it has been followed by some upwards movement from price.
Volatility has declined for the last two days. Yesterday, this decline in volatility came with overall downwards movement from price creating short term divergence between price and VIX. Today, the decline in volatility comes with a red daily candlestick but one which made a higher high and a higher low. It looks like price today moved overall upwards for most of the session along with declining volatility. Price and VIX are mostly in agreement today. The decline in volatility today may be followed by more upwards movement short term. It is my interpretation (subject to change pending new information) that short term this supports the main Elliott wave count slightly.
While I would not give much weight to divergence between price and many oscillators, such as Stochastics, I will give weight to divergence between price and VIX. Analysis of the monthly chart for the last year and a half shows it to be fairly reliable.
BREADTH – ADVANCE DECLINE LINE
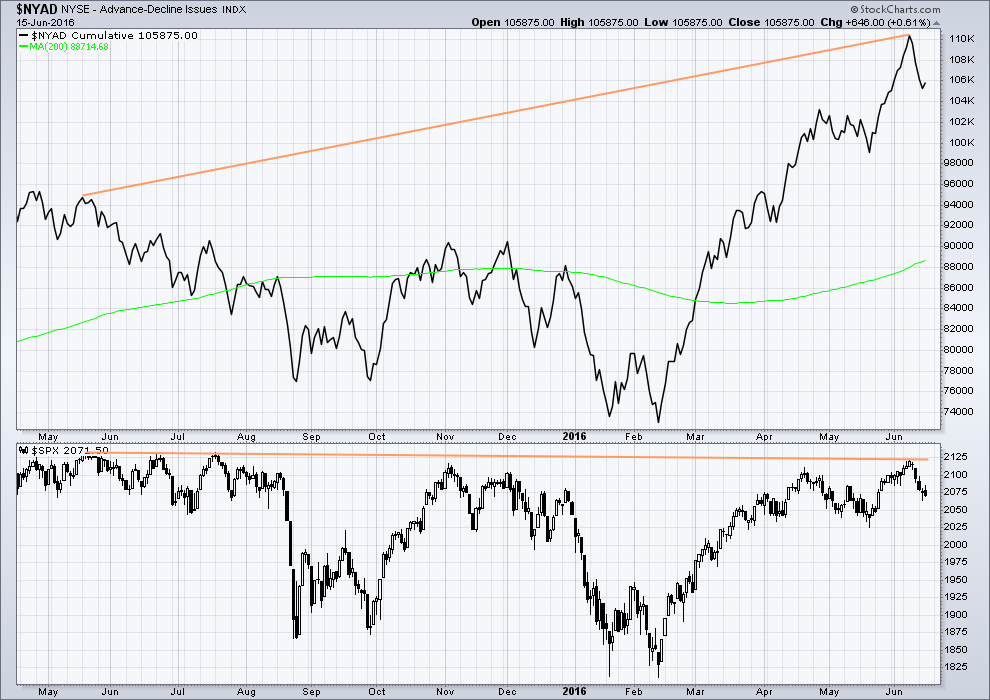
Click chart to enlarge. Chart courtesy of StockCharts.com.
With the AD line increasing, this indicates the number of advancing stocks exceeds the number of declining stocks. This indicates that there is breadth to prior upwards movement.
Taking a look at the bigger picture back to and including the all time high on May 2015, the AD line is making substantial new highs but price so far has not. While market breadth is increasing beyond the point it was at in May 2015, this has not translated (yet) into a corresponding rise in price. Price is weak. This is hidden bearish divergence.
For four sessions, price moved lower and the AD line has also moved lower. There is breadth to this downwards movement from price. There is currently no bullish divergence between price and the AD line.
Price today moved overall upwards with a higher high and a higher low from the prior session. The AD line also moved upwards. There was breadth to the overall rise in price for the session.
DOW THEORY
The last major lows within the bull market are noted below. Both the industrials and transportation indicies have closed below these price points on a daily closing basis; original Dow Theory has confirmed a bear market. By adding in the S&P500 and Nasdaq a modified Dow Theory has not confirmed a new bear market.
Within the new bear market, major highs are noted. For original Dow Theory to confirm the end of the current bear market and the start of a new bull market, the transportation index needs to confirm. It has not done so yet.
Major lows within the prior bull market:
DJIA: 15,855.12 (15th October, 2014) – closed below on 25th August, 2015.
DJT: 7,700.49 (12th October, 2014) – closed below on 24th August, 2015.
S&P500: 1,821.61 (15th October, 2014) – has not closed below this point yet.
Nasdaq: 4,117.84 (15th October, 2014) – has not closed below this point yet.
Major highs within the new bear market:
DJIA: 17,977.85 (4th November, 2015) – closed above on 18th April, 2016.
DJT: 8,358.20 (20th November, 2015) – has not closed above this point yet.
S&P500: 2,116.48 (3rd Nobember, 2015) – has now closed above this point on 8th June, 2016.
Nasdaq: 5,176.77 (2nd December, 2015) – has not closed above this point yet.
It is a reasonable conclusion that the indices are currently in a bear market. The trend remains the same until proven otherwise. Dow Theory is one of the oldest and simplest of all technical analysis methods. It is often accused of being late because it requires huge price movements to confirm a change from bull to bear. In this instance, it is interesting that so many analysts remain bullish while Dow Theory has confirmed a bear market. It is my personal opinion that Dow Theory should not be accused of being late as it seems to be ignored when it does not give the conclusion so many analysts want to see.
This analysis is published @ 06:58 p.m. EST.
An old bond trader taught me this years ago, and some of you may already know this, but when a market closes down for 5 days in a row (or conversely up) watch out because a great deal more in the same price direction is coming….we had 5 days closing lower in the SPX, DAX and INDU.
FYI all….
Now that the session is closed I’ve checked today’s candlestick. The lower shadow is < 2X the length of the real body. This is not a hammer candlestick. It is however still bullish because it's green and has a long lower wick.
Lara,
Can the wave count be seen as minor 1 being done at the lows of today?
That would mean minute iii of minor 1 being were subminutte iii for minute v of the current main count. The bounce from there being minute iv, and then minute v down from there… that would give minute iii the longest and deepest move in minor 1.
Just curious…
BTW I’m the 200th post for today. But don’t worry, I’m not going postal 🙂
Yes. I will have three hourly wave counts today. This will be my third.
UVXY weekly trend…beauty is in the eyes of the beholder…
https://twitter.com/hmeisler/status/743554657281183744
“Holy smokes. Put/call ratio on the VIX 122%. Awful lot of folks betting on a lower vix.”
When the put call ratio is high, it actually means people are bearish, and expecting a higher VIX, not the other way around as tweet suggests… 🙂
A big up day tomorrow to get close to SPX 2100 will be a perfect set up for the end of minor 2. With next week’s Brexit vote, I can see the whole week being minor 3 🙂
Vote might well be delayed now – Remain MP shot today unfortunately died.
Social mood is def doing its thing – and the market has hardly dropped yet.
Todays rally in Sterling (and possibly markets) being attributed to probability of a delay – very strange (and sad) indeed.
Sounds to me like a false flag. Where and how does a mentally ill individual get his hands on a pistol in a country where ownership of firearms is prohibited, and strictly enforced? What a tragedy!
Yeah – that thought has seriously passed thru my mind also. It seems absolutely nothing is as it seems anymore.
Agree, they will have to revisit vote in light of the unfortunate event that unfolded today.
OMG. I just read the story after reading your post. That is truly sad indeed. Apparently the pistol he used was home made. But the killer also stabbed her… Very heart breaking…
After due consideration, I will be re-loading at 2085.50 and above . Have a great evening all!
Vern,
Is there any way I can change your mind to wait till post 2,093… Just kidding as it is very fluid environment so each one of us must adopt to survive 🙂
That target is by no means absolute, nor would action take place in a vacuum. I would definitely again want to see some clear divergence with volatility before I began to ladder back into short positions. Ahead of a third wave down at this degree you can be very certain that smart money is going to start getting positioned early. There should also be signs of distribution at the minor two top in the form of high volume with stalled price movement. If those things are noticeably absent I think it would warrant some caution about going gung-ho short…
We are of course assuming DJI is not down several hundred points overnight! 🙂
I just closed all my short positions and will look for a better entry next week when Minor 2 completes.
I have kept my UVXY bull put spread open. Depending on what happens tomorrow, I may add a bearish call spread out a week or two to balance the long position. It would be nice to be already positioned with calls after buying back the short side at the end of this potential multi-day run higher. Jeez! What a crazy day! Get a good night’s rest warriors! ‘Bye!
You said it. I should have liquidated at least half at today’s high for UVXY. But I was looking for Minor 3 to have started. I let myself be swayed and should have trusted Lara’s main hourly bear count more than I did. Pigs get slaughtered. Oink.
The SPX daily hammer and the VIX signal to buy SPX convinced me we are gong back to 2100 for another test. I am not riding it up again.
You really do have to pay attention to what the market does, as opposed to what you expect it to do. Those two have been very reliable in my own trading and I ignore them at my own peril. Trying not to repeat my past mistakes…
Rodney,
In my view the manipulators will not allow for a clean and clear signs of wave completion. This is going to be too simple and easy for majority, I suspect they will continue running flats until TA folks give up and the position suits them.
It has been remarkably effective in misleading traders even when they are expecting it. I think we are going go continue to see them in spades as they try to control the descent and keep traders guessing, timid and on the defensive. At some point they will loose control; not a matter of if, just when…!
One initial sign will be increasingly violent whipsaws over larger and larger ranges like the thousand point drop we saw in DJI last August…the shape of things to come methinks…
My advice for less experienced members here:
Hold on. Patience here may be well rewarded. If your shorts are underwater then stops must remain just above 2,120.55.
If you’re waiting for an entry todays green daily hammer candlestick is a strong warning of higher prices in coming days, be patient.
If your shorts are positive and entered above 2,100 then reduce or eliminate risk by moving stops to at or just below break even. This advice is intended for position traders, not day traders. And I’m giving it because this is how I prefer to trade. I hate being in and out. I want a good position that I can hold for the majority of a trend. Cut losses short, let profits run. You can’t let your profits run if you keep closing a good position.
However.. bear market rallies can be fast and deep. Which is why any shorts entered below 2,100 may be underwater in a few days.
I hope that all makes sense!
This advice is not intended for the very experienced members here who have their own style, nor anyone gutsy enough to trade highly volatile highly leveraged (read: damn dangerous) instruments like UVXY.
You mean like VERNECARTY? (gotta love the guy)
Hey! What about Olga?! She trades that beast too you know! And quite effectively I might add… 🙂
She’s a proper lady.
😉
Yep. Like Verne and Olga. Who should ignore my trading advice with the exception of risk management, which applies to everyone.
But then, one reason why they’re so good is they know how important risk management is 🙂
Nothing is more important.
It is also a good idea to get a level of trading privilege in your account that allows credit spreads and learn how to trade them. It is a dirty little secret, and I know not everyone trades options, that you make more profitable trades in the market SELLING, than you do buying. It’s nice to use your broker’s money whenever you can. (not for margin!)
Just think of it, even those not trading options right now are still SELLING, the market short, or at least hoping to…! 🙂
If they open 70 points higher on DJIA tomorrow, new shorts are going to run for cover and fuel the climb past 2,100. I think with the drop below 2,055 a lot of new shorts jumped on board. Unless, the future drop triple digits, market is not going to give a lot of opportunities to jump into short position during the trading day.
It is not uncommon at critical inflection points in the market for things to be ambiguous. Ordinarily the VIX signals today would call for backing up the truck for a load of puts and walking away. Considering all the other bearish portents, I will continue to trade what I actually see, and that may mean remaining firmly ensconced in scalper’s mode…never underestimate the banksters!
Overnight futures ought to be most interesting!
I don’t think there are many new shorts…. The move down was too calm & controlled.
Certainly their were many BTFDers! On the way up off the lows of this morning.
Anyway… this tease is getting frustrating.
If they are going to jack futures believe me it won’t be a measly 70 DJI points. If the aim is to dislodge any tenacious bears it will be a couple hundred at least. If the banksters do it would make for a great scalping trade at the open as I think it would be the ultimate fade….
An extreme amount of Bulls here to 2120.55…. Very few Bears played this down.
Remember, they all were Giddy expecting NH’s just last week! That mob feeling doesn’t swing that fast.
BTW: Volume today LOWER than yesterday!
Bingo! 🙂
Vern,
I hope you are right cause I had picked some OEX long positions and those might just work out with the anticipated ramp higher. Quick and nimble is the only way to survive these markets.
That will be my approach. You guys taking overnight positions are braver than I. My expectation is that THE break-down, when it comes, will start in China and get reflected in our futures market. I would not be long in this market overnight if I were given 100 to one odds…No Sir-ee! 😀
Triple Witching tomorrow… MMs are ready to inflect maximum pain on investors unwinding positions. Count on some crazy volume and price action, probably starting with a huge gap up open.
With VIX closing below yesterday’s close and the second day inside the upper Bolinger Band, we have a strong bullish buy signal.
Yep! It is what it is.
The SPX hammer a bit of a cautionary note today, as well as the long upper wick in VIX extending once again beyond the upper BB…price action always trumps our expectations…
I am again cashing in hedges at the close for a quick double in SPY 207.5 calls. I don’t trust this market for one second…
Vern,
Just closed my short on UVXY from this morning, now waiting for markets to settle over the coming days. I am very uncomfortable holding UVXY long term, have been playing safe and locking the profits on every oppourtunity.
It is amazing. I also just closed out another double on a UVXY short I put (14 puts) on one hour ago. This is one crazy market!
That is the only way to handle that animal. Scalp or die! 🙂
who the heck is buying this market? PPT with all their paper money they can print?
and they have lots and lots of the fiat money…
And never experience a margin call.
believe the computer quants kicked in and they are the ones buying
Possible ending diagonal?
The current main hourly bear count target for c or y of Minor 2 is 2102 per Lara below. That would be a 78% retracement of Minor 1. That is deep like a 2nd wave should be especially the first of the second waves from a trend change.
So, batten down the hatches and watch it rise. I am hopeful that Minor 2 completes just above 2086.
minimum expectation a new high above the end of minute a at 2,083.90 to avoid a truncation and a very rare running flat
but as someone else has just mentioned, price remains within the base channel on the hourly alternate
while it finds resistance at that trend line minor 2 could certainly be over as per the alternate…. looks like this session will see it end there
a green daily hammer candlestick should be taken VERY seriously
ignoring these before has led to Bad Things Happening for us.
No Kidding! I really love the fact that we experience accretive learning around here. Did you guys notice how quickly Rodney jumped on that hammer and long upper VIX wick out side the upper BB? We’ve certainly been there and done that! 🙂
Lara,
I for one have started to pay more attention to rare alternatives and count cause every time we think we have it nailed, the low or very low probability comes into play.
I think the real damage has to be done by some significant event outside of market as those are not under central banks control (Atleast without initial first hit).
If still in minor w(1)… This idea would really have everyone looking down when the low of today gets taken out… Only to watch w(2) zoom right by to the upside.
He! He! Boy wouldn’t that be funny. You really do have an edgy sense of humor Gary, but that would be just like Mr. Market won’t it? Talk about lots of traders caught lookin’!
I have to say this did not at all behave like a typical fourth wave but anything is possible I suppose. For the last several months impulses down have mostly been completing intra-day, and I think the pattern continues.
Volatility divergence now resolved. Grabbed a couple SPY 207.5 calls to ride C up.
This bankster driven market makes it tough for traders to let winners run. The smart approach is to continue to scalp the moves or profits quickly evaporate, or worse, winning trades become loosing ones. Of course position traders are less concerned about whipsaw days like today but it can still be harrowing… 🙂
i picked up some 208 calls (next week expiry)
I’m still a little suspicious – this move up still hasn’t broken out of its base channel (the 3rd wave – if that’s what it was – popped it’s head above but then fell back in).
Next move down should be telling. Move above 2085.63 (ish) invalidates the suspicion
This could be a double zig zag from the lows today.
This persistent divergence with VIX could be the harbinger of a bull trap. Something about the price action today just a bit dicey…it would be too ironic just ahead of a big third down. I really would like to see UVXY close that gap from this morning to confirm more upward movement for a second wave and it just a’int happening…at least not so far…perhaps by the close…? 🙁
Agreed – UVXY is def telling us this move up is corrective atm. The power of that wave (b) down on my chart is also bugging me – could well have been the real deal (Start of Minor 3).
If we go above 2086 we have the answer. I’ve just added to my shorts just in case. Plenty of dry powder if we go higher. This move up might be a double zig zag if we get another pop higher now.
The move off todays lows now looks like a 7 wave move (corrective – double zz??).
Want to see 2064 taken out for any confidence.
Double zig zag?
Possibly yeah
Good morning everybody
I see the gap is now closed? I have it at 2,071.50 – 2,066.36, and this last hourly candlestick has a high of 2,073.79.
I’m also noticing divergence with todays low and the last low, end of minor 1, with price and MACD on the hourly chart. So this move down has weaker momentum.
This is longer than the common range for a B wave, but still within allowable limits. It looks like a B wave to me.
It’s a 1.64 length of the A wave.
Target would be 2,102 for C = 2.618 X A
Why do you use 2.618?
Due to depth of B – 1.618 target would be truncated I think (2082 if I calc’d properly ??)
I was guessing something like that. But I wanted to make certain. Thanks Olga.
What Olga said 🙂
As Olga commented, the power of the expanded w(b) is suspicious. If we are in minor w(2) that powerful b wave just might prevent w2 from getting very high. As Lara has said, “surprises to the downside”
I’m just not seeing the power. Which indicators are you guys using that gives that conclusion? On which time frame?
MACD on both mine and especially Garys chart below. Mine is 1min chart but I think it is same on 5 min
Okay, I see it. On the 5 min chart this low has stronger momentum than the last low.
So, a conundrum.
Which time frame to look at to judge strength of this move?
I’d rather use the hourly, but I don’t think the 5 min can be ignored. My approach would ignore it and I don’t think that’s right.
UVXY was telling me to be suspicious (divergence) but it seems to have come back in line now so I’m on the fence atm 🙂
I generally judge the longer time frame to be have more power (influence on price). So the + divergence on the hourly MACD trumps the momentum seen at the 5 minute MACD. The daily hammer trumps hourly signals etc.
I am not so sure this is the best way to evaluate. But it how I do it as of now when a conundrum (mixed signals) develop.
Thus, you main bear hourly count is right on.
For candlestick patterns, absolutely.
Still thinking through how MACD works here….
I’m thinking that the lower time frames “look inside” what’s happening at the hourly. That move down today was stronger than the prior moves, but because it was so quickly reversed on the hourly time frame the MACD reading is pulled up…
Anyway, price is marching up right now. So I think minor 2 continuing is still my main wave count ATM
Lara, I’m looking at a 3 min chart and the MACD movement was greater than any other wave in this entire wave structure down from high on June 8.
Thanks Gary. I did figure that out eventually 🙂
Are seeing action on NUGT?
Looks like time for a correction in GLD…
showing 2076.73 target, will short more there
Peter,
Only going to short closer to 2,100 as too much cash being pumped and I don’t want stuck underwater as I am not a good diver .. If 2,077 gets taken out , tomorrow morning will panic the Bears.
i’m up somewhere around 42 basis points cash in the bank on my e-minis….different strategy where I don’t mind having a large stop loss in order to catch Minor 3 down (when ever that comes). I’ll keep adding shorts in fact.
Pretty bad when they can bring market down from 150 points to positive 100. What are you using the short e-minis?
yep, Sept. shorts at various points; disclosing SPX could go up to 2114 and then I would be at breakeven….so not worried how high Minor 2 up goes.
76.4 retrace?
Yup
I was just posting same Olga, the expanded b wave looks very powerful but this is my main count ATM
This is still my fav count atm – but there are other options on the table as pointed out by Gary and others
I was just posting same Olga, the expanded b wave looks very powerful but this is my main count ATM
Yeah – the power of that (b) is what concerns me most about that count. Certainly nothing suspicious about that move down.
That will probably be my main wave count today too.
it just retraced 62% from yesterday’s high to today’s lows.
Looks to me like a 5 up off todays lows on the 5 min chart. Perhaps this is a or w of Minor 2. If so, there should be a nice entry point to initiate/add to a short position in the next few days.
Back to a hammer on the daily SPX. But now it is green. Quite bullish unless it changes by the close. Darn it.
The more this goes sideways…at least on the 5 minute chart, the more nervous this bear becomes. I had a HUGE profit, but this bear decided to become a pig today…oink oink.
This is getting interesting – if we take out 2056 now then there is a very good chance we are in Minor 3 now imho.
Taking out 2063.34 (ish) might be first clue but would not be conclusive.
Could be w(b) of minute w(iv), but if 2050.37 is taken out I totally agree.
Yep – I’m just suspicious of the proportions, but def keeping an eye on all options
I agree Olga, proportions are suspect but the MACD is better. I really want to be wrong here as I’m short from above.
Sorry folks to keep suggesting the series 1, 2’s for this minute wave down, but I don’t think we have completed minor w(1) yet…. Down wave so far just doesn’t appear strong enough to be in minor three down. If this is correct we should see minute w(iii) finish somewhere in the area of minuette w(iv).
Correction minute w(iv) should end in area of minuette w(iv)… Not minute w(iii), excuse me.
We figured that’s what you meant!
As they say, a picture is worth… 🙂
I agree. I think we do need one more move down to complete the current impulse ahead of the second wave correction…
And we are already in the area of minuette wave (iv) albeit the lower section of minuette wave (iv).
Hammer now morphing into dragon-fly. Now I REALLY would rest easy if we take out 2050, AND 2040 on the next leg down…
Powerfully conflicting signals. On the one hand we have a hammer candle in SPX.
On the other, no capitulation moves in VIX or UVXY to signal an interim bottom
Both hanging tough on open gaps so far.
Long upper wick on VIX could be bullish signal as well.
thinks the top is in, but can’t rule out a spike to 2076 yet
going short here
I guess the globalists have decided that one way to derail the Brexit vote is to start a war. Nato has apparently announced it now has grounds to initiate a war with Russia. You cannot make this stuff up….
It will be interesting to see just how gullible the Brits are…and whether they fall for the propaganda…Brussels must really be getting desperate…
This move up starting to look suspicious ; not being confirmed by VIX….
I need clarification. By “this move up” looking suspicious, are you speaking of UVXY? And regarding “VIX confirmation”, what is the criteria you are using.
The SPX hammer has been recently confirming trend reversals lasting days if not weeks and we have one again so far today. VIX and UVXY should be in the red if we were seeing a genuine trend reversal at this point….they are not so far so that is why the SPX move up is imo suspicious…
I am still holding by UVXY bullish put spread…we could head back South if VIX stays in the green. This is very bearish divergence with volatility…
Any reversal would be a waterfall….!
This can’t be good for Brexit poll
“British woman MP shot, stabbed; in critical condition
LONDON: A 41-year-old British woman MP from the opposition Labour Party was left fighting for her life on Thursday after being shot and stabbed in her constituency in northern England, a week before the crucial referendum on UK’s EU membership.
Jo Cox, Labour MP for Batley and Spen, was left bleeding on the floor by her attacker. A man also suffered slight injuries, the BBC quoted eyewitnesses as saying.
A 52-year-old man was arrested near Market Street, Birstall, West Yorkshire Police said. The MP holds a weekly meeting with constituents nearby.
Cox’s assistant confirmed that the pro-EU MP had been attacked. Cox has been campaigning for Britain to remain in the European Union ahead of the country’s June 23 referendum. “
15min
the 2063.26 appears to be the top of the little a. b-c yet, then v down of Minor 1 down…is going to take some time.
Breakout and normal retracement???
The trend line needs to hold.
FWIW, AAPL is approaching a very important support level and expecting it to bounce off that and take markets up along for a ride. Be careful on short positions folks.
3 of 3 of 3 coming up here by my count…..small zz w2 just completed? minuette degree I think.
Could be wishful thinking on my part….lol
with ya…nothing bullish about the SPX charts I am looking at!
10 year and 30 year yields at new 52 week lows….
Fully loaded now…
Would love to see this break down within next 30 minutes.
FWIW, on the up side, I am watching following levels very carefully with respect to the intensity of move past them
1. 2,066.9
2. 2,077.2
3. 2,085 (minor)
4. 2,093.7
5. 2,105.5
If the options expiration move is done (triple witching this Friday’s option expiration), we should see the upward resolution quickly.
Here is a cheap lesson, at my expense. I bought 3x inverse ETF’s wanting the market to do down. Entered at various places, mainly though at SPX 2099.60 awhile back. Covered the SDOW position this morning around SPX 2055…..a 44 basis point drop – and I made $11.24. It was a large position too. Reason why I stick to futures mainly, either up or down, no time decay to gettcha. Other ETF’s are at breakeven to negative with same setup. In my opinion UVXY is even more difficult to trade.
Yep. No question about that. Speaking of which, this morning’s gap should be filled ahead of a minor two up…still open so far so I may have bailed a tad early. I thought we would make one more low but that candlestick still looking very much like it will remain a hammer…glad I at least I held on to the spread…
Same here. My relative entry was 2077 back in April / May. I am still under water. I am looking for one more move down today to get out of at least half if not all. This past week has made a huge difference. Could even turn profitable today. I hope more than $12 though.
I like to play longer term SDS calls. Comfortably up 7% today on the move down. January 2017 $18 calls. Do the same on VIX. Intraday I’ll do some UVXY, but usually calls that expire a month out.
If minor two up starting we should get some green today…
Exiting short-term short positions with a slight loss on last trade. These hammers have to be taken very seriously and it looks like we have an interim bottom.
We *might* still have one lower low to go – move up from todays lows might be a 5 wave C wave to complete a small degree W4. If next wave down is a 3 then that view is invalidated.
That small final pop lower to todays low looks like a 3 with almost equal A& C waves but could also be counted as a 5 on 1min chart imo.
Move from todays 2063 high now made a small degree 5 down – so we’re possibly either carving out an impulse down to a new lower low or a zig zag which stays above todays low then shoots higher.
If proves to be 3 waves I’ll take some more profits with a view to reloading at a lower price.
UVXY not filling that open gap so it looks like we do indeed have some more downside. I have learned not to ignore these SPX hammers as the last few months they have almost always meant an interim bottom. Still waiting to see that UVXY 14.73 gap filled to confirm reversal…if it climbs back above 17 I think that would negate the hammer…
covered futures’ shorts, too much to leave on the table
Wish I was in your position… but I need 1920ish to breakeven. With all this price erosion in SDOW and time lapse on all my leap option positions.
Will get there eventually and then I will be much more active.
Oink… Oink…
Oh I’m with you, I’m just at breakeven now on my ETF shorts; underwater even on some. In SDOW, SPXS and EDZ. Planning to cover this morning for a breakeven or so, then short again in a bounce up to whatever target, 2093 or so. Playing the trumpet on the wins, the harmonic blues on my ETF’s.
Smart. I think we have one more move down before the pause that refreshes…! 🙂
It continues…
30 Year Treasury now at a Yield of 2.344%.
The Lowest 30 Year Yield on Record is 2.25% on 2-2-2015.
on record for ever? history of the instrument?
Yes
UVXY going higher…reloading a few 17 strike calls…filled at 0.91. Target, just at about 18.00…
I’m seeing this down differently to be honest, in wave v of Minor 1. Maybe 2046 as the end of it today, 2040ish another end target. Minor 1 not over yet; Minor 2 yet to go.
Yep – that’s one of the 3 alternates I’m looking at atm. Only difference would be a 3 wave move up from here to maybe a slightly lower target rather than a 5 up to 2099.
Either scenario would play into my hands – I’ll discard one of those options @ 2042.
Olga
I am seeing 2093.9 as the target based on the development from this morning.
Yep – I don’t think this down move is quite finished – if so would be slightly lower for that count (61.8fib).
Currently seeing 3min RSI div – next bounce should (hopefully) show Mr M’s hand.
Lightened up short a bit more – will put back on below 2042.
Vern & Olga,
My concern is the expiration of 1 trillion SPY options this week per the article on Zerohedge where JPM Quant Guru was quoted as saying that the heightened volatility is as a result of that event. Also, tomorrow is triple witching so volume numbers will be out of whack.
If it bounces hard at 2040 you’ve got my vote….
Lara has often stated that SPX often behaves like a commodity where the 5th waves extend.
Wave 2 now of minor 3?
EDIT: maybe not yet.
Don’t recall ever seeing this many 1, 2’s in my trading career (29 years this August!). DAX daily chart. Adding most indicators don’t work when you get to the panic stage, wicked ups and downs too of course.
SPX 2040 very important. It is the signature feature of third waves that they demolish round number and support pivots like a hot knife through butta! Let’s see just how hot this knife is…. 🙂
Maybe someone should wake up Lara?
Smack down!
If, and that is a big if, we are in Minor 3, it only a matter of time before 2025 is taken out.
Good ole momentum is really strong on this move. Classic 3rd wave characteristics here….IMHO.
Verne- This is a “gap and gone” move.
Nice call yesterday!
Thanks for the EW count yesterday Tom. That really helped me in my decision.
Yet it is so calm… no one is paying attention to it. Yet!
yes, very calm so far. Rome has just started to burn.
Very good analogy!
But on the hourly chart, momentum as measured by MACD, is still less than Minor 1.
Lara has said… things pick up steam in the middle of 3’s. So we are not anywhere in the middle of 3 yet.
Understand, but this is just the start of Minor 3. You won’t see that towards the middle of minor 3….IFF this is minor 3.
Personally, I’ll be adding to “full tilt” on the first real strong bounce I see on the 5 minute chart.
A 3 is a 3, no? If minor 3, this is a deep one so far and not in the middle of it yet. Too calm.
If UVXY 14.77 closing gap from yesterday holds I am reloading…and then some…. 🙂
I think we are going to see the real one tomorrow… 🙂
Selling UVXY 14.50 calls into strength for another quick double. Waiting for break of SPX 2040 to reload. Holding bull credit spread already up 25%…
Vern,
If UVXY makes a high above 16.75 (or 3 of Minor 1), would that suggest that Minor 2 is over and Minor 3 is underway?
Yep! Next cohort of short sellers in the 16.50 to 18.00 area so I will be looking for them to cave the next day or two at the latest…
I have a 16.76 print! Minor 3 down underway???
Make that 16.80
Well the wave from late yesterday starting at 2083.14 into this morning so far… is certainly impulsive.
Goldman Sachs is another canary. Not looking so good.
/ES broke into cloud. Next is to break to below cloud. Confirmed when blue line breaks through cloud and stays with three candles below cloud. As strong or stronger than 3 black horseman when that happens.
Please explain what that means? I don’t know much about or understand this indicator.
http://stockcharts.com/school/doku.php?id=chart_school:technical_indicators:ichimoku_cloud
Thanks for the link to more details.
Prices above the cloud bullish sentiment, prices below bearish sentiment. The two lines that make up the cloud are support/resistances depending on which side the price is on. Between the cloud is a bull vs. bear fight. When prices solidly break through the cloud one way or the other you tend to get a bit of a rally, I guess you can look at it as if breaking through the cloud you get your third wave., i.e. you get the most bang for the buck waiting for a break through the cloud or waiting for the third wave for EW. There’s more to it but that’s the general idea. Of course I never wait for the break through otherwise I would still be on the sidelines instead of short the S&P, DOW, etc. Too boring!
Took a look and created this chart (USD/JPY – White, SPX Green/Red Candles) after reading:
“Japan might be the ‘canary in the coal mine’ for the next stock market implosion” – Horseman Capitol is 103% Short!
P.S. This ratio is worse than the SPX/$GDOW ratio. Yikes.
http://www.businessinsider.com/to-finish-this-canary-in-the-coal-mine-for-global-stocks-is-singing-loudly-2016-6?&platform=bi-androidapp
Question to Mohamed A. El-Erian on CNBC JUST NOW…
Will Fed Funds ever get back to or above 5%? Answer, “NOT in my Life Time”
I like the man. He is completely asleep at the wheel on this one I am afraid and he really ought to know better…
He is a big NY Jets fan… So I have to support his view.
Verne, Olga, (and other VIX/UVXY experts…) I have to ask you this:
I opened a UVXY call option yesterday: the July 1, 16 strike. Paid 1.76 for it when UVXY was around 13.80. It closed much higher, and I kept it. I have a feeling Lara’s alternate is in play here (the Brexit will keep markets volatile), and that UVXY can easily hit 20 by tomorrow… I thought it would penetrate the upper BB for 2 days, and I’d close the position on day 2…
And right now UVXY is 16.00 before hours so my position is very profitable atm 🙂
How would you play this? Getting out at the right time is just as important as getting in at the right time…
Ari,
Vern is the resident expert but based on my personal activity lately I have been locking profits at every opportunity as in the past got burnt trying to hold for the big pay day on UVXY.
Great pick up Ari!
Verne will answer for himself. But he has said many times in the last two months or so, regarding UVXY “Take profits early and often. Take profits intraday.”
However, now that we are soon to enter Minor 3 of Intermediate 1 down, he may have different guidance.
It’s a difficult one imho whilst the wave count has various options as UVXY goes to extremes before the final wave is complete (so it could be higher now than it is at the bottom of Wave (b) of 2 – if indeed 2 is not already comlete) – personally I think the 2nd wave was much too short in duration and price but I could be totally wrong – that’s why I am still 50% short myself.
What about maybe rotating some of the profits into a less agressive instrument to manage risk whilst the count gets some clarity?
I only trade the actual shares so I do not know if the above would cause any other issues, and I almost soley use EW to determine my trades – maybe someone can see something I cannot through some other TA?
Apologies I cannot be more help 🙂 UVXY is not the easiest of animals to tame.
Take the money and run dude!
I will be exiting some 14.50 strike calls expiring tomorrow at the open.
You can always roll/reload! Just my two pence… 🙂
Ris, Rodney, Olga, Verne:
Thank you all very much for your advice… I sold at the open: can’t complain about a 69% profit 🙂
Olga, you’re so right. I can rotate into a lesser volatile instrument like SQQQ (I actually have a call option on that too that I’m keeping for now.)
And Verne, yes the market will always give you more opportunity to load up…
Thanks again folks, and as always I enjoy reading your posts…
BREXIT Article… an interesting read.
http://www.investorsinsight.com/blogs/forecasts_trends/archive/2016/06/15/quot-brexit-quot-should-they-stay-or-should-they-go.aspx
Here’s the real deal on Brexit. If they don’t rig the vote (yes, they are that thuggish and corrupt) the parliament will drag their feet if there is a successful leave vote. The vote itself means nothing without the legislation to enact it. It may take wholesale revolt by the British people to get the EU boot off their necks. Those leaches are not going to give up that gravy train without a brawl…I guarantee it! 🙂
VIX Point & Figure Chart – Bullish Price Objective 39.5 as of June 15, 2016
http://stockcharts.com/freecharts/pnf.php?c=%24VIX,PWTADANRBO%5BPA%5D%5BD%5D%5BF1!3!!!2!20]
Thanks for the link Philip. I was about to post that I thought the target was quite conservative when I noticed that it referred to VIX and not UVXY. It still probably is. The 53.29 high print at the end of intermediate one of primary one down should be eclipsed by intermediate one of primary three. The great irony of the current situation is that nobody, and I mean nobody believes we are at the onset of a primary third decline.
Yellen’s decision yesterday clinched it for me. While only the most gullible had any expectation that the FED would raise rates, the failure of the market to rocket higher was like a thunderclap. Oh they tried, believe me! I was watching the one minute chart after the announcement and there was a ferocious battle for half an hour with monster green candles as a result of massive cash dumps, and equally monster red candles as the bears came out in force and said –
“No you’re not!! Not this time!!”
About an hour before the close I knew this market was toast. It really was amazing to watch it play out in real time!
The jig’s up folk. It looks like minor two still not quite done but after that it’s off to the races.
Yellen has confirmed to the whole world how vapid and impotent the FED, as well as all central banksters, are.
They are done!
The one hope of maintaining any illusion of being in control was to at least signal a rate change in June, which could then be ceremoniously retracted later during the crisis.
They are completely out of bullets.
Interest rate decisions will now move to the bond vigilantes who are the smartest kids on the block. They know exactly what is going on, and Yellen, Kuroda, Draghi et. al are about to be dragged kicking and screaming from the illusory world of economic make-believe, to harsh economic reality – Mr. Market, and not they, are in charge. Rates are going up, and the bond market is going to implode. Be ready! Long TBT.
Good job Vern… I posted my rants on this topic already.
But just one thing… Be careful, I think you my be a bit early on TBT. There will 1st be a flight to safety and then.
This current move down in UST yields is NOT that safety trade IMO… its signaling the BIG R & D. The safety trade will be in conjunction with the initial big move down in stocks to near Bear target… 1595…1271
Averaging/Laddering into position. Leaps expiring 2017. I’ll wait ’em out! 🙂
I agree Joseph ! I believe the world , and soverin funds will rush to US treasuries for safety and yield . An Exit from the EU by Britain gives other EU countries a crack to open an exit .
Fred,
I think there is too much money riding to allow Britain to exit from EURO that easily…
Vern,
On fundamentals I agree with your thoughts but I don’t think a day will make or break the resolve of central bankers. I will be very careful if short as the market is short term oversold and more shorts that come to play will be food for the ramp higher. 2,057-2,059 is the line in sand for me for the ramp to start.
I completely agree Ris. I do not think the banksters have completely loss control so I am still scalping. As I have said several times before, it will show up in the futures market when all hell is about to break loose. Until then I am keeping my trades scalpel sharp…appreciate the perspective…
What is TBT? Throw back Thursday???
Did you notice the hammer candle on the VIX daily. If it closes outside / above its BB, then the SPX buy signal is gone.
The longest candles on the SPX (all time frames) are all red. This is an indication that the trend is down. It also indicates that yesterday’s move up was corrective.
Minor 2 might have completed. I was again caught off guard by the completion of Minor 1. Lara’s wave count changed day before yesterday to indicate Minor 1 was complete. This is the second time in about a month this has happened.
Surprises are to the downside.
Shakespeare has arisen!
Maybe I’m just looking for confirmation bias, but it feels like things might get unhinged. I believe if we get under the 200 dma, the only support left is 1820 or so. Today proved that bounces should be SOLD.
It’s interesting you mentioned the 200 dma. I saw how Nasdaq bounced off its 200 dma in Tuesday’s session. And I had a feeling it will cut through it soon (maybe tomorrow if futures are telling). SPX still has a way to its 200 dma, but for me Nasdaq seems to lead. It usually goes higher faster in uptrend, and lower faster in downtrend. So SPX will soon likely to follow down to its 200 dma.
Interesting how with all this anxiety and uncertainty in world markets, SPX still has not closed down 1% in about 28 sessions now. That day feels like it’s very close indeed…
turd again
second, again..
First today 🙂
And I was last on the previous post. Ha!