
A bounce was again expected for Tuesday but did not happen.
Summary: The trend is down; look out for surprises to the downside. There is now enough technical indication of a trend change for a short position to be entered. Corrections are an opportunity to join the trend. In the short term, a small multi day bounce may begin tomorrow or in a few days time. It should find strong resistance at the lower edge of the black channel on the daily chart, and at the cyan trend line.
Trading advice (not intended for more experienced members): Short positions entered above 2,100 should at least have stops moved to break even if not a little below. Position traders holding short positions opened reasonably above 2,100 may like to hold onto those; 2,100 should offer strong resistance now for any bounce.
Looking at the bigger picture, any short positions entered here should be profitable within a week and may still offer a very good risk / reward set up. However, any members entering short here must understand there is a risk the position may be underwater for several days before becoming profitable. With that in mind, it is essential to manage risk: no more than 2-3% of equity should be risked if entering short here.
Choosing to be patient and wait may offer a better entry but runs the risk of missing a strong downwards movement. On balance, it is my judgement that price will bounce up for a reaction to test the trend line, so I will not be adding to my short position until that happens. If I did not yet have a short position, I may choose to enter a small position here and wait for a bounce to enter another slightly larger position at the high.
Stops (and risk) must be just above 2,120.55
Last published monthly charts are here.
New updates to this analysis are in bold.
BEAR ELLIOTT WAVE COUNT
WEEKLY CHART
Click chart to enlarge.
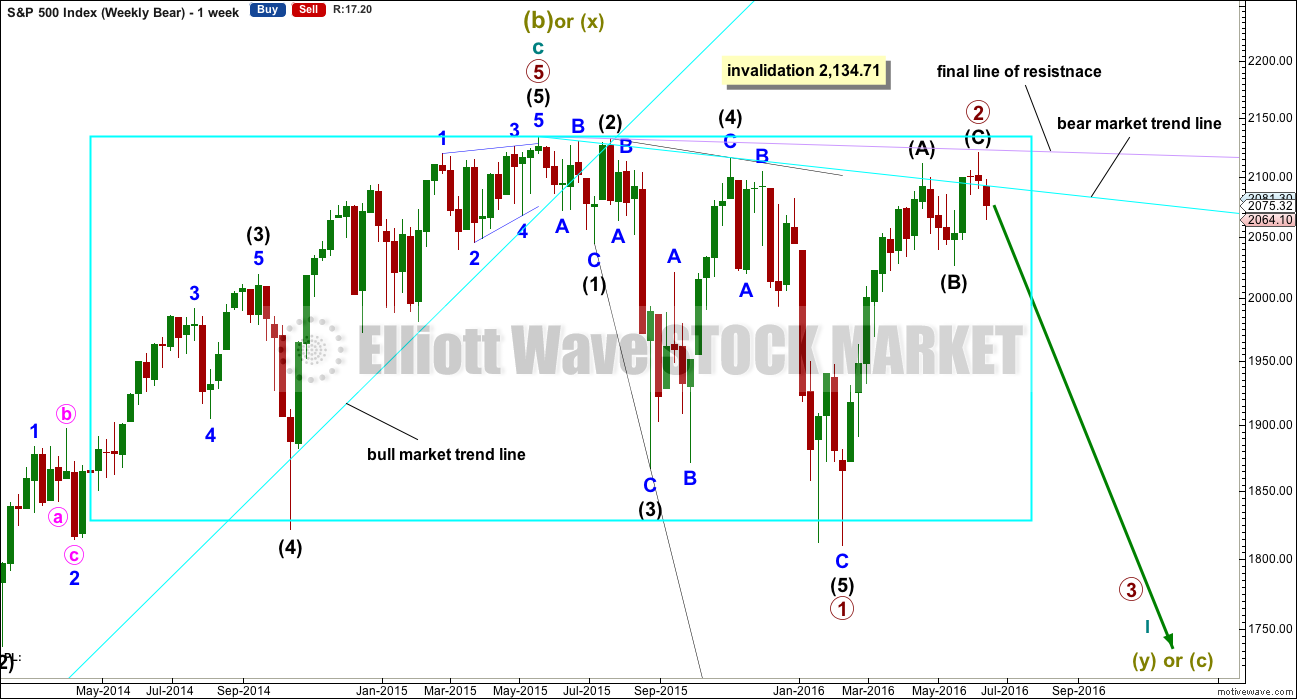
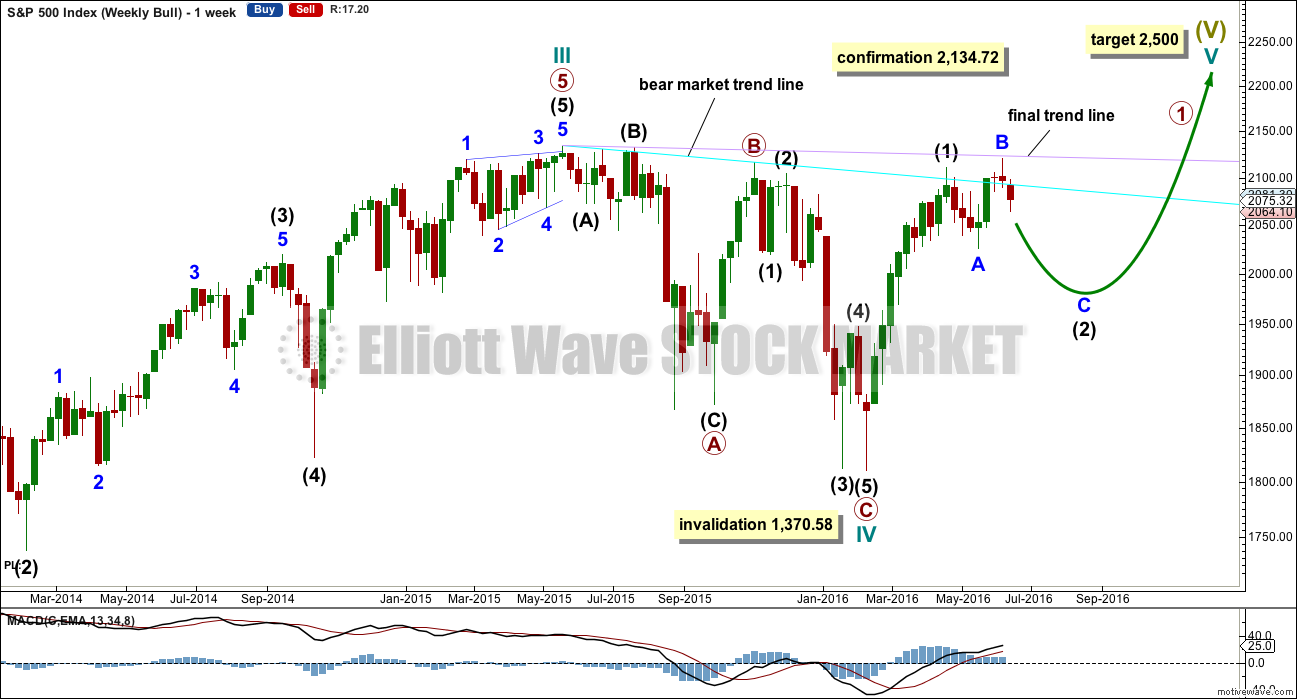
The box is added to the weekly chart. Price has been range bound for months. A breakout will eventually happen. The S&P often forms slow rounding tops, and this looks like what is happening here at a monthly / weekly time frame.
Primary wave 1 is seen as complete as a leading expanding diagonal. Primary wave 2 would be expected to be complete here or very soon indeed.
Leading diagonals are not rare, but they are not very common either. Leading diagonals are more often contracting than expanding. This wave count does not rely on a rare structure, but leading expanding diagonals are not common structures either.
Leading diagonals require sub waves 2 and 4 to be zigzags. Sub waves 1, 3 and 5 are most commonly zigzags but sometimes may appear to be impulses. In this case all subdivisions fit perfectly as zigzags and look like threes on the weekly and daily charts. There are no truncations and no rare structures in this wave count.
The fourth wave must overlap first wave price territory within a diagonal. It may not move beyond the end of the second wave.
Leading diagonals in first wave positions are often followed by very deep second wave corrections. Primary wave 2 would be the most common structure for a second wave, a zigzag, and fits the description of very deep. It may not move beyond the start of primary wave 1 above 2,134.72.
So far it looks like price is finding resistance at the lilac trend line. Price has not managed to break above it.
DAILY CHART
Click chart to enlarge.
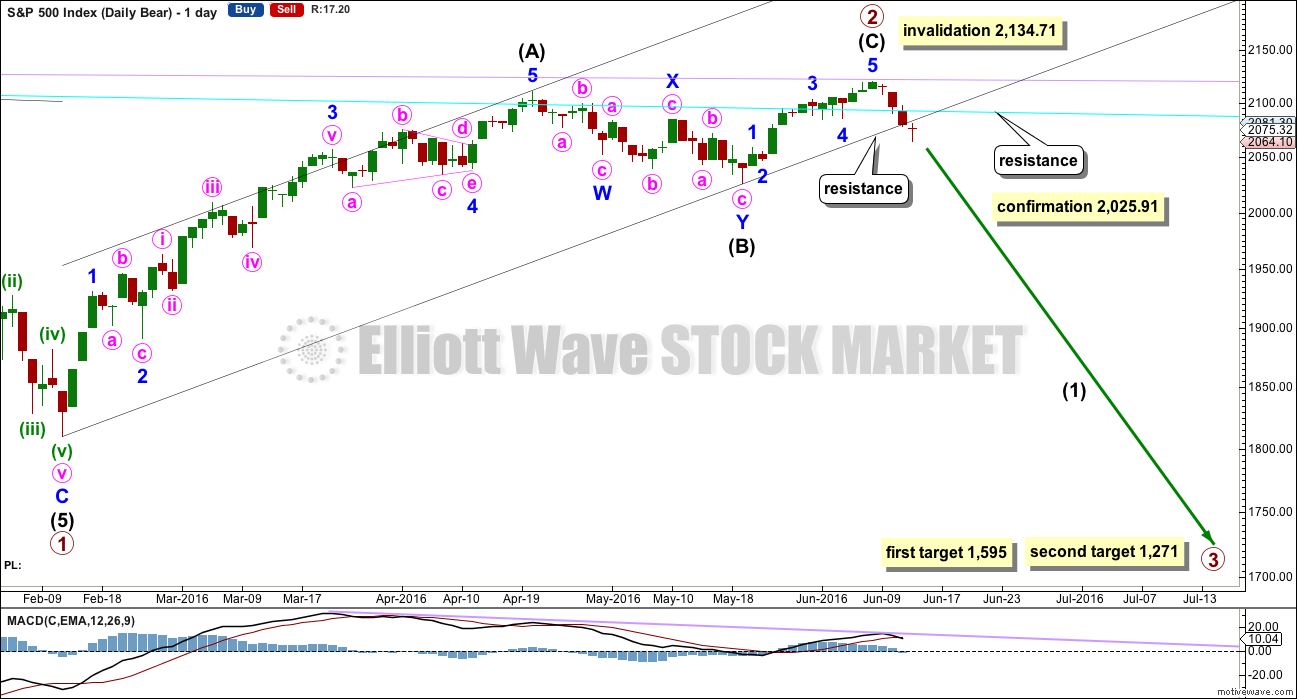
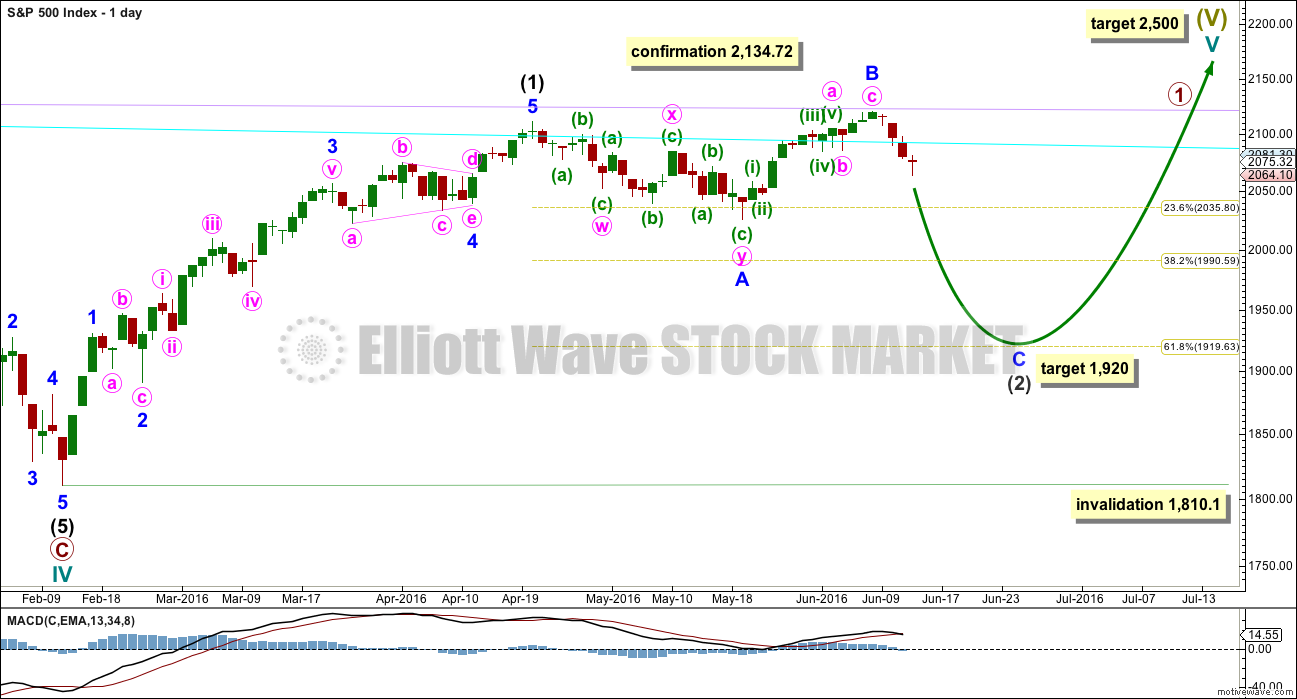
So far primary wave 2 would be a 0.96 correction of primary wave 1. Second wave corrections following first wave leading diagonals are commonly very deep, so this fits the most common pattern if primary wave 1 was a leading diagonal.
The most common structure for a second wave correction is a zigzag.
There is still no Fibonacci ratio between intermediate waves (A) and (C).
Draw a channel about primary wave 2 using Elliott’s technique for a correction: draw the first trend line from the start of the zigzag, then a parallel copy on the end of intermediate wave (A).
Intermediate wave (C) is a complete impulse and primary wave 2 is a complete zigzag. Today completes a full daily candlestick below the wide black channel and not touching the lower edge. This provides some further confidence that primary wave 2 is over.
If intermediate wave (C) was over, then it would have lasted a Fibonacci thirteen days. Intermediate wave (B) lasted a Fibonacci twenty-one days and intermediate wave (A) lasted forty seven days (not a Fibonacci number). Primary wave 2 would have lasted eighty one days (also not a Fibonacci number). If primary wave 3 exhibits a Fibonacci duration, then a reasonable estimate would be a Fibonacci 144 days.
A new low below 2,025.91 would provide price confirmation of a trend change. At that stage, downwards movement could not be a second wave correction within intermediate wave (C) and so intermediate wave (C) would have to be over.
The targets calculated are provisional only. They come with the caveat that price may yet move higher which means the targets would move correspondingly higher. They also come with the caveat that at this very early stage a target for primary wave 3 may only be calculated at primary degree. When intermediate waves (1) through to (4) within primary wave 3 are complete, then the targets may change as they can be calculated at more than one wave degree. Primary wave 3 may not exhibit a Fibonacci ratio to primary wave 1.
The first target at 1,595 is where primary wave 3 would reach 1.618 the length of primary wave 1. This target would most likely not be low enough because primary wave 2 is very deep at 0.96 the length of primary wave 1. Primary wave 3 must move below the end of primary wave 1, and it must move far enough below to allow subsequent room for primary wave 4 to unfold and remain below primary wave 1 price territory. Normally, there is a gap between first wave and fourth wave price territory, particularly in a bear market.
The next target may be more likely. At 1,271 primary wave 3 would reach 2.618 the length of primary wave 1.
If primary wave 3 does not exhibit a Fibonacci ratio to primary wave 1, then neither of these targets would be correct.
Well before these targets, it should be obvious if the next wave down is a primary degree third wave. It should exhibit increasing ATR, strong momentum, and a steep slope. However, please note that although it may begin very strongly it does not have to. It may also be that intermediate wave (1) maintains an ATR about 20 – 30 and has some deep time consuming corrections within it. That was how the last primary degree third wave began within the last bear market, so it may happen again.
Draw a channel about intermediate wave (C) using Elliott’s second technique: draw the first trend line from the lows of minor waves 2 to 4, then place a parallel copy on the high of minor wave 3. Copy this small blue channel over to the hourly chart. Upwards movement may now find resistance at either the lower edge of this blue channel or at the lilac trend line.
MAIN HOURLY CHART
Click chart to enlarge.
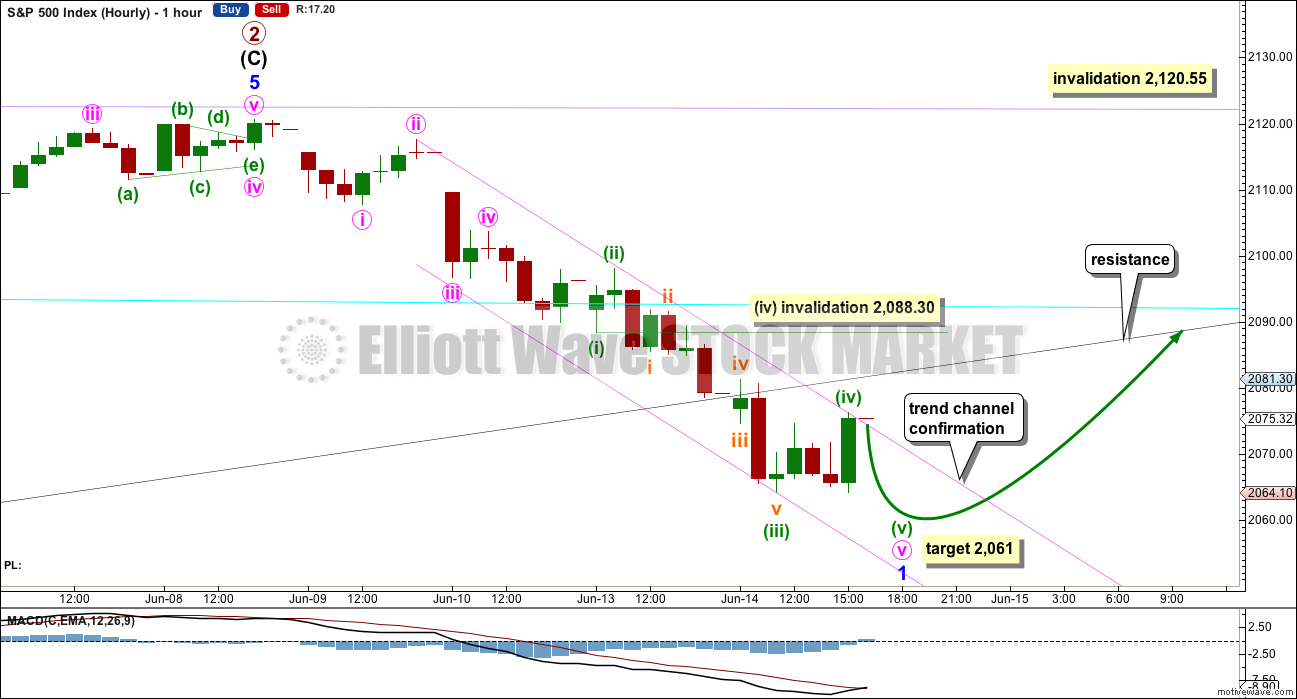
The degree of labelling within this downwards wave is moved up one degree today. At this stage, it looks more like minor wave 1 close to an end.
This main wave count expects only one more low before a multi day bounce begins. At 2,061 minuette wave (v) would reach equality in length with minuette wave (i).
While price remains within the best fit channel drawn here about downwards movement, then it should be assumed that the trend remains the same, down. Only when the channel is breached by at least one full hourly candlestick above and not touching it would it be indicating a possible trend change. At that stage, a multi day bounce may be expected to most likely have begun. A green daily candlestick would confirm it.
This main wave count expects that within minor wave 1 downwards it is minute wave v which is extended. Minute wave iii is just 0.24 points longer than 1.618 the length of minute wave i, and minute wave v may not exhibit a Fibonacci ratio to either of minute waves i or iii.
There is no Fibonacci ratio between minuette waves (i) and (iii) within the extension of minute wave v. This means it is more likely that minuette wave (v) will exhibit a Fibonacci ratio to either of minuette waves (i) or (iii). At 2,061 minuette wave (v) would reach equality in length with minuette wave (i).
On the five minute chart, the last wave down the low for the session will not subdivide as a five and fits best as a three. This indicates it is part of a correction as a B wave within a flat correction (or an X wave within a combination), which indicates downwards movement is unlikely to be over at this stage.
In the short term, minuette wave (iv) may not move into minuette wave (i) price territory above 2,088.30. Unfortunately, this invalidation point is too far away to be of much use in indicating which hourly wave count is correct.
ALTERNATE HOURLY CHART
Click chart to enlarge.
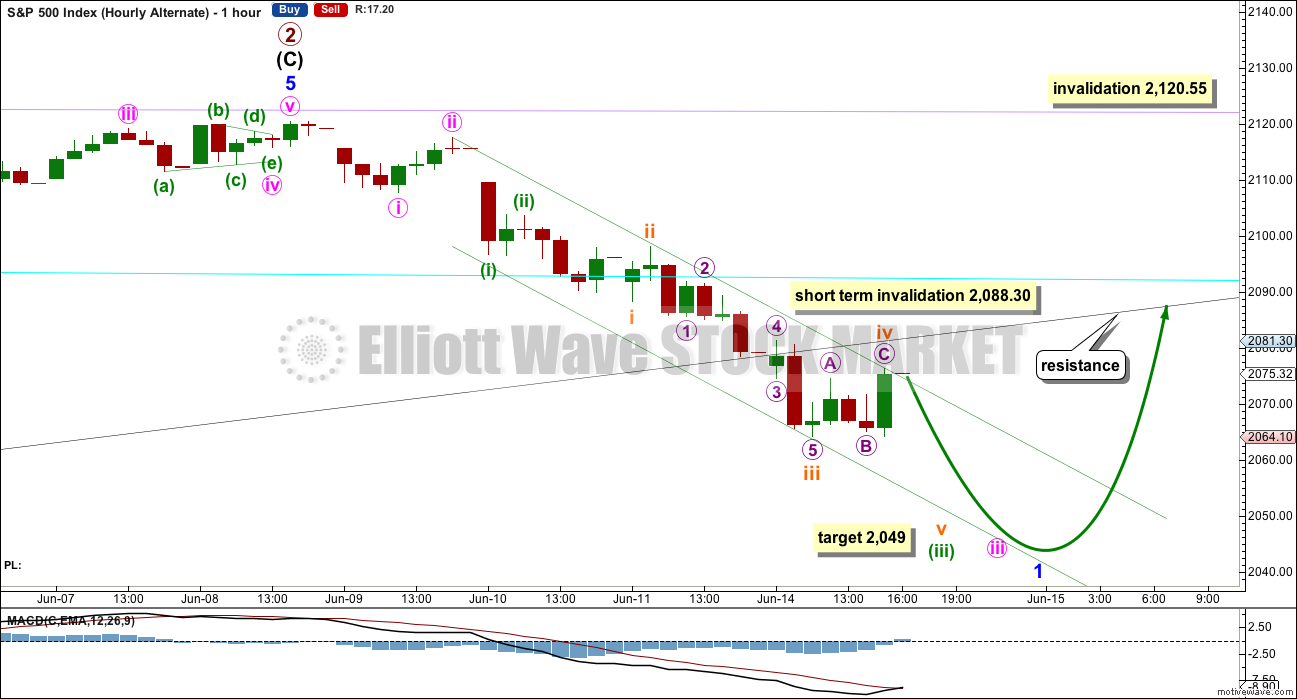
It is possible that downwards movement may still continue for a few days before a multi day correction arrives.
This alternate expects that minute wave iii is the longest extension within minor wave 1. This is a common pattern for the S&P.
At 2,049 minuette wave (iii) would reach 2.618 the length of minuette wave (i).
This alternate wave count will remain possible while price remains within the best fit channel.
BULL ELLIOTT WAVE COUNT
WEEKLY CHART
Click chart to enlarge.
Cycle wave IV is seen as a complete flat correction. Within cycle wave IV, primary wave C is still seen as a five wave impulse.
Intermediate wave (3) has a strong three wave look to it on the weekly and daily charts. For the S&P, a large wave like this one at intermediate degree should look like an impulse at higher time frames. The three wave look substantially reduces the probability of this wave count. Subdivisions have been checked on the hourly chart, which will fit.
Cycle wave II was a shallow 0.41 zigzag lasting three months. Cycle wave IV may be a complete shallow 0.19 regular flat correction, exhibiting some alternation with cycle wave II and lasting nine months. Cycle wave IV would be grossly disproportionate to cycle wave II, and would have to move substantially out of a trend channel on the monthly chart, for it to continue further sideways as a double flat, triangle or combination. For this reason, although it is possible, it looks less likely that cycle wave IV would continue further. It should be over at the low as labelled.
At 2,500 cycle wave V would reach equality in length with cycle wave I.
Price has now broken a little above the bear market trend line. This line is drawn from the all time high at 2,134.72 to the swing high labelled primary wave B at 2,116.48 on November 2015. This line is drawn using the approach outlined by Magee in the classic “Technical Analysis of Stock Trends”. To use it correctly we should assume that a bear market remains intact until this line is breached by a close of 3% or more of market value. Now that the line is breached, the price point at which it is breached is calculated about 2,093.58. 3% of market value above this line would be 2,156.38, which would be above the all time high and the confirmation point.
This wave count requires price confirmation with a new all time high above 2,134.72.
While price has not made a new high, while it remains below the final trend line (lilac) and while technical indicators point to weakness in upwards movement, this very bullish wave count comes with a strong caveat. I still do not have confidence in it. It is produced as an alternate, because all possibilities must be considered. Price managed to keep making new highs for years on light and declining volume, so it is possible that this pattern may continue to new all time highs for cycle wave V.
The invalidation point will remain on the weekly chart at 1,370.58. Cycle wave IV may not move into cycle wave I price territory.
This invalidation point allows for the possibility that cycle wave IV may not be complete and may continue sideways for another one to two years as a double flat or double combination. Because both double flats and double combinations are both sideways movements, a new low substantially below the end of primary wave C at 1,810.10 should see this wave count discarded on the basis of a very low probability long before price makes a new low below 1,370.58.
DAILY CHART
Click chart to enlarge.
Intermediate wave (2) may still be an incomplete flat correction. Minor wave A will subdivide as a three, a double zigzag, and minor wave B may be seen as a single zigzag.
The most likely point for intermediate wave (2) to end would be the 0.618 Fibonacci ratio at 1,920.
Intermediate wave (2) may not move beyond the start of intermediate wave (1) below 1,810.10.
While it is possible that intermediate wave (2) may be a complete double zigzag at the low labelled minor wave A, this would be a very shallow and rather quick second wave correction. The first reasonable second wave correction within a new bull market should be expected to be deeper and more time consuming for this bull wave count, so intermediate wave (2) is expected to continue.
TECHNICAL ANALYSIS
WEEKLY CHART
Click chart to enlarge. Chart courtesy of StockCharts.com.
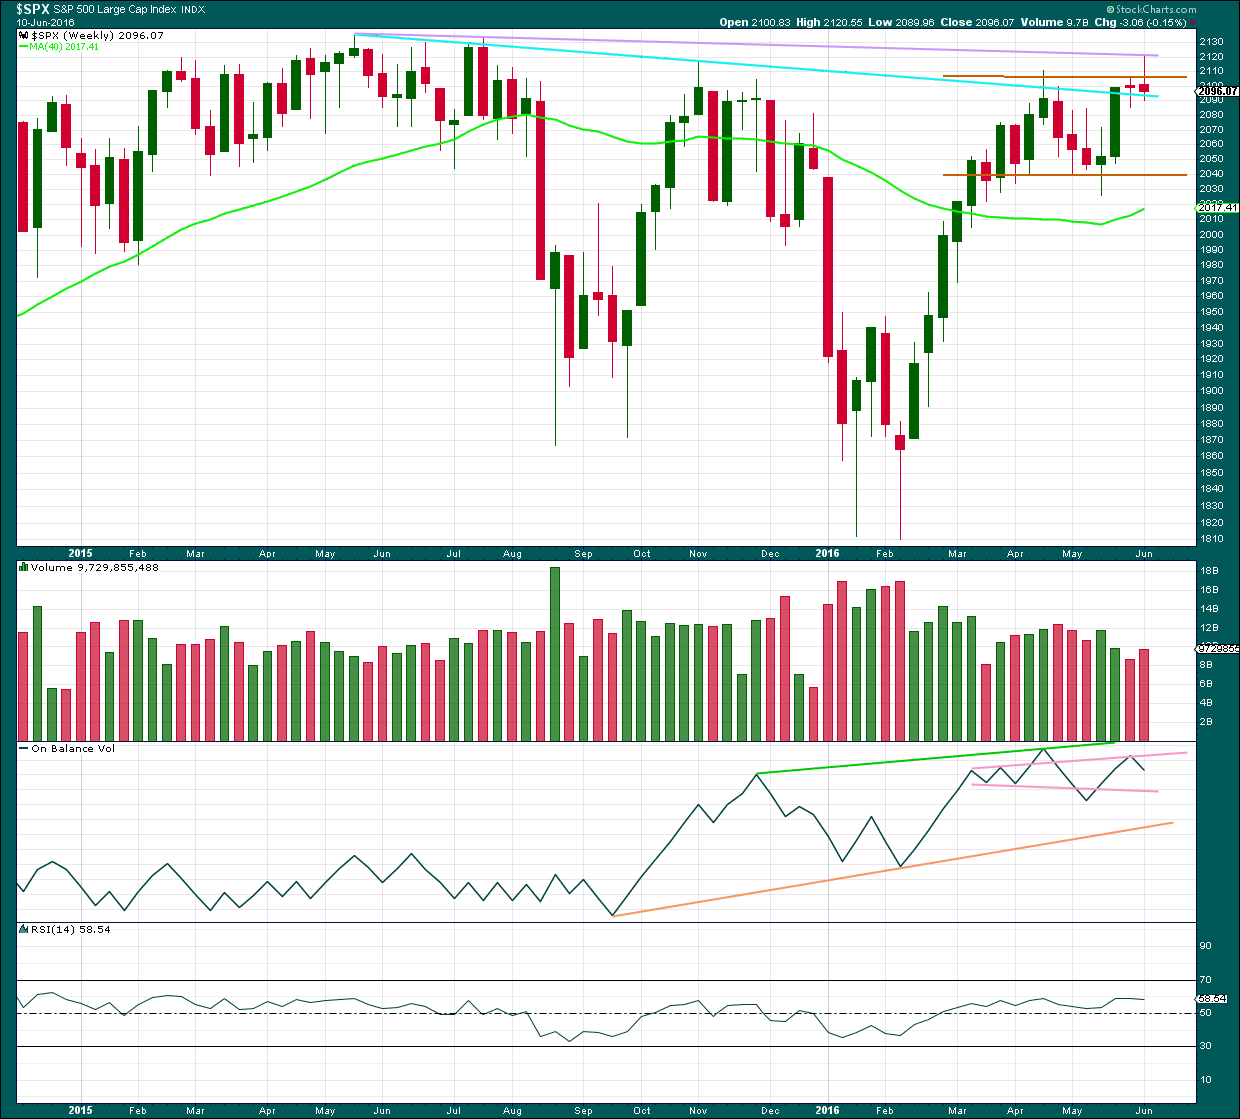
Price is the final determinator and the most important aspect of market analysis. So what has price been doing since the all time high in May 2015?
Price has made an important new high above the prior major high of November 2015. Price is now finding resistance at the lilac line. It can no longer be said that price is making lower highs and lower lows because it no longer has a lower high. This is the most bullish indication from price for many months. This supports the bull wave count over the bear.
Last week completes a shooting star candlestick, which is bearish but on its own not overly so. In this instance, because the upper wick of the shooting star is touching an important trend line, the strength of that line is reinforced and should hold if price again comes up to test it.
On Balance Volume this week gives a bearish signal with a move down and away from the upper pink trend line. There is bearish divergence between the last two highs and OBV: OBV could not make a corresponding new high while price this week made a new high above the prior high of 20th of April. This indicates weakness in upwards movement from price.
Volume is declining while price has essentially moved sideways for the last ten weeks in a zone delineated by brown trend lines. The longer price meanders sideways the closer a breakout will be. During this sideways range, it is a downwards week which has strongest volume suggesting a downwards breakout may be more likely. Last week price overshot the upper edge of this range, but could not break out as it closed back within the range completing a red candlestick.
There is some increase in volume for last week’s red candlestick indicating there was some support for the overall fall in price.
The 40 week moving average has turned upwards, another bullish signal. However, this has happened before in October 2015 yet it was followed by a strong downwards wave. On its own this bullish signal does not necessarily mean price is going to make new all time highs.
DAILY CHART
Click chart to enlarge. Chart courtesy of StockCharts.com.
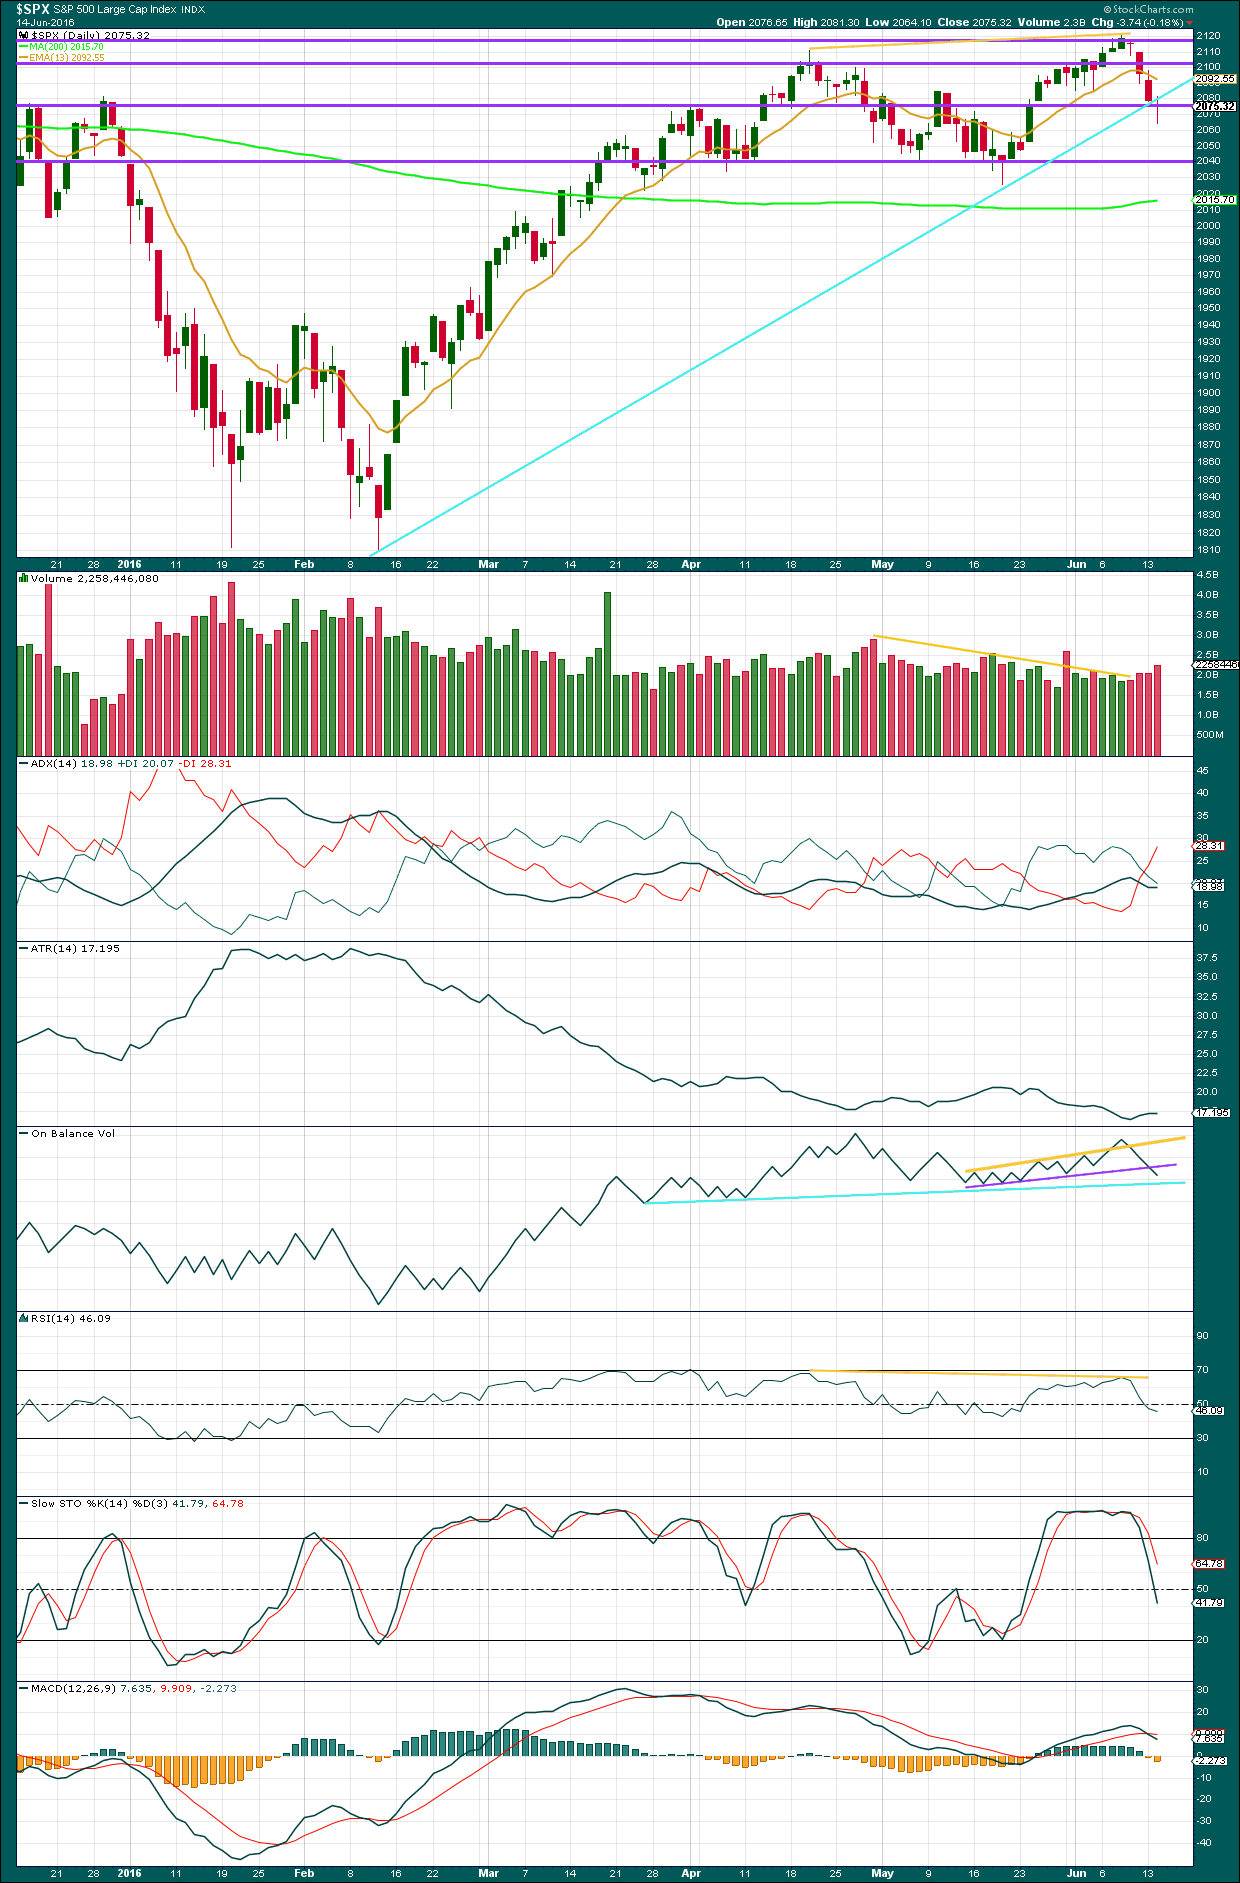
Volume data on StockCharts is different to that given from NYSE, the home of this index. Comments on volume will be based on NYSE volume data when it differs from StockCharts.
A doji candlestick after two long real bodies signals some indecision during Tuesday’s session. That this doji comes close to a support / resistance line about 2,075 slightly strengthens the reversal implications. However, this doji comes within a downwards trend, so the reversal implication absolutely requires confirmation with a green daily candlestick tomorrow. The market may fall of its own weight, so doji within a downtrend are not always a reliable reversal signal.
A cyan trend line is added which replicates the trend line on the daily Elliott wave counts. This line is breached and now price may throwback to find resistance; that would be typical market behaviour. The doji for today supports this idea.
Overall, price is falling on increasing volume. The fall in price is being supported by volume. This supports a bearish outlook at least short term and possibly mid term as well.
For the first multi day bounce the 13 day average may not offer good resistance. Trend lines should be used instead.
ADX today has turned up indicating a new downwards trend. ATR is starting to agree as it too is increasing. With these two indicators now in some agreement, more confidence that a high is in place at 2,120 may be had.
On Balance Volume has today provided a strong bearish signal with a break below the purple line. There is no divergence between price and OBV. This does not preclude a multi day bounce, but it does add significant confidence to a trend change. A new cyan trend line is added today to OBV and a break below this line would be another strong bearish signal, but this line may offer a little support first.
RSI is neutral. There is plenty of room for price to fall.
Stochastics is about neutral. There is plenty of room for price to fall.
MACD offers a sell signal today with a cross of the shorter average below the longer average.
VOLATILITY – INVERTED VIX MONTHLY CHART
Click chart to enlarge. Chart courtesy of StockCharts.com.
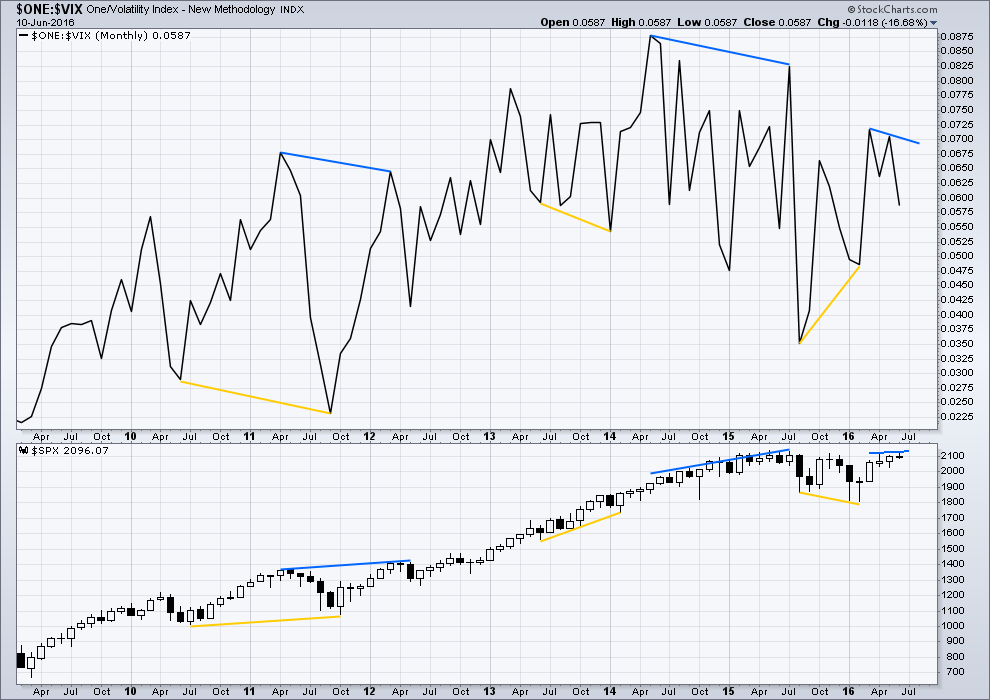
Several instances of large divergence between price and VIX (inverted) are noted here. Blue is bearish divergence and yellow is bullish divergence (rather than red and green, for our colour blind members).
Volatility declines as inverted VIX rises, which is normal for a bull market. Volatility increases as inverted VIX declines, which is normal for a bear market. Each time there is strong multi month divergence between price and VIX, it was followed by a strong movement from price: bearish divergence was followed by a fall in price and bullish divergence was followed by a rise in price.
There is still current multi month divergence between price and VIX: from the high in April 2016 price has made new highs in the last few days but VIX has failed so far to follow with new highs. This regular bearish divergence still indicates weakness in price.
VOLATILITY – INVERTED VIX DAILY CHART
Click chart to enlarge. Chart courtesy of StockCharts.com.
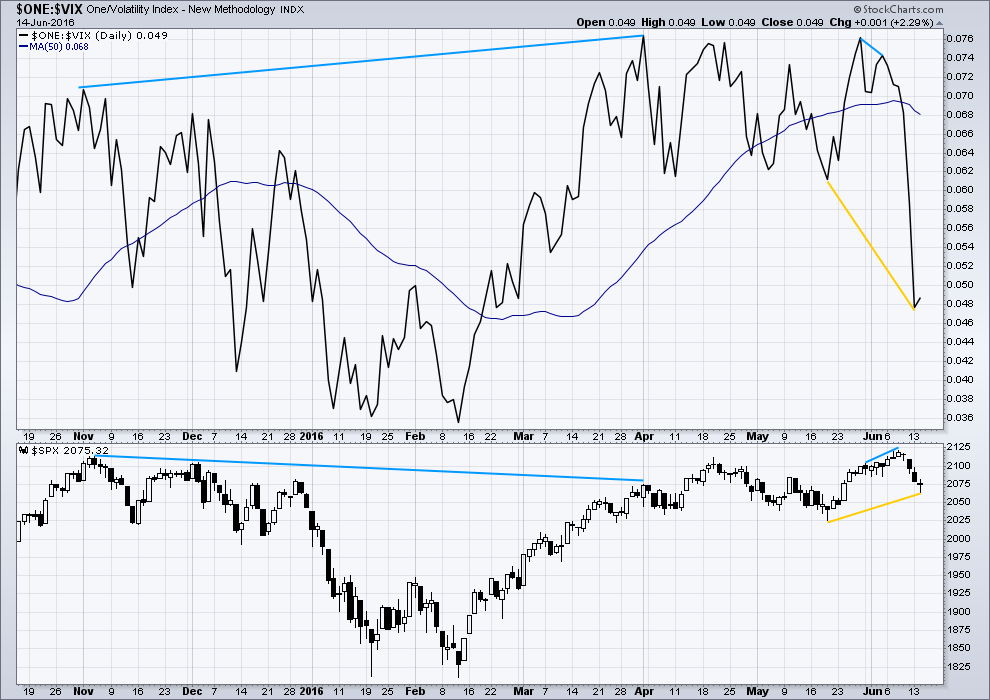
There is now only one instance of hidden bearish divergence noted on this daily chart of price and VIX (blue lines). VIX makes higher highs as price makes lower highs. The decline in volatility is not matched by a corresponding rise in price. Price is weak.
There is also very short term regular bearish divergence (short blue lines). VIX did not make a corresponding new high as price made a new high. This indicates exhaustion for bulls and underlying weakness in price.
Price moved higher for three days in a row (6th, 7th and 8th of June) completing green daily candlesticks yet VIX moved lower. This short term divergence between price and VIX is unusual. It indicates further exhaustion from bulls. This trend in price is weak, especially for the last three days up to the last high.
VIX (inverted) has run away strongly from price. Volatility sharply increased beyond the prior point of 19th May (yellow lines) while price fell (yellow lines).
A divergence 101 interpretation of this is bullish. Volatility is stronger than it was on 19th of May, but this has not translated into a corresponding new low for price. Price is weak. Some upwards reaction would be a reasonable expectation about here to resolve this divergence.
Price today overall moved lower to complete a red daily candlestick, albeit a doji. Yet VIX has moved higher. Volatility declined while price overall moved lower. This divergence supports the idea of more upwards movement short term for a multi day bounce, so it supports the main hourly Elliott wave count.
While I would not give much weight to divergence between price and many oscillators, such as Stochastics, I will give weight to divergence between price and VIX. Analysis of the monthly chart for the last year and a half shows it to be fairly reliable.
BREADTH – ADVANCE DECLINE LINE
Click chart to enlarge. Chart courtesy of StockCharts.com.
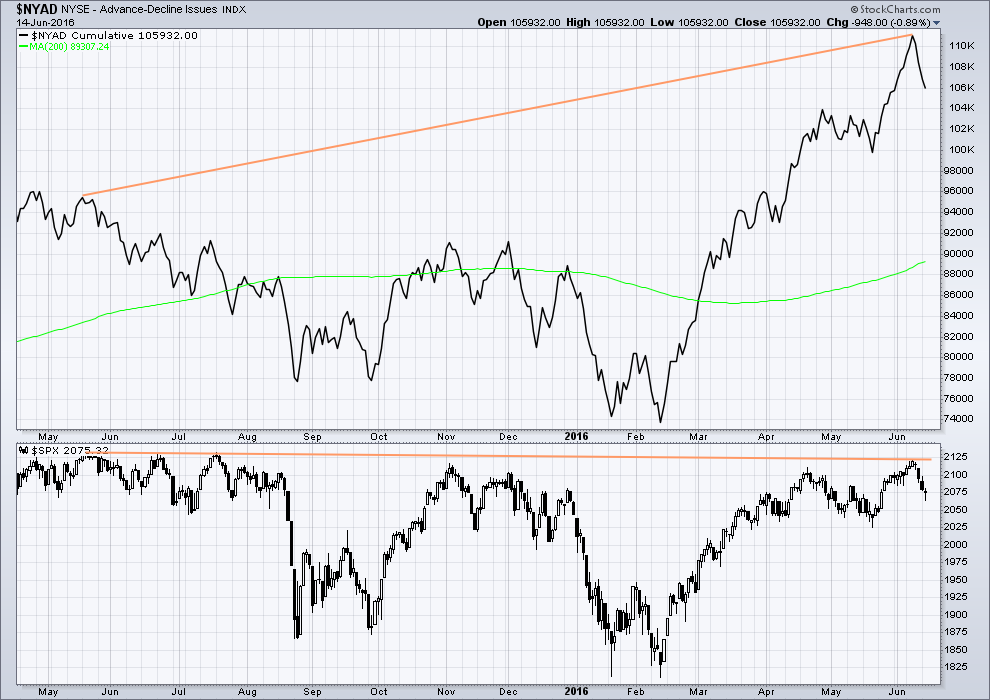
With the AD line increasing, this indicates the number of advancing stocks exceeds the number of declining stocks. This indicates that there is breadth to prior upwards movement.
Taking a look at the bigger picture back to and including the all time high on May 2015, the AD line is making substantial new highs but price so far has not. While market breadth is increasing beyond the point it was at in May 2015, this has not translated (yet) into a corresponding rise in price. Price is weak. This is hidden bearish divergence.
For the last four sessions, price has moved lower and the AD line has also moved lower. There is breadth to this downwards movement from price. There is currently no bullish divergence between price and the AD line.
DOW THEORY
The last major lows within the bull market are noted below. Both the industrials and transportation indicies have closed below these price points on a daily closing basis; original Dow Theory has confirmed a bear market. By adding in the S&P500 and Nasdaq a modified Dow Theory has not confirmed a new bear market.
Within the new bear market, major highs are noted. For original Dow Theory to confirm the end of the current bear market and the start of a new bull market, the transportation index needs to confirm. It has not done so yet.
Major lows within the prior bull market:
DJIA: 15,855.12 (15th October, 2014) – closed below on 25th August, 2015.
DJT: 7,700.49 (12th October, 2014) – closed below on 24th August, 2015.
S&P500: 1,821.61 (15th October, 2014) – has not closed below this point yet.
Nasdaq: 4,117.84 (15th October, 2014) – has not closed below this point yet.
Major highs within the new bear market:
DJIA: 17,977.85 (4th November, 2015) – closed above on 18th April, 2016.
DJT: 8,358.20 (20th November, 2015) – has not closed above this point yet.
S&P500: 2,116.48 (3rd Nobember, 2015) – has now closed above this point on 8th June, 2016.
Nasdaq: 5,176.77 (2nd December, 2015) – has not closed above this point yet.
It is a reasonable conclusion that the indices are currently in a bear market. The trend remains the same until proven otherwise. Dow Theory is one of the oldest and simplest of all technical analysis methods. It is often accused of being late because it requires huge price movements to confirm a change from bull to bear. In this instance, it is interesting that so many analysts remain bullish while Dow Theory has confirmed a bear market. It is my personal opinion that Dow Theory should not be accused of being late as it seems to be ignored when it does not give the conclusion so many analysts want to see.
This analysis is published @ 09:47 p.m. EST.
Dragon fly doji or hammer clearly evident on the VIX (and UVXY) charts today. Wouldn’t surprise me one bit if VIX explodes through the upper BB’s tomorrow. In fact I’ve set up for it… UVXY still has plenty of room until it hits its upper BB…
With the Brexit uncertainty looming next week, I highly doubt the market will be chugging higher from here for a minor 2. There will be a lot of volatility and uncertainty going into the Brexit vote, so it would seem that the alternate count will be in play here. More likely minor 2 will start after the Brexit show is over imho…
FWIW, I think Tom’s count makes sense, Monday’s sell off had a different “feel” then a 3rd wave. I covered that short in the afternoon..too early, only to see it accelerate into the close. Being a small 3rd of a 5th wave down makes more sense because that has the right feel. Today’s last hour sell off looks and “feels” like the start of a 3rd wave of some significance. I mean look at that last hourly candle?! All we have to do now is take out yesterday’s lows and we should be off to the races. Even though it’s probably only minute wave 1 down of minor 3 wave down. 😀
The best part is that the Bulls don’t suspect anything is wrong atm.
When they do…probably/hopefully tomorrow am, then there should be a mad rush for the exit door. SP sub 2,000, if my projections are correct.
That move up to todays high looks very much like a 3 to me (b wave) so the move down was likely an impulsive C wave of an expanded flat for wave (b) of a zig zag for 2 up imho with wave (c) of 2 up tomorrow.
If we make a low below yesterdays low tomorrow then the above view is invalidated and we’re very likely off to the races. I’ve lightened my short after hours just in case, with intention of going back fully short if we take out that low.
UVXY was not too impressed with that sharp move down today which also gives me reason for pause.
Thanks for the 411 Olga. I always appreciate your views and your ew counts. I will be sure to keep that in mind tomorrow am.
You’re very welcome – I’m also watching out for if we do make a new low and then still go higher as the illusive 4th wave scenario would likely have played out in that case (EDIT: Or expanded flat as just pointed out by Lara)
– we did not go high enough today to actually invalidate a 4th wave.
The 4th wave idea is now much lower probability due to the trendline breach but I don’t trust S&P at all with trendlines.
I agree, S&P and trend lines just don’t work so well.
it did take an 11% move off the bottom in 30 minutes before closing slightly lower.
Yep, I am counting the same thing. Was looking for 107.60-107.80 on QQQ and we got it end of day and moved back up after the spike down. I am thinking we start the day moving up, come back a little for a small second wave, and then its up the rest of the day for the 3rd of c.
My! Aren’t you getting to know the banksters quite well!
If you are right, look once again for that strange divergence with volatility. If that happens during a rip-your-face off C wave up grab the kitchen sinks!
Muted futures may give a heads up…personally, I would not mind futures down 3% + to get the party started right! 🙂
Except we have to keep a lookout for a possible expanded flat for minor 2. Don’t want a B wave down to fake us out.
Good point – thanks Lara
Verne- This one is for you….”Tomorrow should be a GAP and go!” 🙂
I ‘an I mon a’watch ‘an I a’wait… 🙂
11.25 basis points, 10 eminis short. Long wait but worth it today! Have to celebrate when u can.
Yea. The close is not looking too good for the bulls.
Good morning all.
The huge breach of the channel on the hourly chart indicates to me that this move isn’t a fourth wave, it’s the start of minor wave 2.
The wave counts were wrong in expecting at least one more low. I have a solution at the 5 min chart level… this shows all movement from the low of minute i at 2,107.73 that you see on the main hourly chart.
So far price is finding resistance about the black trend line, which should hold.
The 0.618 Fibonacci ratio of this bounce would be at 2,098.99, so 2,100 should hold.
If minor 2 is going to get up that high then it will have to meander sideways for about five sessions. Which is entirely possible.
The job of second wave corrections psychologically is to convince us that there has been no trend change. The deeper they go the better they perform this task. Right now today most of us are expecting that the rally up to the 8th of June high has ended. But at the end of minor 2 that view will be unpopular, minor 2 should cause participants to be calling for new ATH’s.
Here is an alternate count with minor wave 1 and 2 now complete. 🙂
Yep, that’s how I”m going to see it.
The problem I had was how to see the end of that movement. I have a solution, but it’s not ideal. It meets all EW rules and has good alternation though… so entirely possible.
That was very tricky at the end of the movement. It did look like 3 waves. Hope you have more good waves to surf today! 🙂
Thanks, it’s looking like there is still some swell. Looking for an afternoon session, 1.5 – 2ft clean longboard waves in the sunshine, bitterly cold though. Booties and gloves help, I’ve ordered a vest with hood to keep my head warm.
Waiting for the tide to turn and come in, pushing up the waves a little… and giving us a nice break at Te Arai 🙂 I can watch the surf out my window right beside my desk, good binoculars gives us a good idea of how it’s working
Analysis will be a bit earlier today due to surf 🙂
I think I’m going to short this near the close and hold it. Looks like it’s having trouble, hitting all kinds of resistance here via a couple different trend lines. Only going to do 1/2 position.
Beware, it may continue for a few sessions. Target 2,099
I’ll keep my stops tight. I always do. This is having some trouble here. It’s not big enough for me to warrant a full short position, but I’ll take a shot at it. I like Tom’s EW count…I think’s its a reeal possibility.
There’s she goes! TIMBERRRRRRR!!!!!
Amazing call – on the money, beautiful entry.
Yes, well done 🙂
Awesome trade QV!!
Even a blind squirrel finds a nut every once and awhile! 😉
Great call & entry…
Volume higher today 569 Million
Nailed it. Hope for continuation tomorrow.
15min, we’ll see if the top of iv is now in….
New SPX high for today. (c) of IV completed ???? No invalidation yet to either the main or alternate hourly bear counts.
Lets see if we can hit the first, main hourly count target of 2061.
Maybe we’ll fill the gap up from this morning – around 2076
The BS being thrown around by the talking heads is unbelievable!
I don’t know why I continue to subject myself to all this BS!
EDIT 2PM: DUH…. No Hike… No hint of future hike…
NO Surprise… This should be a Sell on this News Event because all of this was known! No possible raise until after the election or further down the road… Like the YEAR 2031!
NEXT……….. Negative interest rates!
Because… the BIG R and the BIG D is hear to stay and hear to stay for the foreseeable future… Like the YEAR 2031! See Japan!
Get your CASH NOW! Bury it somewhere! Buy your Gold Now! Bury it somewhere!
Hurry, before more restrictions on what you will be allowed to pull out of the bank… before the BAN is instituted!
I am convinced… that at some point a 30%+++ down, in one day, is on the horizon! When you least expect it.
That is all from me today! Good Luck all!
I have a solution. Just completely ignore it.
Works for me so far 🙂
I know, I know… I try. But I don’t have the distractions that you do where you live.
Here there is not much to do… unless I am traveling.
True, I am blessed to live in a rather beautiful spot with beaches and forest in my back yard.
I also have other hobbies, I like furniture restoration and French Polishing. If there’s no surf I take myself off to The Shed to do some polishing.
Keeps me out of trouble 🙂
I’m outta here. Nothing much to see I’m afraid. Long UVXY by way of naked puts; hedged long the market with SPY 209 calls with contingency STC order open. See everyone tomorrow, GW…
What! You’re leaving an hour before the FED announcement?
Who’s gonna guide me through my UVXY positioning after the announcement???
🙁
Going no where (sideways) until Yellen speaks.
Is this the middle of minor w2 up or end of minute w4 up?
If I am understanding it correctly, according to Lara’s counts, we are in the 4th wave up with one more wave 5 down to go.
The invalidation for both hourly counts is 2088.30
The targets for the 5th wave before a multi day correction up are 2061 for the main bear hourly and 2049 for the alternate bear hourly.
We did not see a green candle for minute two so the longer this wave goes on the less likely to be a fourth wave imo…
UVXY sending bearish market signals. The downward pull of a third wave could be resulting in a tepid second wave at minor degree; we should get some indication before the close…good time to SOH…no UVXY gaps closed
Any close over 2,085 and near 2,099 should be taken very seriously that likelihood of a new ATH is getting strong.
Failure to fall decisively away from round number pivots is generally inimical to the immediate bearish case…I know folk are tired of hearing me say…I don’t like it one bit!! 🙂
The bulls are not entirely convinced. Normally ahead of a move higher they would be swarming all over UVXY like flies on honey. Volume suggests they are being quite cautious…very interesting…
top might be in for the day, 2083.85 should have been the end of iv up
Gotta wait for Yellen…
Vern,
You think banksters will let the markets fall after Yellen speaks…not likely but initial reaction will be interesting as it will be a fake to trap some eager traders.
The key will be whether they can still convince the crowd they have that ability. There has clearly been some coordination today as China and Europe both saw big reversals in the futures overnight. I still think we will see the loss of control first showing up in the futures market. I would not place too much stock on any big intra-day moves right now…other than to scalp ’em…
VIX acting real cagy. We know some kind of big move is coming but no hint so far of which direction. I also would not be jumping on the initial break in either direction…(except to cash in pre-positioned trades of course!!)
If VIX closes inside it’s Bollinger Band today and then closes lower tomorrow, that would give a quite bullish signal. I am hoping to get out at the bottom of this upcoming 5th wave and hoping it happens today.
Yep! Two closes back inside the BB after penetration of upper band is usually a good signal to short it…
Selling naked July 15 15.00 strike puts for 3.40 per contract. Willing to buy 5000 shares of UVXY for final cost of 11.60 per share if UVXY below 15.00 on July 15.
What if you get assigned earlier than July 15?
That is a distinct possibility. Then I immediately sell calls against my long position and use the proceeds to buy puts to limit my exposure. It is amazing how well you can take advantage of short term price volatility to lower your cost basis – I can sometimes actually reduce it to zero!…great question! 🙂
Of course if UVXY trades back close to its recent highs I will happily buy back those puts for about a buck!
Agree as that is what I would do to capture the profits
amen!!
15 sec chart…thing moves to fast to label EW!
Olga – have you figured out how to draw a circle around a number for EW counting on IB?
Can’t do it as far as I know. I just use () and [].
You can change the font size and colour to add some sense of degree also but I’m usually far too lazy for all that 🙂
Learned something new today about VIX options expiration. The expiration takes place the day BEFORE the actual expiration date. Whether the option is assigned or exercised depends on the OPEN price the day AFTER expiration – matters not what happens the rest of the day! If there ever was a bigger crock of horse manure designed to really screw option traders that is one big crock. I just gave my broker hell. I am going to call and give CBOE hell.
It is kinda funny all these years this is the first time I have fallen victim to this unbelievable scam. I kept my trades so nimble in the past they were never able to snag me with this rule designed to let MM screw option traders out of profitable trades. Live and learn. Can you believe these guys???!!!!!
That’s called AM settled options. Most Index options have migrated to PM settlement on expiration day, but there are still a series of AM settled options for certain expirations. In addition, the AM settled options have a settlement symbol you can use to determine the actual settlement value of the index. That’s because you cant just use the opening price of the index as seen on your quotes because that’s not the “official” opening price of the index on settlement day. As an example, RUT has 2000 stocks and all of them do not open at the same time every day. So the index settlement value for expiring options calculates the actual opening price of each stock that day, whereas the opening print for the index is just a calculation the stocks that have open and traded and not all the stocks.
If anyone wants to know more about this, let me know.
Thanks for the info Tony. I had no idea…! 🙂
VIX puts deep in the money and those #%@! market makers trying to rip me off with no bids. No skin off my nose. I will simply sell the ETF short upon expiration today Sneaky S.O.B.s
Vern,
I just sold UVXY PUTs for nice profit picked yesterday morning into the ramp. Now waiting for retracement to reload … I am seeing the possibility of a new ATH around 2,142 based on Fibonacci retracement for the current drop. Does that make sense?
In this bankster infested market, NOTHING would surprise me. The way VIX has been acting, you may well be onto something there… 🙂
At least UVXY does not have that moronic expiration rule that VIX does. Congrats on your nimble timing!
Ris, I see/understand why you would think that. I’m not totally convinced we’re in a bear market yet either….even with all the Brexit talk and the break down recently. Yesterday morning I said that the 34 dma and the 55 dma should hold, at least initially, and so far it has and the market bounced…as expected.
Now with the doji close from yesterday and the bullish move today as well as the FOMC meeting has me sitting on the sidelines and waiting for a clearer picture.
No question we are going to get some kind of bounce today. The question is how much of a bounce. Yellen is going to say the most dovish thing she can get away with, other than an outright announcement of new Q.E., in an attempt to jaw-bone the markets higher. Will the crowd buy it? That is the real question….
Holding a few hedging SPY 209 strike calls expiring Friday…
It’s just my thoughts Verne. I believe in the bear count, I’m just not 100% sold…maybe 90% sold. If you look at the 30 minute chart, trend is now down, but when you look at the daily, we’re not quite there yet. Not even from a peak-trough perspective. This why I don’t mind closing out my shorts as I see momo slow. Until we get some stronger confirmation..this will be my modus operandi moving forward.
Roger that…!
Also holding onto lots of dry powder…
FWIW, we need to be prepared for the alternative should the Brexit vote goes in favour of staying within the Euro, markets are going to soar high and I will not be surprised to see a new ATH on both side of the atlantic.
Bloomberg’s Brexit Tracker puts the probability of Brexit at 39%, so staying in the EU looks somewhat likely at this point. Staying in the EU would be very bullish for the markets.
I thought some of you might like to see this chart.
Rodney,
I saw something related to this from the McClellan indicating the markets are now oversold and bounce will take them to a TOP over the near term before the drop occurs. This is playing out very well as there seems to be a bounce like feeling to the open action today and with huge S&P options position unwinding this Friday or before, likelihood is VIX will drop early into next week ahead of the Brexit vote.
Showing slightly different count on hourly, but same ending. Wave 4 should complete up, then 5 down of V of minute 1. Then minute 2 up.
Both of Lara’s hourly bear counts show us nearing the completion of Minor 1 of Intermediate 1 which is a degree higher than your chart. She has often said one of the most difficult tasks of EW analysis is determining the degree to label the charts at the beginning of a new trend.
Based on the futures though, I think you may be right on in that the 4th wave is not yet complete.
My mistake, CORRECTION, the alternate hourly bear chart show us completing minuette iii of minute iii.
meant Minor 1, not minute 1; thanks for the feedback
C of 4 now almost finished imho. I’ve just added to my shorts for an intraday scalp @ UVXY 14.05. If we go above 2087.70 then W4 invalidated and the W2 bounce likely underway. At that point will wait a bit longer and average in at a better price albeit this move up looks like a C wave to me atm.
agree, i went short at 2073 on sept. eminis
2min Chart
VIX may be indicating impulse down complete. The absence of the high coinciding with the end of minute three down (or minuette three) is problematic imho…
Could be – I’ve got plenty of dry powder atm so I’m quite happy if we go higher 🙂
The 4th and 5th wave were very brief if that was the case (also I cannot get the final wave down to the 2063 low to divide as a 5) so whilst below 2087.70 I’m playing a 4th wave scalp.
If 2087.70 is taken out or next degree wave down is 3 waves then we have our answer.
FTSE has fallen and closed well below a support line, bounced up today. If it finds resistance about 6,050 it would be offering a perfect entry for a short position.
I’m watching FTSE carefully in the next few days….
Shanghai was up today. They’ve had an earlier turn, so seem to be leading the pack again possibly?
Now my only problem here is we have waves (the liquid variety that is) after about 4 weeks of no waves…. so once the analysis is published I’m having a really hard time focussing on trading… wanna surf!
Since you only take a rare vacation (which I do not think is a good idea long term), I suggest you surf, surf, surf as much as you can. Our lives need to be filled with fun and laughter.
Agreed Rodney. I actually simply can’t not surf when the waves are good.
It’s like food. I need it.
The banksters are in full blown panic mode. Not only are the Chinese pumping, European futures have “magically” reversed from well over 1% in the red, to well over 1% in the green. The old bromide regarding gift horses comes to mind… 🙂
Great. May they push price up for us to all find a beautiful entry point 🙂
I’m stoked today, got some nice clean waves with all the local surfers out… so super happy, tired, and ready for the next day!
I already have my beautiful entry point. So, whereas I might not mind a bounce, I am not rooting for a gap up 30 point up day. Rather I am rooting for a gap down 50 point down day.
Well, rooting counts for nothing and does not effect any outcomes. In the end, by the end of next week we should be looking at something very ugly as 2025 is taken out and we slice through 2000.
So glad you had a great surf day.
GLTA
Moving the wave count up one degree I believe is correct. Look for VIX (and probably UVXY) to print a slightly lower high to confirm a fifth wave down prior to a minor two bounce. The one VIX inconsistency I see is that the high came on Monday prior to the end of minuette three down- that is uncharacteristic as the VIX high tends to coincide with completion of the third wave down. Curiously, UVXY did make a new high, and is already showing some divergence with VIX, as it did last August, in marking the end of impulses; this may continue. The fact that VIX jumped outside the upper BB on a minute degree wave decline is ominous. Awesome analysis…as usual. Thank you!
I don’t generally root for the banksters. Here’s hoping they juice this baby higher by thirty points one last time and I imagine Yellen will do her utmost; European futures would seem to militate against any such delectable outcome. Next VIX gap up open should signal the approach of that run-away train we have been anticipating these many months, and 50mm canons at the ready.
Short cable now a ridiculously one-sided trade; looking for a nice disruptive bounce there as well…
From ZeroHedge
I think we are about to see a water-shed moment in this nascent bear market. Every trader and his great-grand- mamma knows the coming market bounce is going to be the deadest of all dead cat bounces. We should see some spectacular volume accompanying the next reversal candle…
China also doing one last hail Mary pump before the bottom falls out…
turd
tredje,,,yet my gramma would always say” turd” cuz of her thick Norwegian accent
Segunda 😉
Boo Hoo