
A bounce was expected for Monday but did not happen.
Price has moved lower breaking below the first confirmation point for the larger picture and confirming a trend change, at least short term.
Summary: A bounce for a second wave correction is still expected on balance of probability. Use the gold trend line on the main hourly chart and the lower edge of the black channel from the daily chart. A break above the gold line early tomorrow would support the idea of a bounce; the target is at 2,104 – 2,108 and the gap at 2,109 may provide resistance. Alternatively, if price breaks below the black trend line tomorrow, then expect strong downwards movement for a third wave with a target at 2,046 short term.
A trading approach to this market: If a bounce is indicated, then wait patiently for it to end; this may take a few days. Enter short when it is complete and / or price finds resistance. If price breaks below the black channel tomorrow, then enter short with a stop just above 2,098.12 or for the more risk tolerant 2,120.55.
Last published monthly charts are here.
New updates to this analysis are in bold.
BEAR ELLIOTT WAVE COUNT
WEEKLY CHART
Click chart to enlarge.
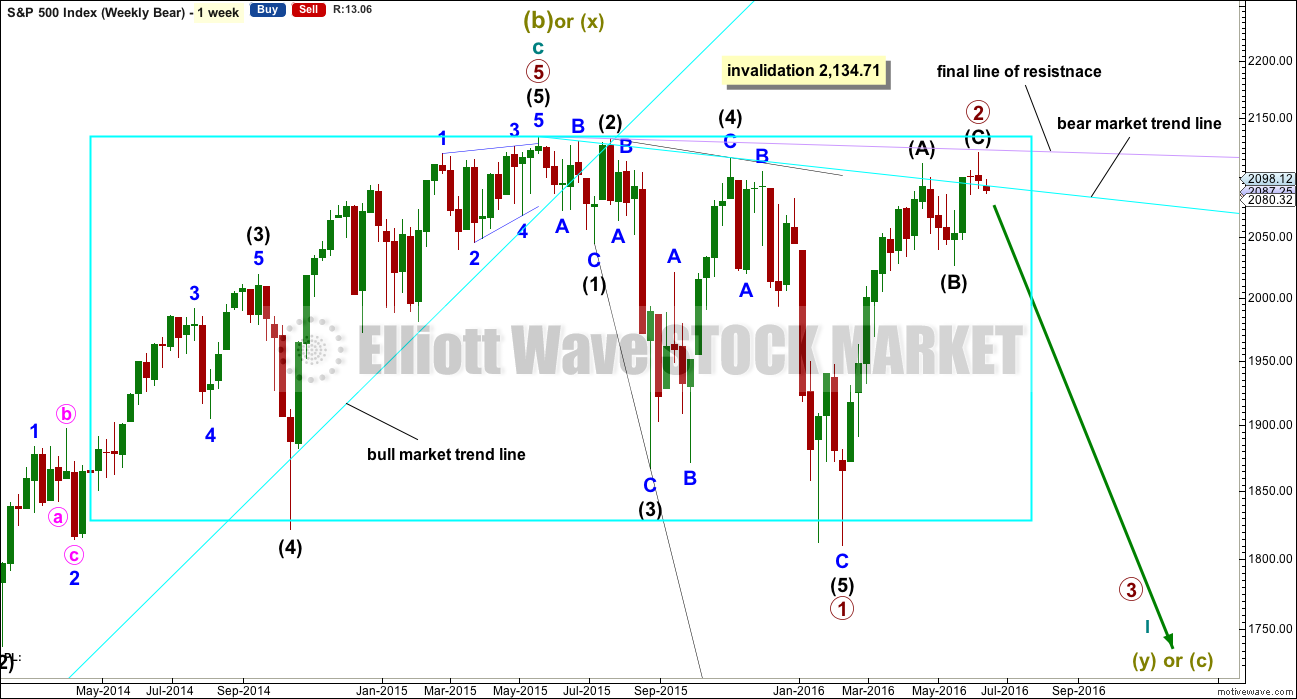
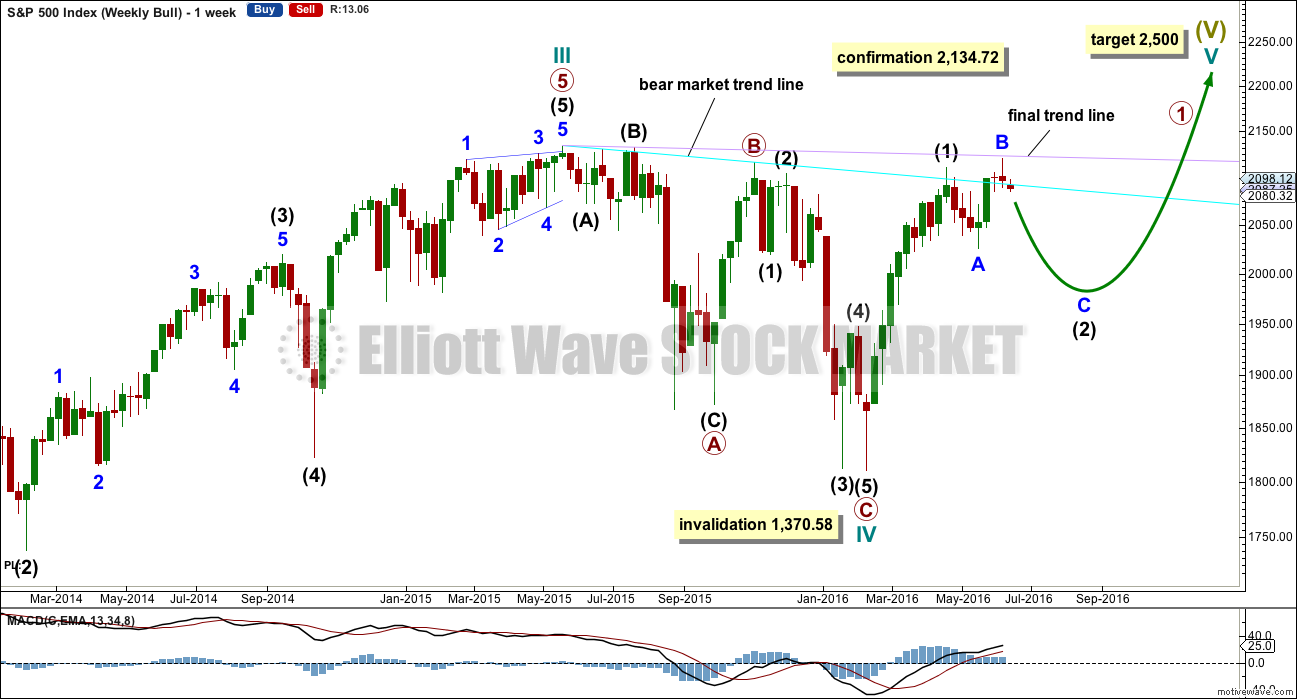
The box is added to the weekly chart. Price has been range bound for months. A breakout will eventually happen. The S&P often forms slow rounding tops, and this looks like what is happening here at a monthly / weekly time frame.
Primary wave 1 is seen as complete as a leading expanding diagonal. Primary wave 2 would be expected to be complete here or very soon indeed.
Leading diagonals are not rare, but they are not very common either. Leading diagonals are more often contracting than expanding. This wave count does not rely on a rare structure, but leading expanding diagonals are not common structures either.
Leading diagonals require sub waves 2 and 4 to be zigzags. Sub waves 1, 3 and 5 are most commonly zigzags but sometimes may appear to be impulses. In this case all subdivisions fit perfectly as zigzags and look like threes on the weekly and daily charts. There are no truncations and no rare structures in this wave count.
The fourth wave must overlap first wave price territory within a diagonal. It may not move beyond the end of the second wave.
Leading diagonals in first wave positions are often followed by very deep second wave corrections. Primary wave 2 would be the most common structure for a second wave, a zigzag, and fits the description of very deep. It may not move beyond the start of primary wave 1 above 2,134.72.
So far it looks like price is finding resistance at the lilac trend line. Price has not managed to break above it.
DAILY CHART
Click chart to enlarge.
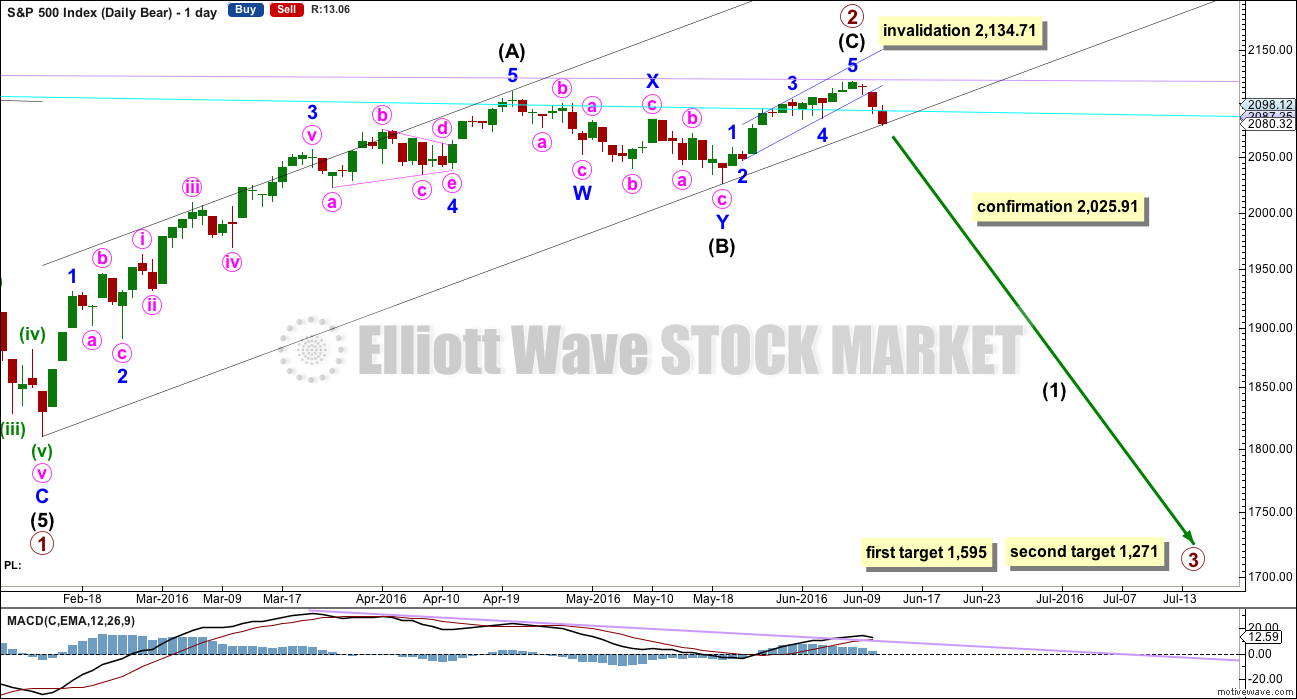
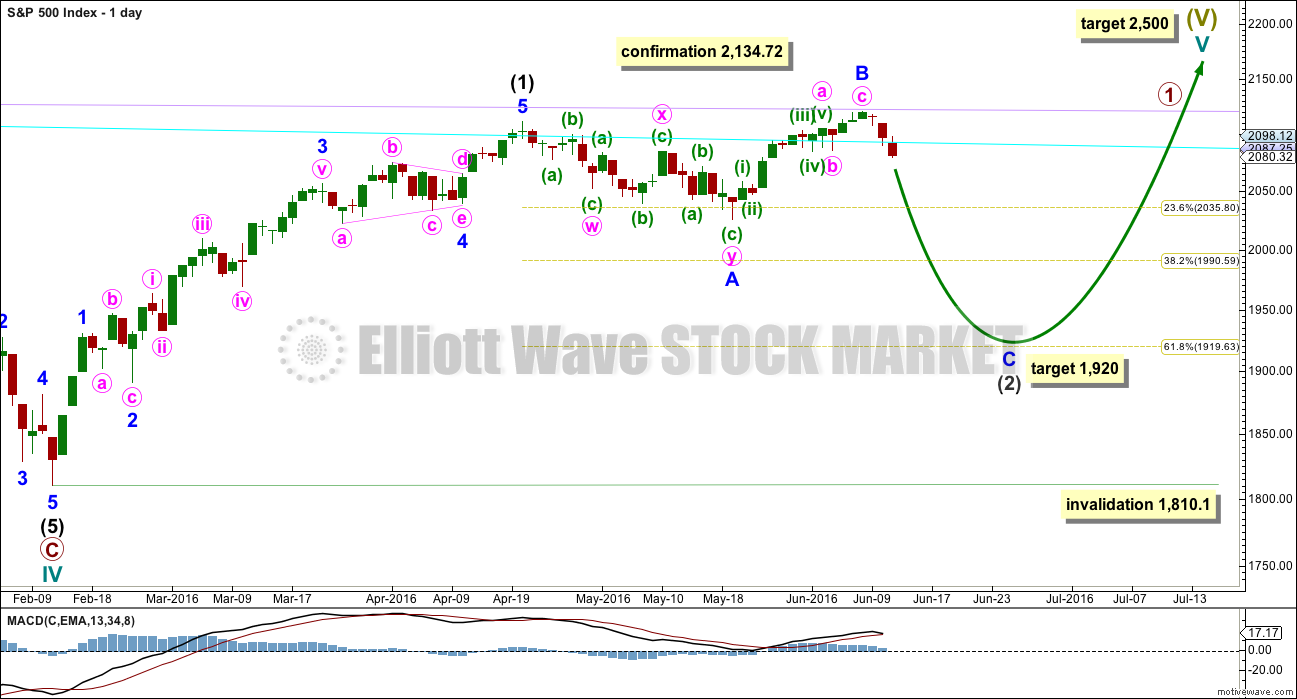
So far primary wave 2 would be a 0.96 correction of primary wave 1. Second wave corrections following first wave leading diagonals are commonly very deep, so this fits the most common pattern if primary wave 1 was a leading diagonal.
The most common structure for a second wave correction is a zigzag.
There is still no Fibonacci ratio between intermediate waves (A) and (C).
Intermediate wave (C) must be a five wave structure. It would be unfolding as an impulse, not a diagonal. The structure may be complete. There is today first price confirmation of a trend change with a new low below 2,085.36.
If intermediate wave (C) was over, then it would have lasted a Fibonacci thirteen days. Intermediate wave (B) lasted a Fibonacci twenty-one days and intermediate wave (A) lasted forty seven days (not a Fibonacci number). Primary wave 2 would have lasted eighty one days (also not a Fibonacci number). If primary wave 3 exhibits a Fibonacci duration, then a reasonable estimate would be a Fibonacci 144 days.
Draw a channel about primary wave 2 using Elliott’s technique for a correction: draw the first trend line from the start of the zigzag, then a parallel copy on the end of intermediate wave (A). When this channel is breached by downwards movement it would be indicating a possible trend change. Price today has come down to find support right at the lower edge of the black channel. A bounce up from here, even a small one, would be a reasonable expectation. Price may find resistance again at the lilac trend line, if it gets that high.
A new low below 2,025.91 would provide price confirmation of a trend change. At that stage, downwards movement could not be a second wave correction within intermediate wave (C) and so intermediate wave (C) would have to be over.
The targets calculated are provisional only. They come with the caveat that price may yet move higher which means the targets would move correspondingly higher. They also come with the caveat that at this very early stage a target for primary wave 3 may only be calculated at primary degree. When intermediate waves (1) through to (4) within primary wave 3 are complete, then the targets may change as they can be calculated at more than one wave degree. Primary wave 3 may not exhibit a Fibonacci ratio to primary wave 1.
The first target at 1,595 is where primary wave 3 would reach 1.618 the length of primary wave 1. This target would most likely not be low enough because primary wave 2 is very deep at 0.96 the length of primary wave 1. Primary wave 3 must move below the end of primary wave 1, and it must move far enough below to allow subsequent room for primary wave 4 to unfold and remain below primary wave 1 price territory. Normally, there is a gap between first wave and fourth wave price territory, particularly in a bear market.
The next target may be more likely. At 1,271 primary wave 3 would reach 2.618 the length of primary wave 1.
If primary wave 3 does not exhibit a Fibonacci ratio to primary wave 1, then neither of these targets would be correct.
Well before these targets, it should be obvious if the next wave down is a primary degree third wave. It should exhibit increasing ATR, strong momentum, and a steep slope. However, please note that although it may begin very strongly it does not have to. It may also be that intermediate wave (1) maintains an ATR about 20 – 30 and has some deep time consuming corrections within it. That was how the last primary degree third wave began within the last bear market, so it may happen again.
Draw a channel about intermediate wave (C) using Elliott’s second technique: draw the first trend line from the lows of minor waves 2 to 4, then place a parallel copy on the high of minor wave 3. Copy this small blue channel over to the hourly chart. Upwards movement may now find resistance at either the lower edge of this blue channel or at the lilac trend line.
HOURLY CHART
Click chart to enlarge.
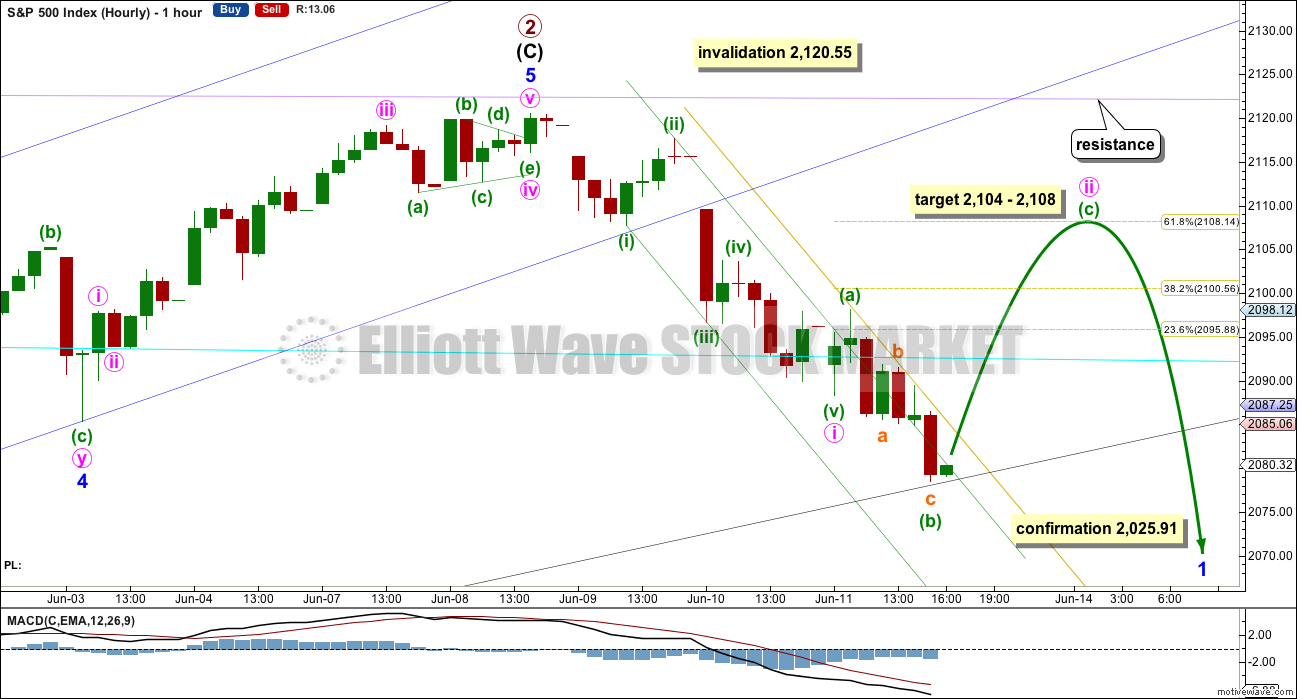
Minute wave i is complete on the hourly and five minute chart now.
Minute wave ii may be unfolding as an expanded flat correction. However, minuette wave (b) is now at 2 times the length of minuette wave (a), right at the limit of conventional acceptance (there is no Elliott wave rule stating the limit for a B wave within a flat, only a common convention that allows for it to be up to 2 times the length of the A wave).
At 2,104 minuette wave (c) would reach 2.618 the length of minuette wave (a). This is close to the 0.618 Fibonacci ratio of minute wave i at 2,108 giving a 4 point target zone. This target would also see price find resistance at the breakaway gap at the start of minuette wave (iii) which has its lower edge at 2,109.57.
Minuette wave (c) may unfold over a few days, with one, two or three most likely, or a Fibonacci five if it is longer lasting (less likely).
A channel is drawn about minute wave i using Elliott’s first technique: the first trend line from the ends of the first to third waves, then a copy on the end of the second wave. Downwards movement today breaches the upper edge of this green channel on the way down. A parallel copy of the upper edge in gold shows where price found resistance today. If this wave count is correct and if we are about to see a multi day bounce, then the upper edge of this channel should be breached early in tomorrow’s session. That would provide a little confidence for this scenario.
To the downside, price has found support exactly at the lower edge of the black channel. Again, if this scenario of a multi day bounce is correct, then price should continue to find support there. A break below the lower edge of this black channel early in tomorrow’s session would shift probability from this main hourly wave count to the alternate below.
At this stage, a possible trading approach to this market would be either to wait for price confirmation (for the less risk tolerant traders), or to enter at the end of minute wave ii with a stop just above 2,120.55. This offers a low risk opportunity to join this possible new downwards trend. Do not invest more than 3-5% of your equity on any one trade, and always use a stop loss. When entering a position at this stage the risk of a loss must be accepted, so it must be managed. Targets at this stage may be those calculated for the end of primary wave 3, with the understanding that as more structure unfolds these targets will probably change.
ALTERNATE HOURLY CHART
Click chart to enlarge.
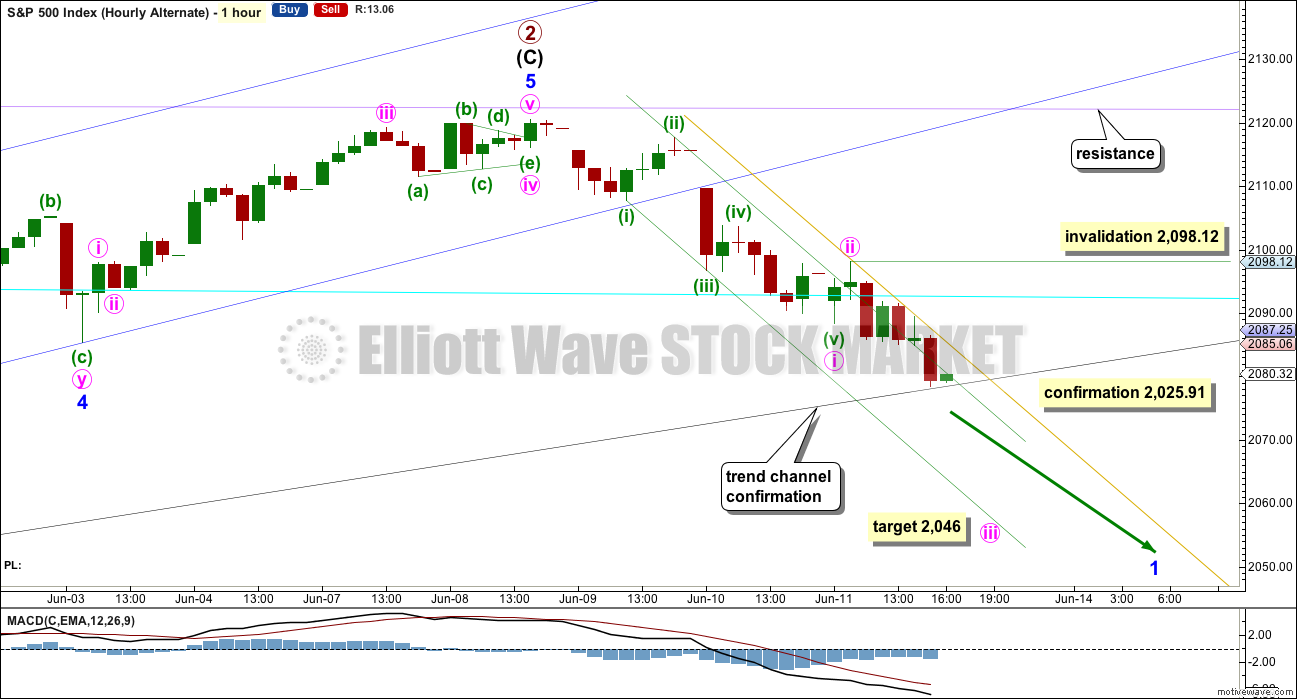
It is possible that minute wave ii was over already as a very brief shallow zigzag. However, it hardly breaches the channel containing minute wave (i), so it does not have the right look to it.
If minute wave iii has begun during Monday’s session, then at 2,046 it would reach 1.618 the length of minute wave i. Minute wave iii must show an increase in downwards momentum.
Within minute wave iii, no second wave correction may move beyond the start of its first wave above 2,098.12.
If price breaks below the black channel early tomorrow, this alternate wave count would increase in probability.
BULL ELLIOTT WAVE COUNT
WEEKLY CHART
Click chart to enlarge.
Cycle wave IV is seen as a complete flat correction. Within cycle wave IV, primary wave C is still seen as a five wave impulse.
Intermediate wave (3) has a strong three wave look to it on the weekly and daily charts. For the S&P, a large wave like this one at intermediate degree should look like an impulse at higher time frames. The three wave look substantially reduces the probability of this wave count. Subdivisions have been checked on the hourly chart, which will fit.
Cycle wave II was a shallow 0.41 zigzag lasting three months. Cycle wave IV may be a complete shallow 0.19 regular flat correction, exhibiting some alternation with cycle wave II and lasting nine months. Cycle wave IV would be grossly disproportionate to cycle wave II, and would have to move substantially out of a trend channel on the monthly chart, for it to continue further sideways as a double flat, triangle or combination. For this reason, although it is possible, it looks less likely that cycle wave IV would continue further. It should be over at the low as labelled.
At 2,500 cycle wave V would reach equality in length with cycle wave I.
Price has now broken a little above the bear market trend line. This line is drawn from the all time high at 2,134.72 to the swing high labelled primary wave B at 2,116.48 on November 2015. This line is drawn using the approach outlined by Magee in the classic “Technical Analysis of Stock Trends”. To use it correctly we should assume that a bear market remains intact until this line is breached by a close of 3% or more of market value. Now that the line is breached, the price point at which it is breached is calculated about 2,093.58. 3% of market value above this line would be 2,156.38, which would be above the all time high and the confirmation point.
This wave count requires price confirmation with a new all time high above 2,134.72.
While price has not made a new high, while it remains below the final trend line (lilac) and while technical indicators point to weakness in upwards movement, this very bullish wave count comes with a strong caveat. I still do not have confidence in it. It is produced as an alternate, because all possibilities must be considered. Price managed to keep making new highs for years on light and declining volume, so it is possible that this pattern may continue to new all time highs for cycle wave V.
The invalidation point will remain on the weekly chart at 1,370.58. Cycle wave IV may not move into cycle wave I price territory.
This invalidation point allows for the possibility that cycle wave IV may not be complete and may continue sideways for another one to two years as a double flat or double combination. Because both double flats and double combinations are both sideways movements, a new low substantially below the end of primary wave C at 1,810.10 should see this wave count discarded on the basis of a very low probability long before price makes a new low below 1,370.58.
DAILY CHART
Click chart to enlarge.
Intermediate wave (2) may still be an incomplete flat correction. Minor wave A will subdivide as a three, a double zigzag, and minor wave B may be seen as a single zigzag.
The most likely point for intermediate wave (2) to end would be the 0.618 Fibonacci ratio at 1,920.
Intermediate wave (2) may not move beyond the start of intermediate wave (1) below 1,810.10.
While it is possible that intermediate wave (2) may be a complete double zigzag at the low labelled minor wave A, this would be a very shallow and rather quick second wave correction. The first reasonable second wave correction within a new bull market should be expected to be deeper and more time consuming for this bull wave count, so intermediate wave (2) is expected to continue.
TECHNICAL ANALYSIS
WEEKLY CHART
Click chart to enlarge. Chart courtesy of StockCharts.com.
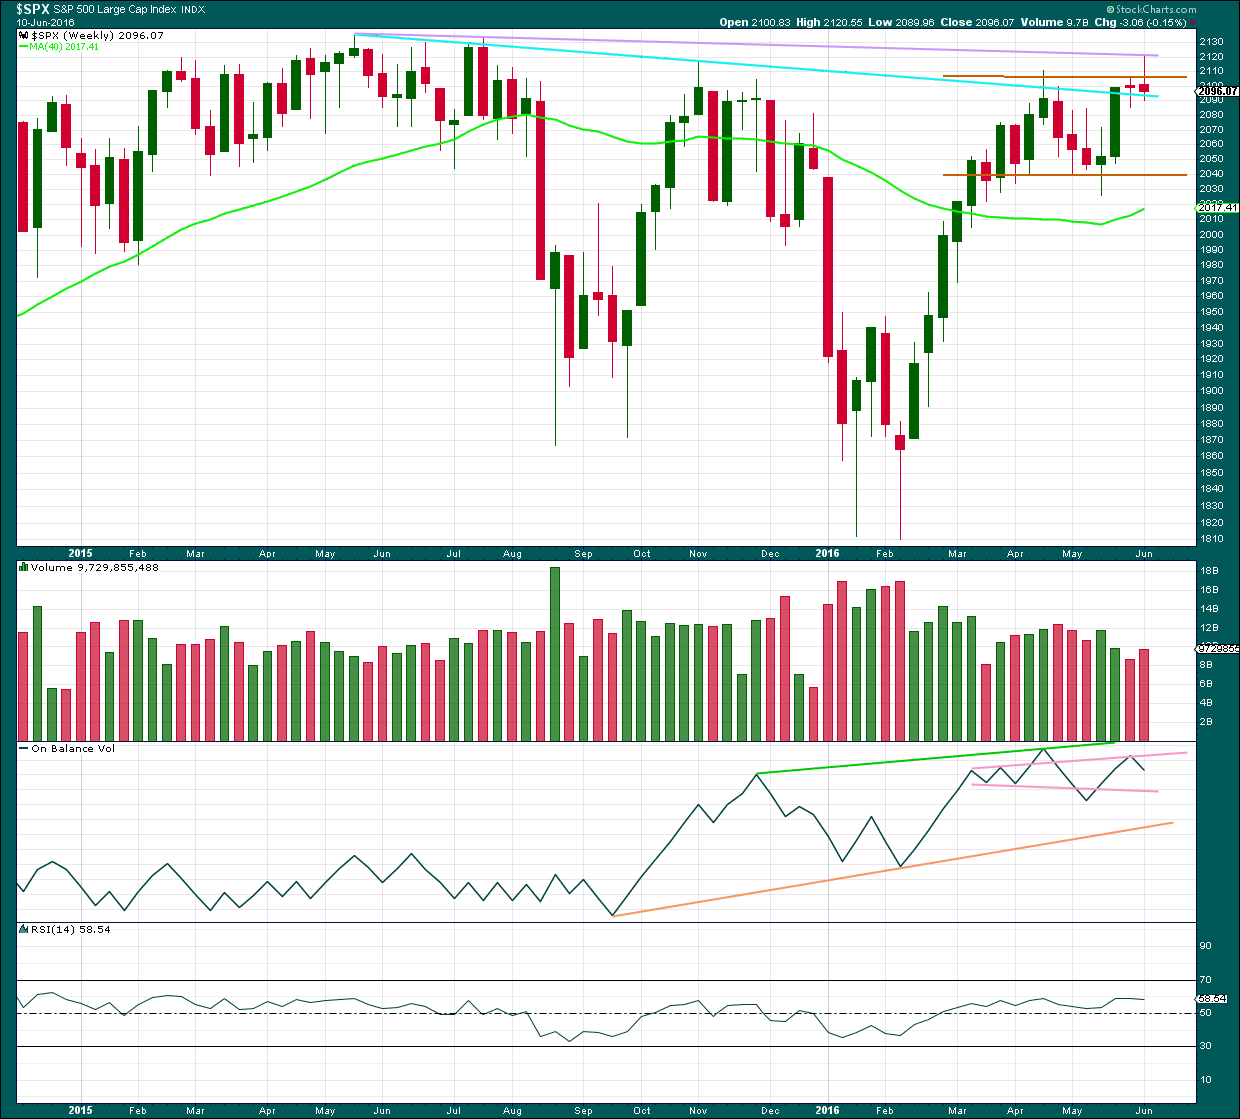
Price is the final determinator and the most important aspect of market analysis. So what has price been doing since the all time high in May 2015?
Price has made an important new high above the prior major high of November 2015. Price is now finding resistance at the lilac line. It can no longer be said that price is making lower highs and lower lows because it no longer has a lower high. This is the most bullish indication from price for many months. This supports the bull wave count over the bear.
Last week completes a shooting star candlestick, which is bearish but on its own not overly so. In this instance, because the upper wick of the shooting star is touching an important trend line, the strength of that line is reinforced and should hold if price again comes up to test it.
On Balance Volume this week gives a bearish signal with a move down and away from the upper pink trend line. There is bearish divergence between the last two highs and OBV: OBV could not make a corresponding new high while price this week made a new high above the prior high of 20th of April. This indicates weakness in upwards movement from price.
Volume is declining while price has essentially moved sideways for the last ten weeks in a zone delineated by brown trend lines. The longer price meanders sideways the closer a breakout will be. During this sideways range, it is a downwards week which has strongest volume suggesting a downwards breakout may be more likely. Last week price overshot the upper edge of this range, but could not break out as it closed back within the range completing a red candlestick.
There is some increase in volume for last week’s red candlestick indicating there was some support for the overall fall in price.
The 40 week moving average has turned upwards, another bullish signal. However, this has happened before in October 2015 yet it was followed by a strong downwards wave. On its own this bullish signal does not necessarily mean price is going to make new all time highs.
DAILY CHART
Click chart to enlarge. Chart courtesy of StockCharts.com.
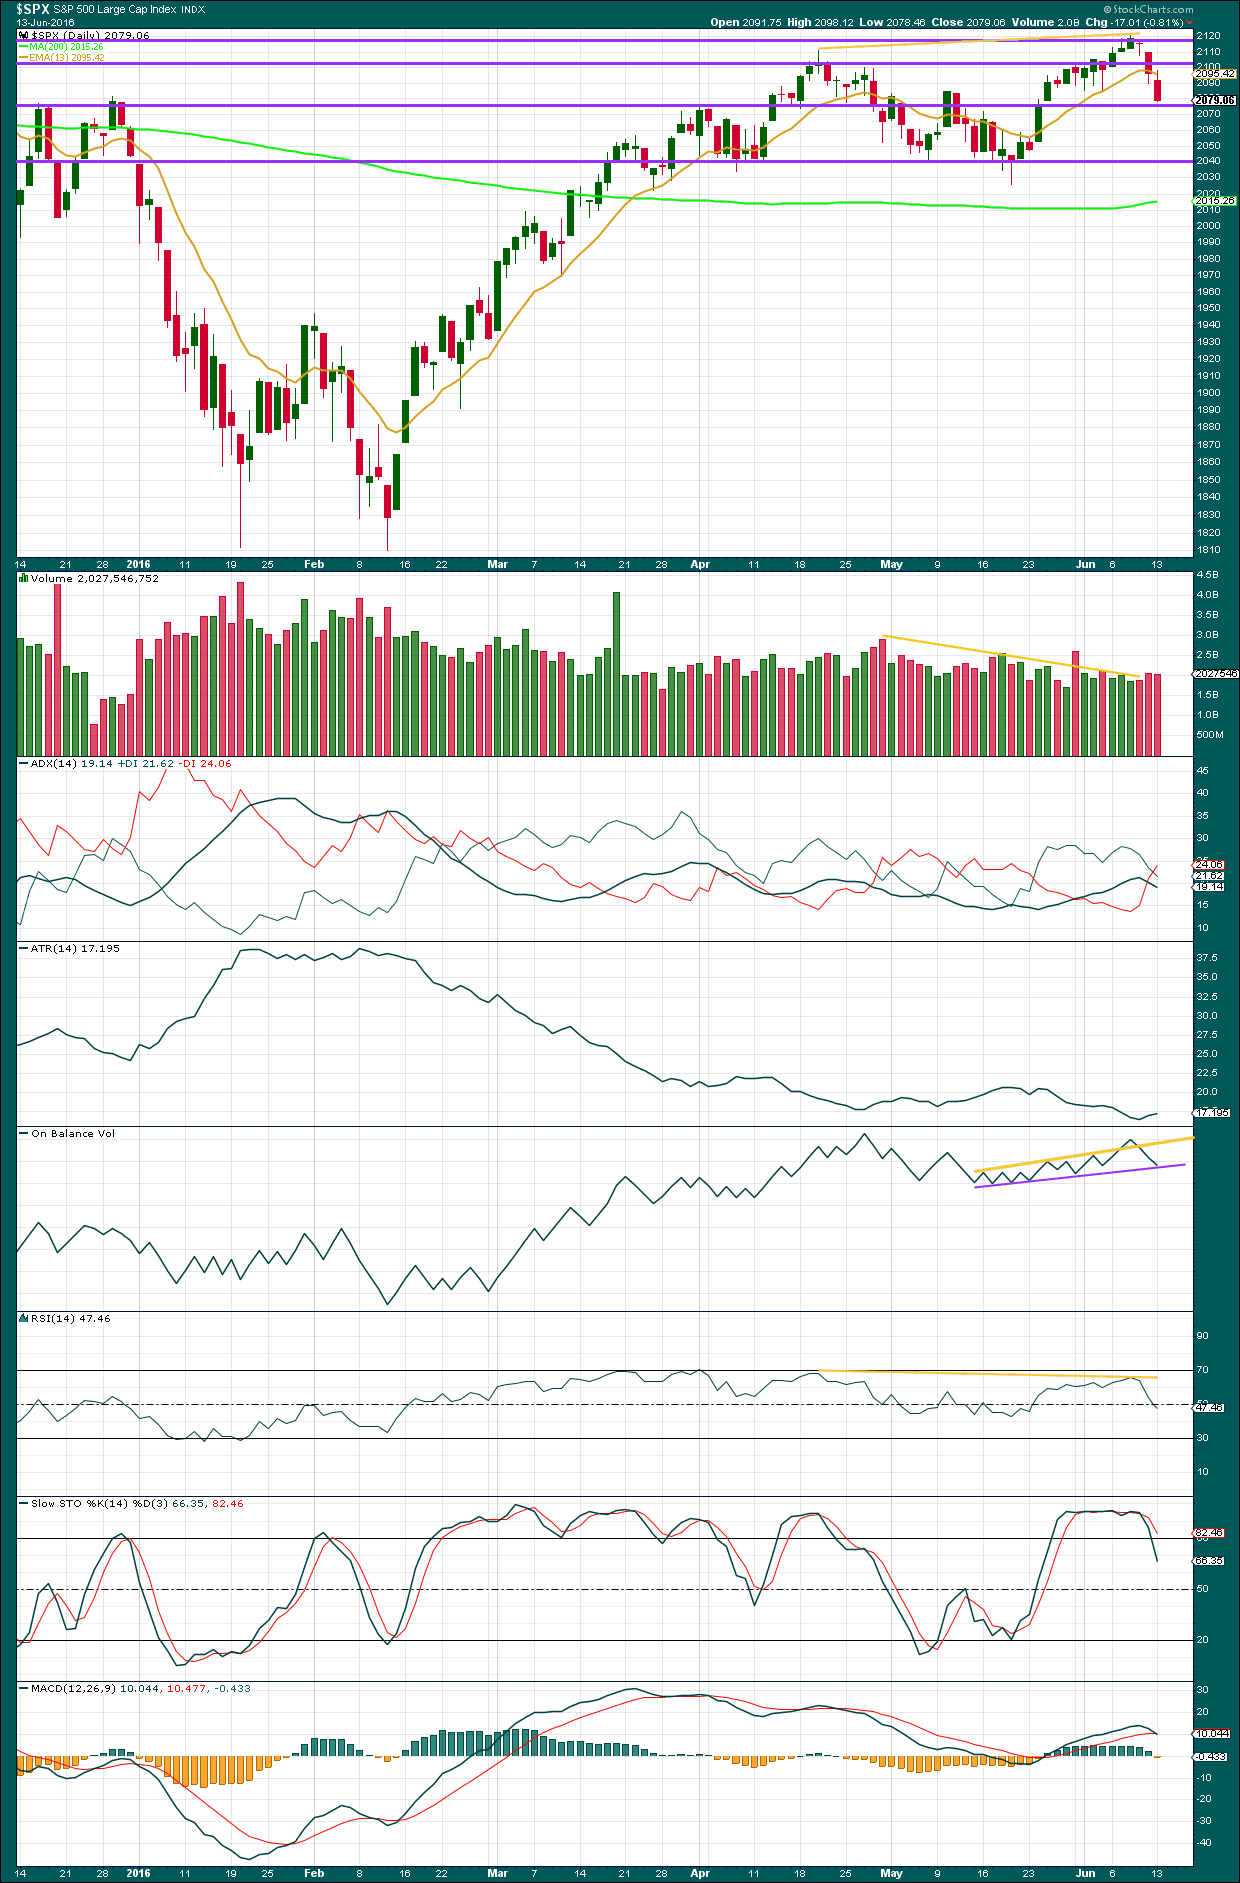
Volume data on StockCharts is different to that given from NYSE, the home of this index. Comments on volume will be based on NYSE volume data when it differs from StockCharts.
The two candlesticks at the high for the week complete a harami cross reversal pattern; this pattern is more effective at highs than lows. In this case, the pattern is strengthened due to the doji of the second candlestick, but possibly may be seen as weaker due to the relatively small real body of the first candlestick in the pattern. On balance, it can be viewed as a reversal signal.
Today’s NYSE exchange data shows some increase in volume for Monday’s session. The fall in price has some support from an increase in volume, although volume remains relatively light at this point. The market can fall of its own weight though; an absence of buyers can achieve the same outcome as an increase in sellers.
Price is coming down to a support line about 2,075. Some reaction here would be a reasonable expectation. This supports the main Elliott wave count.
The downwards gap for Friday’s candlestick may be a breakaway gap, so it may provide resistance. This may serve to hold the expected bounce on Tuesday to no higher than about 2,110.
ADX is now indicating a potential trend change with the +DX line crossing below the -DX line.
ATR may be beginning to also indicate a new trend as it is turning up for two sessions in a row now.
If the ADX line also turns up, and ATR continues to increase, then a new downwards trend would be indicated.
On Balance Volume has given the first bearish signal in a long time with a break below the yellow trend line. A break below the purple line would be a stronger bearish signal from OBV. OBV today has come down to touch the purple line. Again, a reaction from here would be a reasonable expectation before that line is breached. This supports the main hourly Elliott wave count.
RSI did not manage to remove the bearish divergence which materialised during last week, and did not manage to reach overbought. This bearish divergence still exists between the highs of 20th of April and 8th of June and indicates more downwards movement is likely. Divergence between price and RSI is usually fairly reliable, so it should be taken seriously.
There is also some bearish divergence with price and Stochastics at the high for this week, but this is not always so reliable. It is a weak signal. Stochastics has been overbought for several sessions now, so it may be expected to return to neutral.
MACD also exhibits bearish divergence with price between the two highs of 20th of April and 8th of June. This is an unreliable signal though, but it is still bearish.
The 200 day moving average has now clearly turned upwards during last week. This is also a bullish signal, but on its own is not enough to call for new all time highs. This has happened before during the bear market rally of November 2015, yet it was followed by a downwards wave that more than fully retraced that rally.
VOLATILITY – INVERTED VIX MONTHLY CHART
Click chart to enlarge. Chart courtesy of StockCharts.com.
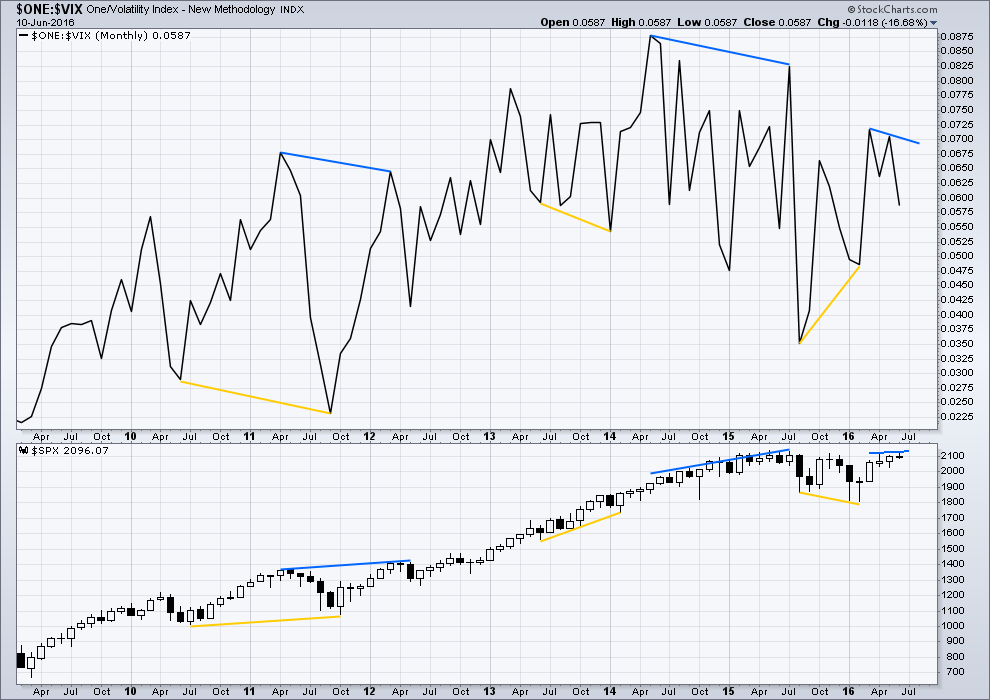
Several instances of large divergence between price and VIX (inverted) are noted here. Blue is bearish divergence and yellow is bullish divergence (rather than red and green, for our colour blind members).
Volatility declines as inverted VIX rises, which is normal for a bull market. Volatility increases as inverted VIX declines, which is normal for a bear market. Each time there is strong multi month divergence between price and VIX, it was followed by a strong movement from price: bearish divergence was followed by a fall in price and bullish divergence was followed by a rise in price.
There is still current multi month divergence between price and VIX: from the high in April 2016 price has made new highs in the last few days but VIX has failed so far to follow with new highs. This regular bearish divergence still indicates weakness in price.
VOLATILITY – INVERTED VIX DAILY CHART
Click chart to enlarge. Chart courtesy of StockCharts.com.
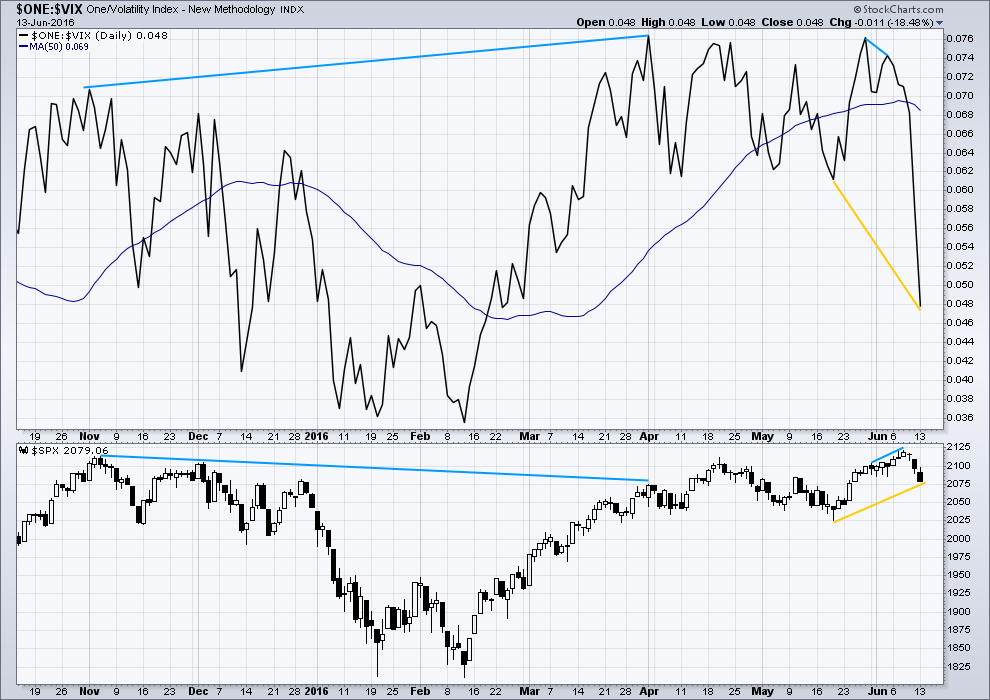
There is now only one instance of hidden bearish divergence noted on this daily chart of price and VIX (blue lines). VIX makes higher highs as price makes lower highs. The decline in volatility is not matched by a corresponding rise in price. Price is weak.
There is also very short term regular bearish divergence (short blue lines). VIX did not make a corresponding new high as price made a new high. This indicates exhaustion for bulls and underlying weakness in price.
Price moved higher for three days in a row (6th, 7th and 8th of June) completing green daily candlesticks yet VIX moved lower. This short term divergence between price and VIX is unusual. It indicates further exhaustion from bulls. This trend in price is weak, especially for the last three days up to the last high.
VIX (inverted) today has run away strongly from price. Volatility sharply increased beyond the prior point of 19th May (yellow lines) while price fell today.
A divergence 101 interpretation of this is bullish. Volatility is stronger today than it was on 19th of May, but this has not translated into a corresponding new low for price. Price is weak. Some upwards reaction would be a reasonable expectation about here to resolve this divergence.
While I would not give much weight to divergence between price and many oscillators, such as Stochastics, I will give weight to divergence between price and VIX. Analysis of the monthly chart for the last year and a half shows it to be fairly reliable.
BREADTH – ADVANCE DECLINE LINE
Click chart to enlarge. Chart courtesy of StockCharts.com.
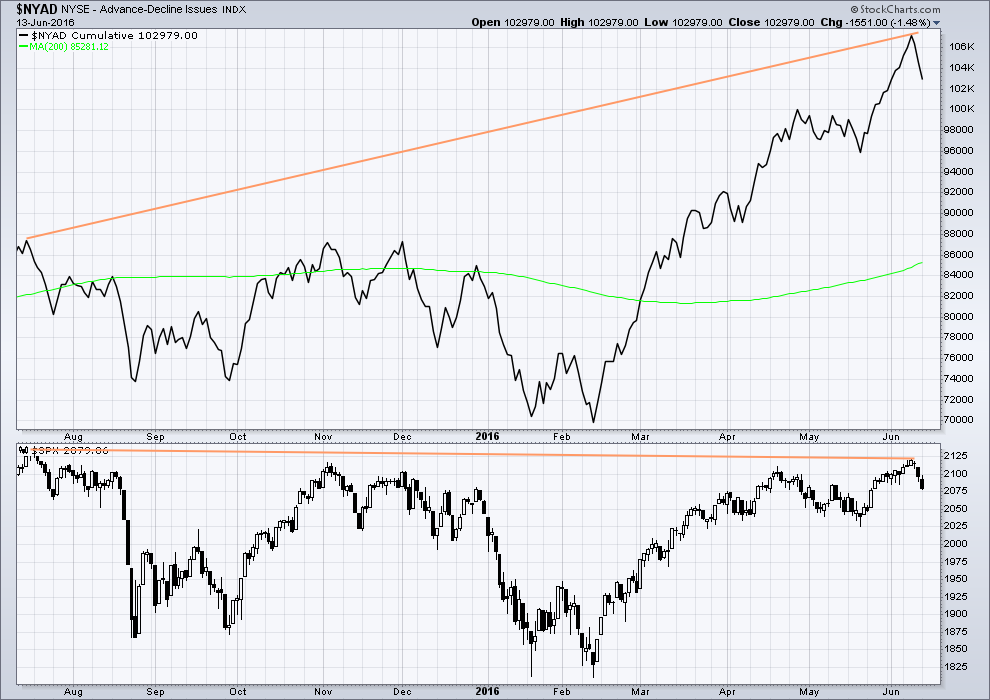
With the AD line increasing, this indicates the number of advancing stocks exceeds the number of declining stocks. This indicates that there is breadth to prior upwards movement.
Taking a look at the bigger picture back to and including the all time high on May 2015, the AD line is making substantial new highs but price so far has not. While market breadth is increasing beyond the point it was at in May 2015, this has not translated (yet) into a corresponding rise in price. Price is weak. This is hidden bearish divergence.
For the last three sessions, price has moved lower and the AD line has also moved lower. There is breadth to this downwards movement from price. There is currently no bullish divergence between price and the AD line.
DOW THEORY
The last major lows within the bull market are noted below. Both the industrials and transportation indicies have closed below these price points on a daily closing basis; original Dow Theory has confirmed a bear market. By adding in the S&P500 and Nasdaq a modified Dow Theory has not confirmed a new bear market.
Within the new bear market, major highs are noted. For original Dow Theory to confirm the end of the current bear market and the start of a new bull market, the transportation index needs to confirm. It has not done so yet.
Major lows within the prior bull market:
DJIA: 15,855.12 (15th October, 2014) – closed below on 25th August, 2015.
DJT: 7,700.49 (12th October, 2014) – closed below on 24th August, 2015.
S&P500: 1,821.61 (15th October, 2014) – has not closed below this point yet.
Nasdaq: 4,117.84 (15th October, 2014) – has not closed below this point yet.
Major highs within the new bear market:
DJIA: 17,977.85 (4th November, 2015) – closed above on 18th April, 2016.
DJT: 8,358.20 (20th November, 2015) – has not closed above this point yet.
S&P500: 2,116.48 (3rd Nobember, 2015) – has now closed above this point on 8th June, 2016.
Nasdaq: 5,176.77 (2nd December, 2015) – has not closed above this point yet.
It is a reasonable conclusion that the indices are currently in a bear market. The trend remains the same until proven otherwise. Dow Theory is one of the oldest and simplest of all technical analysis methods. It is often accused of being late because it requires huge price movements to confirm a change from bull to bear. In this instance, it is interesting that so many analysts remain bullish while Dow Theory has confirmed a bear market. It is my personal opinion that Dow Theory should not be accused of being late as it seems to be ignored when it does not give the conclusion so many analysts want to see.
This analysis is published @ 06:17 p.m. EST.
Interesting scenerio, weekly DAX chart possible count
If three black crows are good for us bears then I hope four black crows are better – as the GDOW has four as of today – with a fifth black crow potentially being created tonight. Also, the DAX has gapped down now 3 days in a row on the daily chart.
I think the rally into the close nullified the 3rd black crow…if im not mistaken
Yes. I don’t think a doji counts
Don’t believe the top one is a doji, could be wrong. Hard to believe a lady who swims with sharks. 🙂
Hi everyone,
I’m new on this site and am watching with interest the situation with the s &p. I’ve had a short position since last week but I have not made much money as the price is moving slightly higher or lower. Are most people day trading this indice?
Welcome! You will love this site. Im relatively new too myself, on my second month and this community of traders is second to none.
Lara’s analysis is awesome. She knows elliotwave therory very well, but also adds traditional technical analysis too and does very well at keeping an objective view to what she sees.
As for traders, there are some very great technicians/traders on this board. Some are portfiloio managers and others are private traders.
You’ll read all different types of inputs, observations and everyone has different time frames. There’s a few of us that trade shorter term, but most are position traders from what i have been able to gather.
Hi QV,
As I’m new to elliot wave and s&P 500 can you tell me the advantages of trading this as it there is not much volatility and seems to be mostly a range bound market. I would be interested in using CFD’s as opposed to options/futures etc as I live in the UK
Hi Asgar, I am trading this from New Zealand with CFD’s.
I began some years ago trading Forex and for a long time I avoided trading the S&P due to it’s volatility! I’m used to NZDUSD and EURUSD as my preferred vehicles. with the odd trade on Oil and Gold when they’re trending.
The S&P will trend and it will trend well. If the wave count is correct (and always remember, it may not be, sometimes I get it wrong which is why you need to manage risk) then it’s ready for a spectacular fall.
Once I started trading it I realised it’s harder than it looks (isn’t everything?) What look like small movements can make a big difference to your bottom line even with a small position.
There’s plenty of profit to be had here.
Lara,
I just saw your comments on my chart from early this morning. Thanks for pointing out its weakness in that I have the 3rd wave as the shortest of its degree. It is all mute now as you are counting a series of 1-2’s of minute 1.
Thanks again and I am keenly interested to see tonight’s analysis. If this series of 1-2’s pans out, I too will be doing my happy dance. Mine is by the campfire at night in the mountains! It gets real interesting after a couple of bourbon and Coke drinks!
watch out for the snipes
and look out for those bears in the woods Rodney!
Snipe hunts!
Remember them well 🙂
Volume on UVXY 120 million, TVIX 126 million so far
A smaller range for today… and a Three Black Crows pattern now. With each body gapping down that adds further bearishness to the pattern. But the range is declining… slight bullishness, it indicates the bears may be weakening.
Price is fully below the big black channel on the daily chart. Normally a bounce up to test resistance would be expected…. so that’s what I’ll expect as most likely.
We need to remain aware of an alternate possibility, that price could move into free fall…. it’s possible but if this wave down for intermediate (1) behaves in the same way as the last intermediate (1) of primary 3 of the last big bear market then it won’t. It will unfold with corrections, the waves will look like impulses on the daily chart and we will be offered multiple opportunities to join the trend.
So if you’ve missed out please be aware that psychologically you may now be feeling like you’ve missed the boat and may enter exactly when you should be patient. If entering short on any small bounce (like the one we have right now) then please manage risk, set a stop just above the last small swing high perhaps and don’t risk more than 3-5% of equity on any one trade.
Personally I’m waiting still for a multi day bounce to add to my short position.
Me too. Waiting for VIX pullback…
Does anyone have a cure for the, “I closed all my shorts right before minute 3 down” blues?
I will gladly swap your current situation for mine.
Volume should close out the day Higher than yesterday.
565 Million
If you took profits, you didn’t lose any money 🙂 you’ll be able to buy back in it looks like. Probably tomorrow will give a better entry point than right now. The FED will try to stabilize the market.
VIX and UVXY both down with a down market. Looks like we have a little bit more upside
Bulls make money.
Bears make money.
Pigs get slaughtered.
That’s helpful: not getting slaughtered and money Kept is better than money lost. Thanks.
I learned that saying on this forum and I just love it. A very good reminder to me that I too often forget and cloud with greed.
Oink… Oink…
Underwater
Me too Joe. Oink!
But for both of us, we are much closer to break even than we were last week. If tonight’s count of a series of 1-2’s within minute 1 of Minor 1 holds, it should not be long before we are in the profits. Thereafter it could get handsomely profitable. Looking and planning my exit strategy.
Me too… I am not going to ride another failure to break 1800 back up. With erosion & time lapse on my leap options… I think I now need to get below 1920 to get even or somewhere near there.
I don’t think my alternate was correct, I think Gary’s idea of minute i extending lower was correct. See my 5 min chart below as well as Gary’s charts.
So that’s a solution for you. Minute i isn’t finished, minute ii up has yet to arrive and it may retest the lower edge of the black channel.
Providing you with a better entry opportunity.
there will always be another entry opportunity, even if just a small one.
***Every trade that makes money is a successful trade***
Rudy- It’s tough, I closed mine out yesterday a little earlier then I would have liked too. It won’t be my first time i did that nor will it be my last time. To be able to catch every move in the market in its entirety is impossible. There will be other set ups that you can make ‘plenty’ money on…coming to a market near you real soon. 🙂
Thanks, This is much better than trading alone, or with just books and Articles.
You said it. I have repeated for several years, I am so grateful I found this service. Lara is awesome and the supporting members add tremendous value. I appreciate all of you.
I share my trading information and strategies, so we can learn from one another. I have learned more about trading tactics & strategies on this site than in a lifetime elsewhere.
And of course, Lara continually reminds us of risk management. I am a bit of a gunslinger and don’t always follow her rules. But when I do, I take full responsibility and recall that in the past it has both cost me a lot of money and sometimes made me a lot of money. In the end, keeping risk low is best.
Should have said, “When I don’t follow her risk management rules, I take full responsibility and recall that in the past it has both cost me a lot of money and sometimes made me a lot of money.
Looks like minuette w(iv) not complete…. 2085.25 back in play. This count invalid above that level.
Why? Your invalidation price not hit? 2074.28 was the high.
You said 2074.54 was inval
Sorry Joseph, that invalidation price was if w(iv) was complete. I think w(iv) is still in progress and would only be invalidated if it moves into w(i) area, which is 2085.25
Good morning everybody! Another Super Happy Morning dance being done here today. A nice comfortable position in my trading account, and 2ft clean offshore waves to play in today.
It would be better if the S&P had behaved itself and bounced, but then I guess it’s not ready to do that yet.
Gary was right, I was wrong. Kudos. It was a series of 1-2, 1-2. Now it needs to complete two more third wave ends, and have two more small fourth waves.
So far it’s sitting neatly within a channel. It will probably stay within it mostly. If it starts breaching the upper edge it’s weakening (but not necessarily over) if it breaks the lower edge then look out for a surprise to the downside.
This is what I have so far on the 5 minute chart.
Hi Lara, have we moved the wave down one degree?
No, this is the 5 min chart of minute i down
I don’t see minute i complete yet
this chart shows only minuette waves within minute i
Ty, I discovered that prior to your post. So main count minute w(i) down.
Yes.
This count invalid above 2074.54, above that would indicate minuette w(iv) not complete.
You were right and I was wrong Gary. It looks like it was a series of 1-2, 1-2 waves.
Now moving into 3-4, 3-4.
Do you want to swap jobs? /JK
Just an admiring student professor…
Hey Verne, here is another take on why the VIX spiked so hard yesterday on just a small drop in the indices. Its from Mark Kolanovic from JPM, who has become the go-to guy on market volatility. I don’t understand all of it but it has to do with one cool $trillion in SPX related options expiring this week. What’s also interesting is what he has to say about the diminishing company stock buybacks and what that will do to pull the markets down:
http://www.zerohedge.com/news/2016-06-14/jpms-quant-guru-unveils-1-trillion-catalyst-will-unleash-next-market-turmoil?utm_source=feedburner&utm_medium=feed&utm_campaign=Feed%3A+zerohedge%2Ffeed+%28zero+hedge+-+on+a+long+enough+timeline%2C+the+survival+rate+for+everyone+drops+to+zero%29
Minuette w(iii) is validated by MACD but minuette w(iv) may not be over…could move sideways in something more complex.
Nice chart Gary. I’m seeing it the same way.
Now I want to see how VIX and derivatives act. Not too long ago Minor 3 down made a lower low than Minor 5 down. That caught me by surprise. Verne pointed it out as a not so uncommon occurrence.
I’m not really educated regarding VIX/SPX performance relationship. I have never seen any correlation analysis data. There are others on this forum who are experts. A wave 5 truncation does occur and is possible, I think minuette w(v) is likely to extend.
Sorry minuette w(iii) already extended….so w(v) should be just 5 waves down.
VIX now red…does that mean we should rally? Or is this a bull trap?
I’m having trader’s block…lol! I can’t decide to get long or short. I must be scared so all I can do is watch…for now.
If I get long, it would only be for a scalp.
New and improved
Alternative count, 15min chart
Thanks Peter – Wave ii cannot retrace more than 100% wave i imho but the essence of the count could still work. Either Lara’s alternate or an extended 5th wave similar to your chart are my favourites atm.
1min RSI has been showing divergence with price for a couple of days so I took some profits this morning – expecting a bounce sooner rather than later.
your correct, basic rule I know well yet used in error; I’d just move the i and ii over to the right then on the 15min chart
Help here please :
An hourly candle below trend channel confirmation – ( Laura s daily and hourly chart ) would put the alternate in play ? Correct ?
Any chance for entry on throwback to trend channel ?
Thoughts
Thanks guys
That already occurred twice on the 1 min chart. in the 1st 40 min of trading.
he was asking about hourly chart confirmation
Isn’t this all fractal? Tested twice on 1 min then moved down materially.
I would think the target is next on the alt count to complete 1. Then see what comes next after that based on that action. No???
Thank you , Barry
I’m redrawing the channel.
Oops… sorry, I realised which channel you’re referring to here.
I’m redrawing the channel about the small wave down, not primary 2 up.
Yes, price is below the black channel. Now I normally would expect a throwback to test resistance.
FWIW, if Brexit is driving the markets down, US markets should start to see funds flowing in as the folks start to move positions from Europe and others into US markets given the strength the market is showing. I think it will be prudent to be careful opening new short positions as VIX readings might imply a short term bottom and perfectly aligns with FED meeting finishing.
It’s NOT BREXIT! At least not yet… Brexit is still 9 days away and you can’t believe the polls at this point.
That’s what the talking heads want you to believe… that this is Brexit. Something else is going on! Brexit is the current mind game they are all playing. DOn’t believe the CON!
Why would People reposition funds out of UK & Europe on a whim based on a Vote that has yet to take place where in the worst case a vote to leave… otherwise better than 50%/50% they stay in?
Money flows will NOT occur until after the vote takes place and the result is known… Then nothing is instantaneous! The exit will be a process over months.
The scare tactics is propaganda all designed to get a vote to stay in.
I believe it is best in the long-term for the UK & its citizens to exit euro zone. If they want to maintain the UK as a nation… otherwise they will drift off into history as other nations in history have disappeared. Vote to stay in is probably the last chapter that will be written.
It’s certainly the Brexit effect here in europe, sterling volatility at recession levels
IT has nothing to do with negative interest yield on the German 10 yr Bond for the 1st time & elsewhere for a period of time?
+ The fact that the world is probably already in a recession with deflation accelerating & with the USA very close behind?
Grossly overvalued Equity Stock Prices in the USA with profit margins declining and sales/revenues declining?
+ Debt at levels worldwide, both public & private, that very soon will NOT have the free cash flow combined to be able to service all that debt + meet other unfunded liabilities?
Nothing at all to do with all of that? Okay… Then I stand corrected.
Agree, it is more than Brexit. Brexit just one of the many negative variables, much bigger fish to worry about.
Joseph,
No disagreement on the stated fundamentals negatives and the associated adverse impact. However, I am unable to see how FED will allow for the markets to drop significantly into the elections unless Republicans take significant lead in the polls leading into the elections JMHO.
Well… No doubt at all about that bias.
I don’t believe they have the firepower left! All they can do is not raise until after the election which is what the markets already expect.
If they do anything else… the bias will be way too obvious for all to see and if the right group wins, all currently running the Fed will be asked to resign in January or be fired. Then the Fed will be changed dramatically! Their charter will be changed once & for all.
Agree
If the Fed was smart… and their NOT! They would raise now and in July or raise .50 now. Then if necessary… to keep the powers that be… cut in Sept & Oct… that would be the smart play to help their Bias get elected.
It seems to me that there is another possibility, other than the alternate Lara published, and at least as credible, and that is an extended minute fifth wave. I don’t have a plot I can show you but it does seem to fit what has unfolded.
Can you be more specific?… extended 5 off of which chart in Lara’s analysis above?
Sorry, I misspoke above. I’m proposing that minute 1 is only now completing, and with an extended fifth wave. Lara’s alternate shows an extremely small minute 2, that doesn’t seem likely, with today’s action as part of minute 3. I’m proposing that today’s action completes minuette 5 of minute 1, with minute 2 starting to unfold.
Thanks Thomas
Yes, I wasn’t happy with that small minute ii which is one reason why that was an alternate
My attempt at a 1 minute chart EW count.
I don’t think your leading diagonal would work, it looks like the third wave would be the shortest.
Try a series of 1-2, 1-2, 1-2 for that piece of movement then it all starts to fit in neatly
From Lara’s commentary above:
“If price breaks below the black channel early tomorrow, this alternate wave count would increase in probability.”
We are at that black channel line now. We need a candle fully below and not touching the line to confirm this signal. We have bounced off it as the first attempt to break through.
…….something else to keep in mind. This area right below here is the 34 day SMA and 55 day SMA. Doesn’t mean it can’t break down from here, but my current thoughts are we should find some support here …at least initially.
That line was 100% breached with a low of 2074.54 in the first 1 min. of trading.
That line appears to be 2080 today on her chart.
That line 2080 is now resistance… with the underside tested twice so far this morning on the 1 min chart.
30 Year Treasury Yield goes to 2.40% this morning. Sub 2.50%
VIX UP again +0.80 to 21.77 so far this morning.
VIX UP again +1.08 to 22.05 so far this morning.
30 Year Treasury Yield goes to 2.38% this morning. Sub 2.50%
VIX UP again +1.16 to 22.13 so far this morning.
Andy Pancholi Special Report (free video)
http://cyclesanalysis.evsuite.com/mtr-brexit-video-optimized/
“FUTURE TURN POINTS”
June 23
July 01/05
July 14/15 – “really, really important”
Remarkable market distortions continue – German 10 year bund yields have gone negative for the first time ever. Talk about market extremes! What I would dearly love to know is who on earth is buying this debt, and how many “greater fools” do they think are available out there to eventually take it off their hands when yields head North?
This really gets scary, where the derrivatives’ makers/clearinghouses most of the time use bonds as collateral. If there are hundreds of billions into the trillion numbers of losses in bonds the derrivative markets are in trouble. And who really knows how big the derrivatives market is? Numbers in the press range from $720 trillion up to $1.2 quadrillion.
That, my friend, is the dirty little secret that no one is even whispering about. Don’t leave all your winnings in your brokerage account…
My only quibble with your post is that you said “if” there are losses… 🙂
whoah… my mind is struggling to come to grips with a quadrillion…
that’s one huge derivative market.
I think when the dust settles people will realise that the market manipulators have been up to the same tricks pretty much as they were prior to the 2007 – 2009 crash. I don’t think folks within the financial industry will be socially acceptable…. I think we’ll all be blamed for the mess.
Just my two cents FWIW of musings….
The SPX has a ways to go catch up with GDOW. It often reverts to the mean and matches it. SPX are white candles and GDOW are the green/red candles… Based on this S&P 500 should be at a low of 2025 to revert.
So far, /ES seems to be respecting the Ichimoku cloud. So it does support bouncing off of the cloud at the daily level. Big thick clouds like this one are bit easier to break through. Conversely, it broke right through the 4H cloud.
GDOW broke into the daily ichimoku cloud.
Jim, I’m not familiar with ichimoku. Do the boundary lines represent lines of resistance/support?
Yes but more complicated and simple at the same time as not the factor in support and resistance. Swe link for a good explanation.
http://stockcharts.com/school/doku.php?id=chart_school:technical_indicators:ichimoku_cloud
See here for good info on practical application. Good pearl sheet at very bottom.
http://hubertsenters.com/ichimoku/
P.S. Lara EW Analysis superior but Ichimoku and PnF charts are useful ways of corroborating status.
Sorry meant to say not the only factor in support and resistance
DAX daily in price bars; SPX blue line. Referencing the June 10th board at 5:28pm by Verne, the link to the Kimble Charting blog. Kimble highlights the American exchanges are following the DAX. One possible count of EW labeling of DAX chart attached. Gives a clearer view of what is happening relative to the SPX price action.
interesting VIX tidbit from Jason Goepfert, Sentiment Trader
https://twitter.com/sentimentrader/status/742436238523650048
“FWIW, there have only been 3 days in 30 years that VIX > 20% when SPX < -.75%. A week later, SPX was -1.2%, -4.4%, -3.5%."
"The dates were 1987-08-11, 2001-07-03 and 2014-12-08."
guess today's VIX action should not be deemed bullish for the stock market…
Interesting. Very interesting. Thank you very much for posting this Philip.
It doesn’t rule out a short term bounce, but it does indicate significant new lows by the end of this week for S&P.
I think something rather big may be brewing…
Look out for surprises to the downside folks! Hold onto your hats just in case!
yes….even if it’s not a big….deep bounce, one thing we all know, markets never go straight up or straight down. even during big sell offs, there will be several opportunities to join.
it may only be a quick slightly overbought situation on a 5 minute chart, but thats all one needs. as long as we are nimble and that
price goes in the direction we want after we enter… 😀
Exactly.
Now, I think I’ll put my order in for it to do it in the afternoon of NY please. So I don’t have to get up in the middle of the night 🙂
https://twitter.com/dondraperclone/status/742472607019081728
“Curiously, 2 of those days (1987-08-11 & 2001-07-03) subsequently saw 20-40% declines within approximately 60 days.”
Yes that is very thought provoking stuff you posted Philip…
ThanQ…
Apparently the kind of volatility perturbations we are seeing may be signaling and impending third wave of high degree. That is great info Philip, and really sheds some light on what may be happening. Confirms we are seeing rare conditions in the market…
First! Now I gotta go read it…
Wow…you’re fast. I guess im 2nd…lol
wow ,,where did she come from? I was going to claim turd, but Alicia beat me,, fast women on this forum,, hee hee (no offense)
Hey!!! Are you playing fast and loose with the ladies??! 🙂
ROFL 🙂
Third 🙁 lol