
This analysis offers detail of how subdivisions are seen within the last bull market which was from March 2009 to May 2015.
Summary: This movement subdivides neatly 5-3-5. This is how 1-2-3 of an unfolding impulse subdivides, and it is also how A-B-C of a zigzag subdivides. The bear wave count sees it as a zigzag. The bull wave count sees it as an incomplete impulse.
CYCLE WAVE A
Click chart to enlarge.
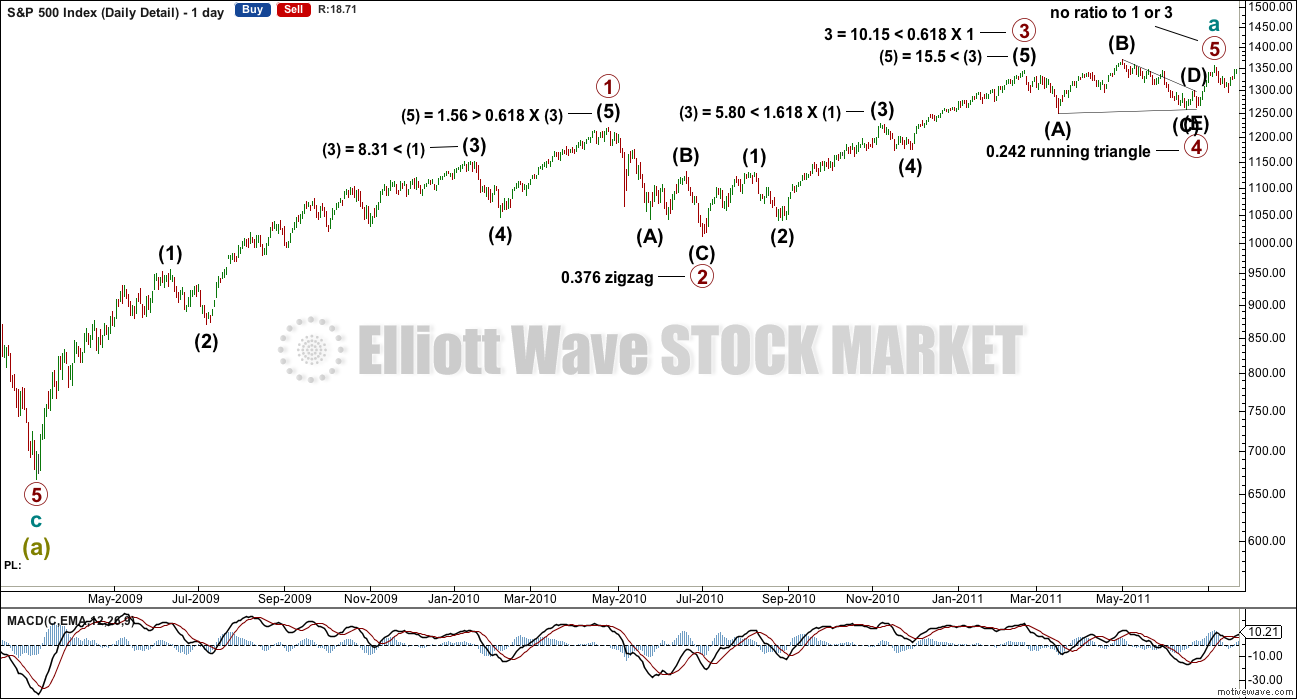
This piece of movement is seen as cycle wave a for the bear wave count and cycle wave I for the bull wave count.
This movement subdivides as a five wave impulse. Primary wave 2 fits as a shallow zigzag and primary wave 4 fits as a more shallow running contracting triangle. There is perfect alternation. There is reasonable proportion: primary wave 4 lasted 86 days while primary wave 2 lasted 47 days. Triangles are more time consuming structures than zigzags.
The only problem I have with this wave count is within the triangle for primary wave 4: the B-D trend line is overshot for two days. Triangles most normally adhere very well to their trend lines, but almost always is not the same as always so occasionally they may be slightly overshot. All rules for a running contracting triangle here are met.
Fibonacci ratios at primary and intermediate degree are noted on the chart. Only primary wave 5 does not exhibit a Fibonacci ratio to either of primary waves 1 or 3. This is pretty typical of the S&P; it will often exhibit a Fibonacci ratio between two of its three actionary waves and not very commonly between all three.
All Elliott wave rules are met for this wave count.
CYCLE WAVE C
Click chart to enlarge.
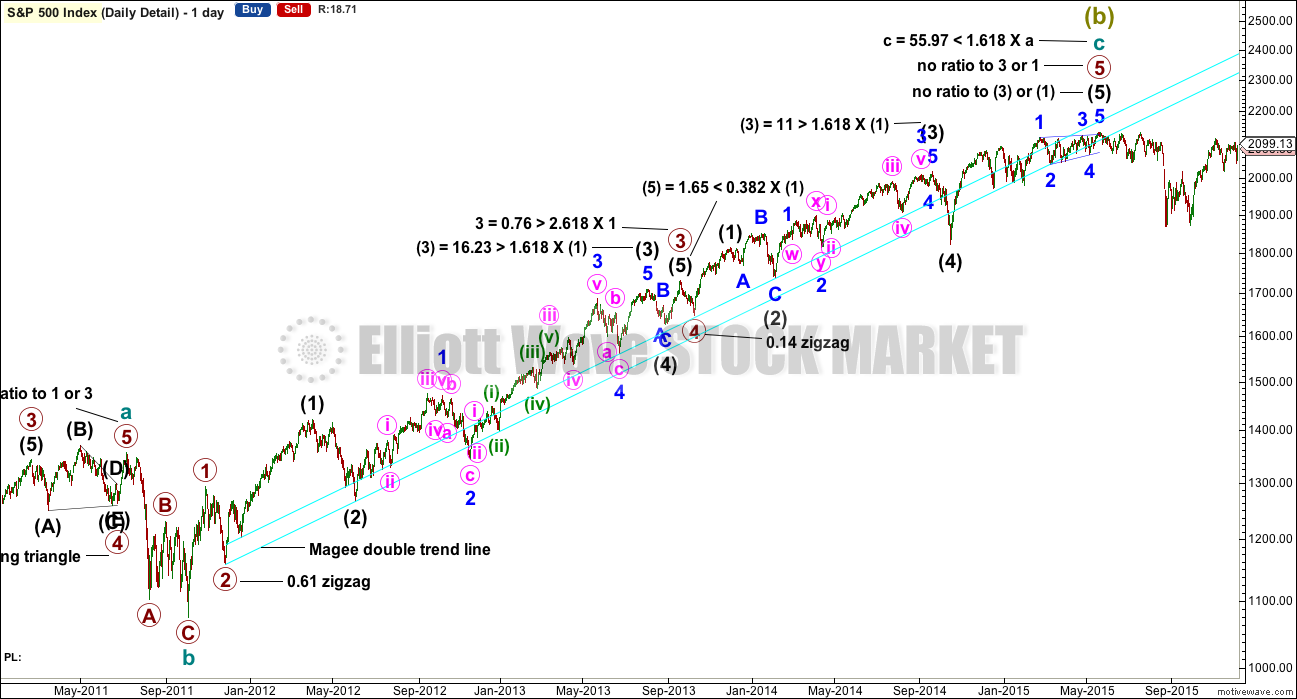
This piece of movement is seen as cycle wave c for the bear wave count and cycle wave III for the bull wave count.
Cycle wave c subdivides perfectly as an impulse.
There is some alternation in depth between primary waves 2 and 4: primary wave 4 is very shallow and primary wave 2 is deep. There is no alternation in structure though as they are both zigzags.
There is an exceptional Fibonacci ratio at primary degree: primary wave 3 is just 0.76 points longer than 2.618 the length of primary wave 1. With primary wave 3 a long extension in price and time lasting 455 days in total, the ratio here is very close indeed.
Intermediate wave (5) completed as an ending contracting diagonal. The 1-3 trend line was overshot at the final all time high, giving the diagonal a typical look. The classic technical analysis equivalent is a rising wedge.
Again, all ratios at intermediate and primary degree are noted, including instances where no ratio was seen. At cycle degree, cycle wave c was 55.97 points short of 1.618 the length of cycle wave a. I consider a wave length to exhibit a Fibonacci ratio if the variation from the exact calculation is less than 10% of the length of the wave. Here 55.97 is less than 10% of the total length of cycle wave c which was 1,059.95 points. Such a definition seems reasonable.
The double cyan trend line is drawn using the approach outlined by Magee in “Technical Analysis Of Stock Trends”. This is a simple approach to find support for a bull market. When the trend line was breached by a close of 3% of market value, it indicated a trend change from bull to bear.
After the lower cyan trend line was breached, it then provided resistance for a throw back.
Conclusion:
No matter how this bull market is seen in the bigger picture, it will only meet Elliott wave rules if it is part of a zigzag, a multiple zigzag or an impulse. If the S&P is seen as within a bull market, then this movement must be seen as part of an impulse.
If this movement is seen as a multiple zigzag (which could be forced to fit, but some Fibonacci ratios would be lost), then it could only be part of a larger bear market.
This analysis is published @ 06:16 p.m. EST on 4th June, 2016.
Gone for the week & just checking in before the night begins…
Waiting for 20% to 30% Down… in one day! 1987 again with a twist… this time it continues down after that. I will check in later in the week.
Stuart,
I posted this below where you give a chart. But I wanted to bring it to the top so that you might have a better chance of seeing it.
Stuart,
Thanks again for your input and chart. Why is it that you think 2118 to 2122 is the spot for a turn around?
Hi Rodney,
There are a couple of areas I will be looking at with a view to a short entry, and this area is one of them for the following reasons.
1) That price will have run a lot of stops
2) There is huge resistance between there and the ATH
3) I don’t believe the ATH will be breached on the first attempt
I’m not convinced that bulls are aggressively buying this market up right now. Retail is net short at almost record highs, and my guess is price is being fuelled by short covering
Basically put, shorts must be destroyed before any kind of meaningful pullback materialises, as the market cannot go down if everyone is short. Once enough shorts are out of the market then the market can pullback.
At the 2118-2122 area I reckon that area will have run a lot of stops of the TA folks (with the balance being above the ATH) That’s my thinking anyway, and in terms of probability, It’s as good a place as any to try a short.
Second area I’m looking to short is above the ATH.
If by some miracle the ATH was breached on first attempt there would be a “whoooosh” and practically every short would be blown out of the game, making that an excellent shorting opportunity. Haven’t spent a lot of time thinking about a price for entry though as I see this as the lowest probability scenario at this time… just mindful of the possibility. If it happens I’ll post thoughts then on price.
Hope this helps
Consider the FTSE… beginning of 3rd wave confirmation was supposed to be when price made a new low below 6,054.74 and a breach of the small pink channel on the daily chart.
We got both those occurrences and now the index is over 220 points higher… That is not bearish – volatile yes, (and i suspect FTSE will be very much so over the coming weeks) but i don’t see that as bearish price action overall, and as long as capital keeps flowing into miners and PM’s keep going up (not sure of the house gold count but i suspect its bullish) then the index will likely continue to be bouyed in the long/intermediate term.
Any thoughts on this?
I think it is smart for traders to think of EW in terms of the larger economic drama that is playing out in the overall economy. I know the analyst simply applies the rules, but I think traders have to give the waves a context whenever possible. In that regard your citing attendant reasons for why you think FTSE may still be in a bull market is understandable. However when I look at other markets, as well as other macro economic indicators, I must say it is very hard for me personally to have a bullish outlook. Interesting that looking at the same circumstances, we draw different conclusions.
FTSE did not breach the small pink channel on the last published daily chart.
Price found support at the lower edge of the channel and has bounced up from there.
FTSE remains below its invalidation point. It has made a series of lower lows and lower highs from the ATH in April 2015. It remains below its bear market trend line, which is relatively steep.
FTSE does not look bullish at this stage.
Anyone think we are in Primary Wave 2 still?
Where we can party like is April 19.
Volatility has been acting like a major top. I would not be surprised.
It’s an idea I’m considering… but intermediate (C) would have a three wave look to it on the weekly chart
FWIW, I have never ever seen a more relentless series of new 52 week lows in UVXY in all the time I have traded it. If I were to envision what a primary top would look like in price action, it would be what took place the last few weeks.
Cesar has been really helpful this morning. While I looked at the screen like a stunned mullet he printed everything out, sat down and calmly took another look.
We’ll have a new wave count for you today, this may still be a primary wave 2. Following a leading expanding diagonal which was complete at the last low. Which is why this upwards move looks like a three.
All the subdivisions fit, there are no truncations and no rare structures. Leading diagonals aren’t rare, they’re just not very common.
Hope springs eternal.
Even as a novice, I always wondered about the brevity of primary wave
I on the weekly bear chart.
woo hoo,,, hail Cesar !!!! you must be referring to the fish,, not the mullet I had in high school..
Lol
Yes Doc, the fish 🙂
The mullet must’ve been in the ’80’s? Many fashion crimes were committed in the ’80’s. I see some resurrected. It wasn’t a good idea the first time around so….
Oh boy.
Honestly Lara… on the balance of probability.. is this still in your opinion, the most likely scenario?
My guess is that we turn down sharply very soon (and i like 2118-2122 for a immediate reversal)
But how far that downturn (should it materialise) takes us remains to be seen, and hopefully will guide us as to what could be playing out in the bigger picture.
Have a look at the attached chart, which has macd and time fibs. Time wise i think this looks about right and aligns with some cycle work i have seen posted here. Also the macd is turning up.
Surely that is not looking bearish at the monthly level?
Am i missing something here?
I’m sorry, no matter what i do i can just not see this as a 2nd with a 3rd to come…sorry 🙁
Maybe the correction drags out more, i dunno, but not hard to count 5 up from Feb lows, and with that it’s likely to be more upside later on in this year after this next correction, in whatever form it takes plays out.
“Oh boy.
Honestly Lara… on the balance of probability.. is this still in your opinion, the most likely scenario?”
I don’t know what you mean by “this”. Do you mean your chart?
I can only publish what I see and what the indicators tell me is most likely.
I am still publishing a bull wave count Stuart, if you think that one is more likely than trade that one.
I am publishing wave counts according to Elliott wave rules and guidelines. I must use all my technical analysis knowledge to then make a judgement on probability.
Volume, volatility, On Balance Volume and ATR are all indicating a high in place or coming up very soon.
As you rightly point out, how low the next move goes and how strong it is will tell us what is likely to be happening.
I have been wrong before Stuart, and I am sure I will be wrong again. If I am wrong again then I do hope there won’t be any gloating, snark or nastiness from anyone. I’m not wrong because I’m doing it wrong, I’m wrong because no matter how much evidence I take into account and now carefully I do my technical analysis, it just doesn’t work as expected all the time.
Low probability outcomes still occur. Which is why I’ll always have alternate wave counts. So we have a road map for what may happen next if I’m wrong.
If I’m wrong then there will still be $$ to be made in a bull market.
Stuart,
Thanks again for your input and chart. Why is it that you think 2118 to 2122 is the spot for a turn around?
I really am beginning to wonder why you are a member here Stuart. You appear to have no confidence in the analysis I am providing and seem to want me to produce analysis which agrees with your outlook.
I am not going to do that. I am going to continue to use all the technical analysis skills I have learned to produce analysis which reflects what I see, not what you want me to see.
And I will be wrong sometimes. No one ever can be always right.
MACD turning up is bullish, yes. Price is bullish so far, yes. But it still has not made a major new swing high.
There are plenty of bearish signals too. All detailed meticulously in my analysis.
VIX (inverted) turned down today Verne, while price went up.
More divergence with VIX.
Volatility increased while price moved higher. That’s not normal.
Yep Lara I noticed. That’s a very big deal. I am not sure how close we are but the volatility warning bells are really clanging so far as I can tell. I am seeing unprecedented extremes in some measures.
Lara’s alternate bear market count still allows for invalidation at 2116
R.I.P Bear. It seems like we hardly knew you.
well there we go,,, one word to describe todays move,, that word is dammit
I don’t think dammit is really strong enough 🙁
Poss current action??? – not much room above before invalidation of Minor 2 count (2111.05)
Yep. Seeing some divergence with VIX atm….
Your count looks good to me; I think we now have a fourth wave correction underway in the form of yet another triangle of some form. We will probably see a thrust right up to the invalidation point…
Getting a bit long for wave four at this degree. Unfortunately, it is also looking to me like consolidation, as opposed to prelude to a terminal wave. If that is true, VIX should go South in a hurry…
We could actually be seeing a truncated fifth underway….upward movement quite weak…
UVXY almost positive despite S&P being well in the green
Buy triggered. Back to fully short…
A green close today and those expecting new highs should take note…
2092.52 my first line in the sand – below there this move down cannot be a W4 imo
Going above 2108.71 now would make this move down look corrective, which may well pave the way to invalidating the Minor 2 count.
Could also do with staying below 2105.21 if we are going to carve out a straight 5 wave move down from todays high
Looking better for the bear case right now. It would be great to close down for the day, perhaps even a bearish engulfing candle. We need to break through the lower line of the channel on the hourly chart. That will give some more confidence.
Welcome back Rodney!
This next wave down should fill this morning’s gap…
I have been here since Friday morning. I had similar feelings to Olga as she expressed that day. Appreciate your comments.
I hear ya. The decibel level can sometimes get somewhat elevated…even an unexpected bit of trolling…very unusual for EWSM….
Perhaps during the hours the market is open, members could keep their comments focused on Lara’s EW count and other TA indicators, charting patterns, and trading strategies. After hours anything goes.
Is it relevant that 2094.76 is the 7601.32% (121393/2584) retracement of 1932 great depression?
Hi Lara,
I am curious, since the introduction of computer trading and also the greater involvement of monetary intervention and stock market manipulation directly or indirectly, do you find it more often that S&P 500 follows Elliot Wave rules? In the years of your experience does it still seem about the same in terms of everything lining up with EW rules? For example, would you say 5 years ago 90% of time you can make it meet EW rules and now 80% or some other way to communicate your impression? Thanks, Jim
I would say the movements of the S&P500 meet EW rules 100% of the time.
I have not yet come across an instance where they don’t.
Governments, banks, large corporates and the FED are all market participants. They are very large participants for sure, but they’re all participants. Within those organisations are human beings making human decisions. Trading generated by computer programs will still have a human bias, the programs were written by human beings.
The markets are still populated by human beings who will still act as a herd. Even if a few of those human beings have a disproportionate effect because the $$ they have is much greater, they’re still part of society and operating within the herd.
That’s my opinion only of course. Others are welcome to disagree, I know it’s not an especially popular opinion.
And as always, I could be wrong. If someone presents evidence which shows I’m wrong then I’m wrong. I’m always open to revise my opinion.
Thank you for commenting on your experience! Good to know EW rules and human nature for the good and the bad continues despite the global scale, algo and manipulation of late. Elliot deserved a Nobel prize from my opinion for characterizing something so fundamental.
Thanks Lara. Always great to step back and look at the big picture. We should have confirmation fairly soon if we have indeed seen a super cycle b top in the markets. I for one would not want to be on the wrong side of that trade. Last week was the tenth time the SPX has risen to challenge the 2100 ceiling in the last sixteen months. It is facing a ceiling of granite. I don’t know how it will affect the wave count but I am now expecting the ultimate head-fake in some kind of throw over of that pivot that will convince everyone of a final break-out to the upside. I think the next upward bankster induced spike will be the shorting opportunity of a lifetime. The upwards movement of late has been labored so we may well fall decisively away from the pivot area next week. Either way, I think the uncertainty will see a resolution soon….
My TA books all tell me that the more often a trend line or price point is tested, the stronger it’s support / resistance becomes.
About 2,100 has as you say been tested multiple times and so far it’s held.
The resistance is very strong. So it seems entirely reasonable to expect it to hold again, on balance of probability it is highly likely.
If we see a head fake then the alternate bear may be in play. That would expect a new high slightly above 2,111.05 to avoid a truncation of minor C. That would surely be a good head fake.
I really hope that alternate is wrong though, it would mean more huge sideways movement for up to another year!
Because leading diagonals in first wave positions are often followed by very deep corrections for the second wave. Think over 90% correction, close to the ATH.
Thank you for this interesting and detailed EW analysis
You’re welcome. I hope it answers your question.
There are of course more ways this upwards move could be labelled. This is just one.
The only thing for sure is it’s either a zigzag, multiple zigzag or impulse. It doesn’t meet the rules for any other EW structure.