
A tiny red daily doji candlestick sits right on the trend line. Both hourly Elliott wave counts remain valid.
Summary: Upwards movement is either over yesterday or it may end slightly higher tomorrow. A breach of the green channel on the hourly chart would provide confidence that upwards movement is over. This would be confirmed by price with a new low below 2,058.35. If a third wave down unfolds tomorrow, then the short term target for minor 3 is at 1,907. The long term target for primary wave 3 remains at 1,423.
To see last published monthly charts click here.
To see how each of the bull and bear wave counts fit within a larger time frame see the Grand Supercycle Analysis.
To see detail of the bull market from 2009 to the all time high on weekly charts, click here.
New updates to this analysis are in bold.
BEAR ELLIOTT WAVE COUNT
WEEKLY CHART
Click chart to enlarge.
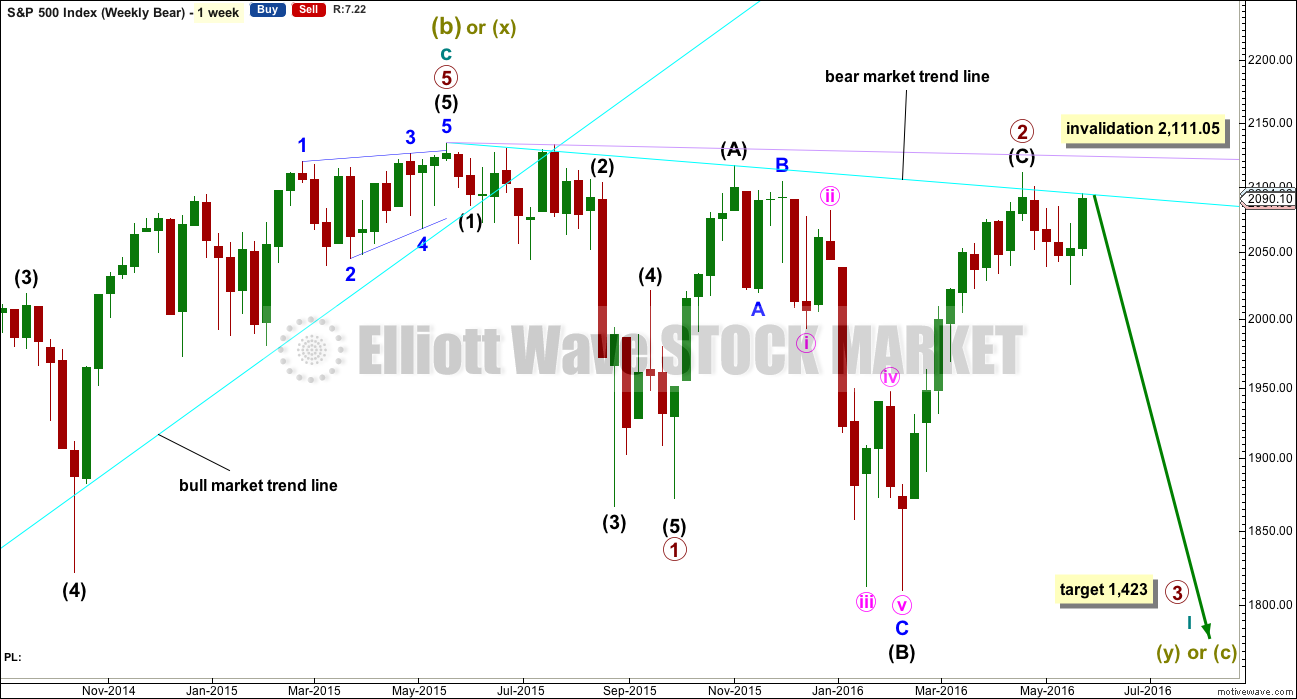
This bear wave count fits better than the bull with the even larger picture, super cycle analysis found here. It is also well supported by regular technical analysis at the monthly chart level.
Importantly, there is no lower invalidation point for this wave count. That means there is no lower limit to this bear market.
Primary wave 1 is complete and lasted 19 weeks. Primary wave 2 is over lasting 28 weeks.
An expectation for duration of primary wave 3 would be for it to be longer in duration than primary wave 1. If it lasts about 31 weeks, it would be 1.618 the duration of primary wave 1. It may last about a Fibonacci 34 weeks in total, depending on how time consuming the corrections within it are.
Primary wave 2 may be a rare running flat. Just prior to a strong primary degree third wave is the kind of situation in which a running flat may appear. Intermediate wave (B) fits perfectly as a zigzag and is a 1.21 length of intermediate wave (A). This is within the normal range for a B wave of a flat of 1 to 1.38.
Within primary wave 3, no second wave correction may move beyond its start above 2,111.05.
DAILY CHART
Click chart to enlarge.
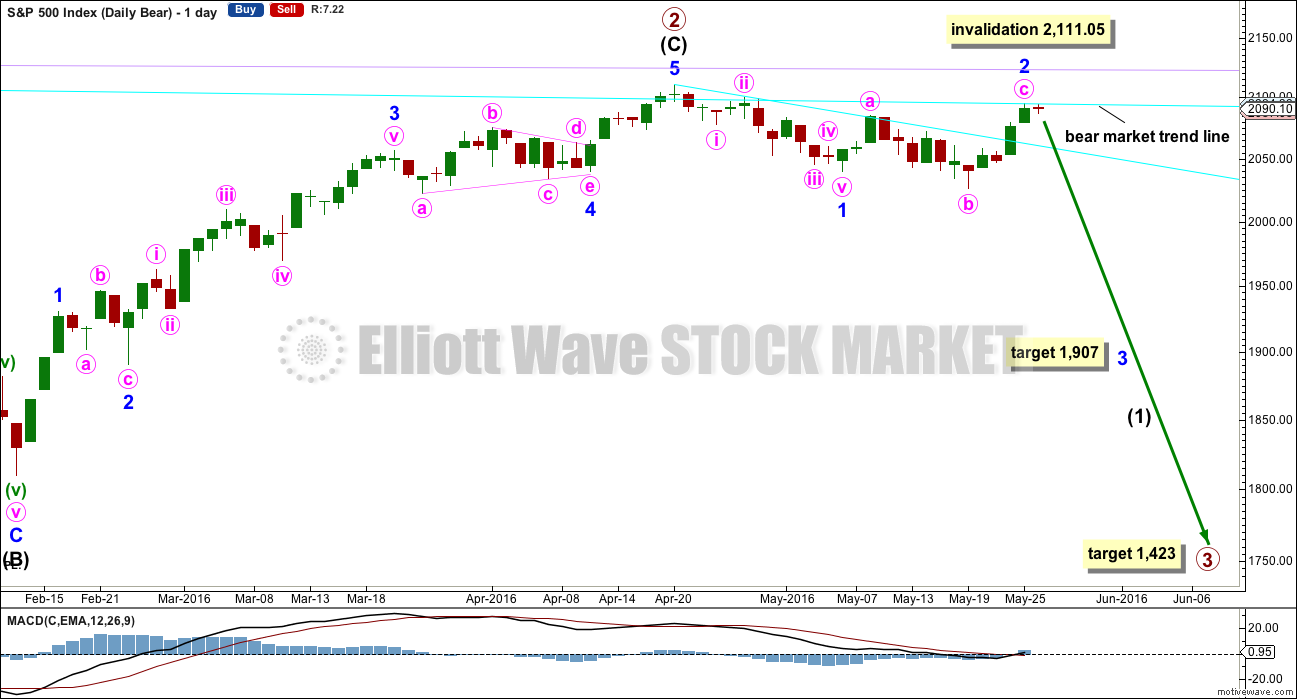
If intermediate wave (C) is over, then the truncation is small at only 5.43 points. This may occur right before a very strong third wave pulls the end of intermediate wave (C) downwards.
The next wave down for this wave count would be a strong third wave at primary wave degree. At 1,423 primary wave 3 would reach 2.618 the length of primary wave 1. This is the appropriate ratio for this target because primary wave 2 is very deep at 0.91 of primary wave 1. If this target is wrong, it may be too high. The next Fibonacci ratio in the sequence would be 4.236 which calculates to a target at 998. That looks too low, unless the degree of labelling is moved up one and this may be a third wave down at cycle degree just beginning. I know that possibility right now may seem absurd, but it is possible.
Alternatively, primary wave 3 may not exhibit a Fibonacci ratio to primary wave 1. When intermediate waves (1) through to (4) within the impulse of primary wave 3 are complete, then the target may be calculated at a second wave degree. At that stage, it may change or widen to a small zone.
With price still finding strong resistance at the bear market trend line, it is reasonably likely that minor wave 2 is over here as an expanded flat correction. If this is where minor wave 3 begins, then at 1,907 minor wave 3 would reach 2.618 the length of minor wave 1.
If minor wave 2 continues any higher to slightly overshoot the bear market trend line, then the target for minor wave 3 will have to move correspondingly higher. Notice that the bear market trend line has been overshot before at the high labelled primary wave 2, so it may be overshot again.
Minor wave 2 may not move beyond the start of minor wave 1 above 2,111.05. This is the risk to short positions at this stage.
If any members are choosing to enter short positions here, then manage risk carefully: Do not invest more than 3-5% of equity on any one trade and always use a stop loss to contain losses.
MAIN HOURLY CHART

Click chart to enlarge.
Minor wave 2 now looks like it may be complete. Minute wave c is 4.67 points short of 1.618 the length of minute wave a.
Ratios within minute wave c are: there is no Fibonacci ratio between minuette waves (i) and (iii), and minuette wave (v) is 1.74 points longer than 0.618 the length of minuette wave (i).
The green channel is a best fit channel about minute wave c. It is slightly redrawn today so that it is more conservative and the same on both this main hourly chart and the alternate below. When this channel is breached by downwards movement, that shall provide trend channel confirmation that the upwards wave of minute wave c is over and the next wave down has begun.
The next wave down for this wave count should show a strong increase in downwards momentum.
The S&P often forms slow curving tops. This may certainly happen here, in the early stages of primary wave 3. Price may find some support at the lower edge of the green channel. When price breaks through support there, then downwards momentum may start to build.
A short first wave down may be followed by an incomplete expanded flat correction for subminuette wave ii. This may end again at the bear market trend line. Subminuette wave ii may not move beyond the start of subminuette wave i above 2,094.73. A new high above this point tomorrow or Tuesday would confirm the alternate hourly wave count below.
ALTERNATE HOURLY CHART
Click chart to enlarge.
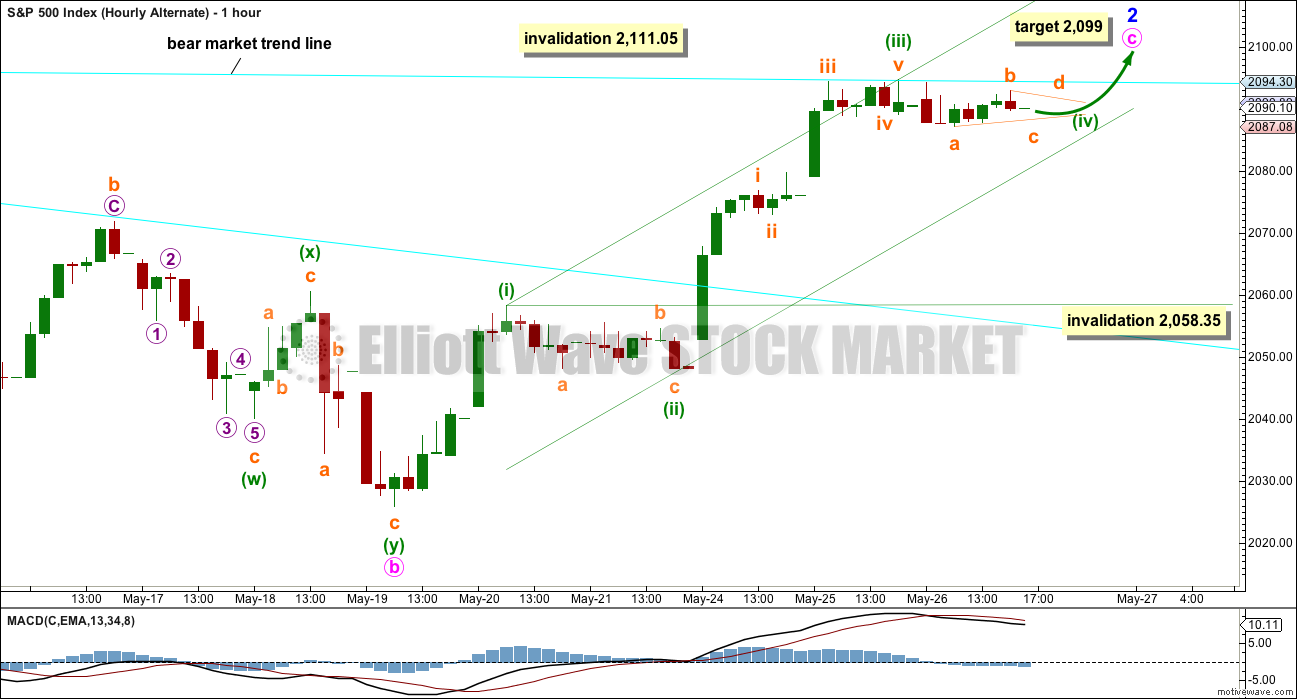
What if minor wave 2 is not over and will overshoot the bear market trend line?
It is possible that within minute wave c only minuette wave (iii) ended at the high for yesterday’s session. There is no Fibonacci ratio between minuette waves (i) and (iii).
There are no adequate Fibonacci ratios between subminuette waves i, iii and v within minuette wave (iii). This slightly reduces the probability of this alternate.
Minuette wave (iv) may show up on the daily chart lasting one to three sessions. This would give minute wave c a clear five wave look at the daily chart level. Minuette wave (iv) may not move into minuette wave (i) price territory below 2,058.35.
Minuette wave (iv) may be unfolding as a triangle as labelled. It may also be a combination or flat correction. All three options would see it exhibit alternation with the zigzag of minuette wave (ii).
The subdivisions for this alternate do not have as neat a fit on the five minute chart as they do for the main hourly wave count. This reduces the probability of this alternate.
BULL ELLIOTT WAVE COUNT
WEEKLY CHART
Click chart to enlarge.
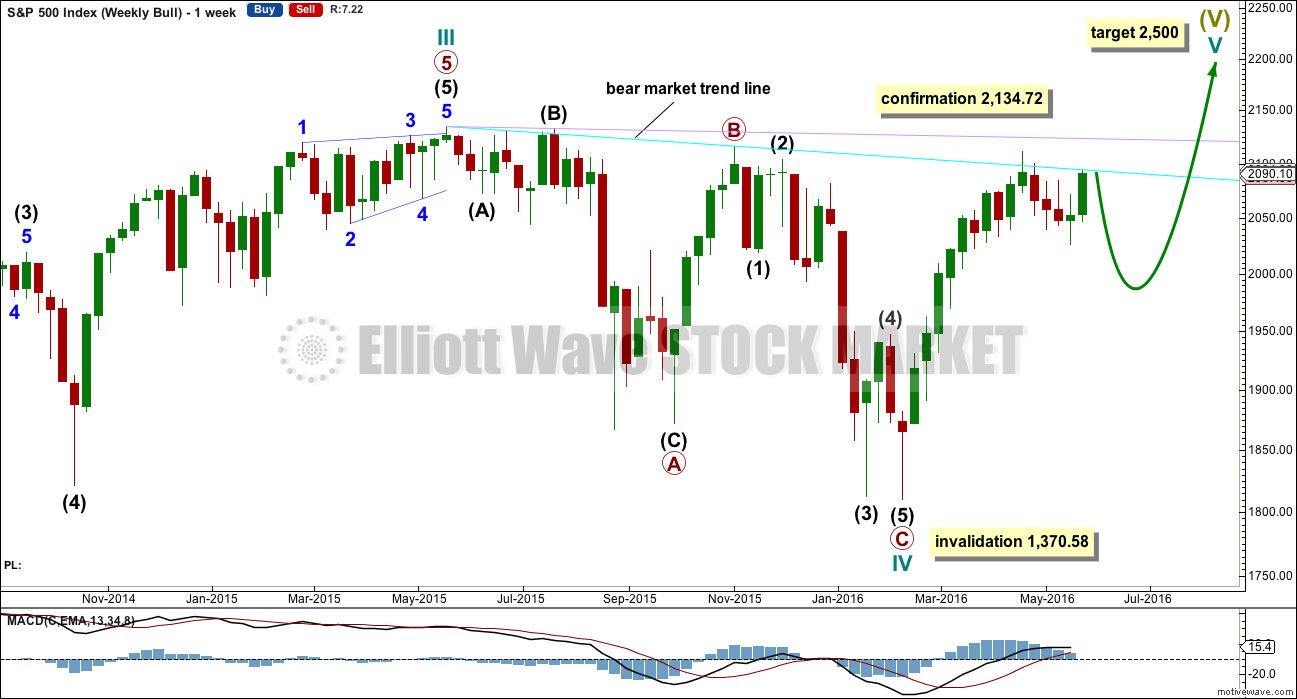
Cycle wave IV is seen as a complete flat correction. Within cycle wave IV, primary wave C is still seen as a five wave impulse.
Intermediate wave (3) has a strong three wave look to it on the weekly and daily charts. For the S&P, a large wave like this one at intermediate degree should look like an impulse at higher time frames. The three wave look substantially reduces the probability of this wave count. Subdivisions have been checked on the hourly chart, which will fit.
Cycle wave II was a shallow 0.41 zigzag lasting three months. Cycle wave IV may be a complete shallow 0.19 regular flat correction, exhibiting some alternation with cycle wave II.
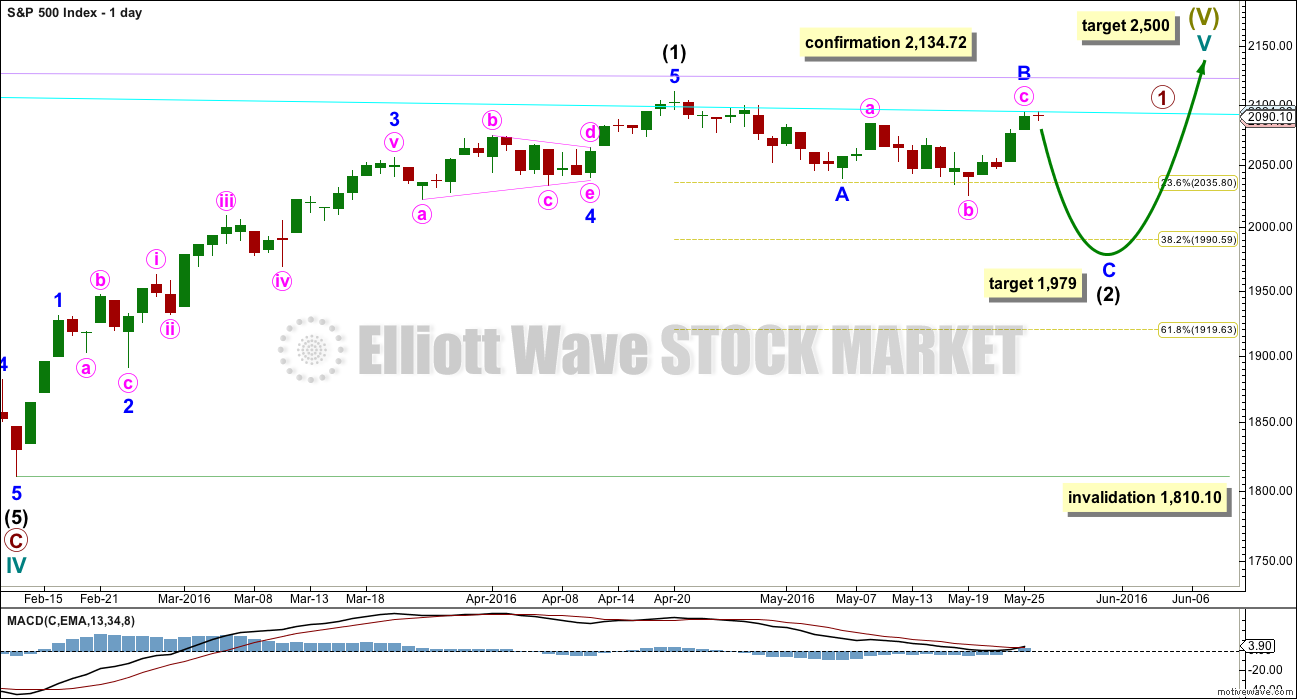
At 2,500 cycle wave V would reach equality in length with cycle wave I.
Price remains below the final bear market trend line. This line is drawn from the all time high at 2,134.72 to the swing high labelled primary wave B at 2,116.48 on November 2015. This line is drawn using the approach outlined by Magee in the classic “Technical Analysis of Stock Trends”. To use it correctly we should assume that a bear market remains intact until this line is breached by a close of 3% or more of market value. In practice, that price point would be a new all time high which would invalidate any bear wave count.
This wave count requires price confirmation with a new all time high above 2,134.72.
While price has not made a new high, while it remains below the final bear market trend line and while technical indicators point to weakness in upwards movement, this very bullish wave count comes with a strong caveat. I still do not have confidence in it.
The invalidation point will remain on the weekly chart at 1,370.58. Cycle wave IV may not move into cycle wave I price territory.
This invalidation point allows for the possibility that cycle wave IV may not be complete and may continue sideways for another one to two years as a double flat or double combination. Because both double flats and double combinations are both sideways movements, a new low substantially below the end of primary wave C at 1,810.10 should see this wave count discarded on the basis of a very low probability long before price makes a new low below 1,370.58.
DAILY CHART
Click chart to enlarge.
If the bull market has resumed, it must begin with a five wave structure upwards at the daily and weekly chart level. That may today be complete. The possible trend change at intermediate degree still requires confirmation in the same way as the alternate hourly bear wave count outlines before any confidence may be had in it.
If intermediate wave (2) begins here, then a reasonable target for it to end would be the 0.618 Fibonacci ratio of intermediate wave (1) about 1,920. Intermediate wave (2) must subdivide as a corrective structure. It may not move beyond the start of intermediate wave (1) below 1,810.10.
In the long term, this wave count absolutely requires a new high above 2,134.72 for confirmation. This would be the only wave count in the unlikely event of a new all time high. All bear wave counts would be fully and finally invalidated.
TECHNICAL ANALYSIS
WEEKLY CHART
Click chart to enlarge. Chart courtesy of StockCharts.com.
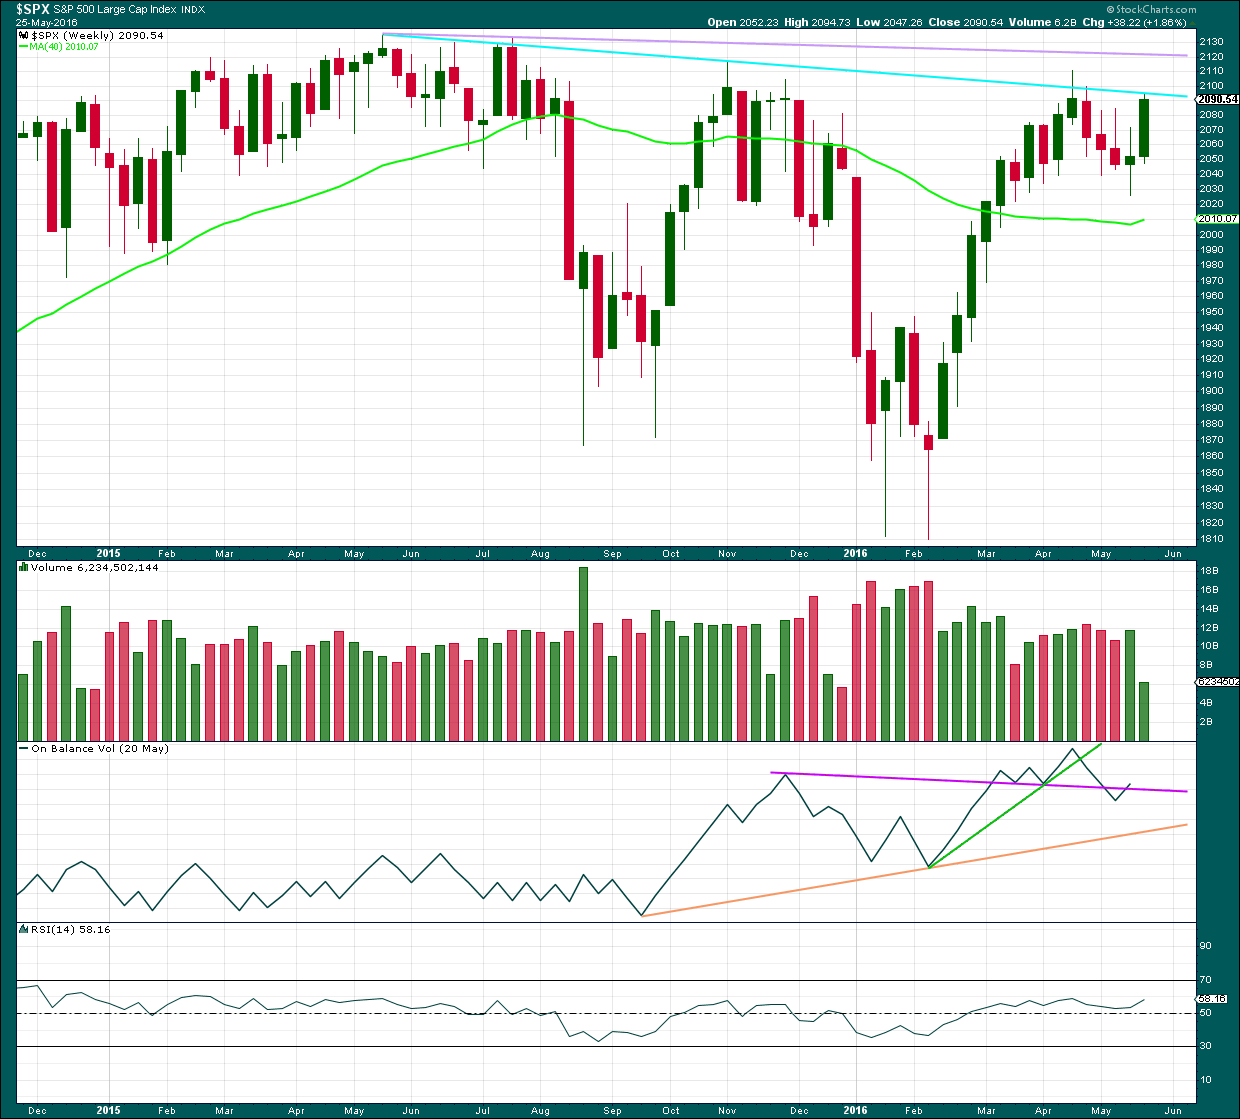
There is a bearish engulfing candlestick pattern at the last high. This has occurred at the round number of 2,100 which increases the significance. Volume on the second candlestick is higher than volume on the first candlestick, which further increases the significance. That it is at the weekly chart level is further significance.
Engulfing patterns are the strongest reversal patterns.
Now this pattern is followed by another red weekly candlestick. The reversal implications of the pattern are confirmed.
This is a very strong bearish signal. It adds significant weight to the expectation of a trend change. It does not tell us how low the following movement must go, only that it is likely to be at least of a few weeks duration.
There is also a Three Black Crows pattern here on the weekly chart. The first three red weekly candlestick patterns are all downwards weeks. The pattern is not supported by increasing volume and only the third candlestick closes at or near its lows; these two points decrease the strength of this pattern in this instance. That the pattern occurs at the weekly chart level increases its strength.
On Balance Volume broke below the purple line and is now returning to just above it. The bearishness of the break below the purple line is negated.
DAILY CHART
Click chart to enlarge. Chart courtesy of StockCharts.com.
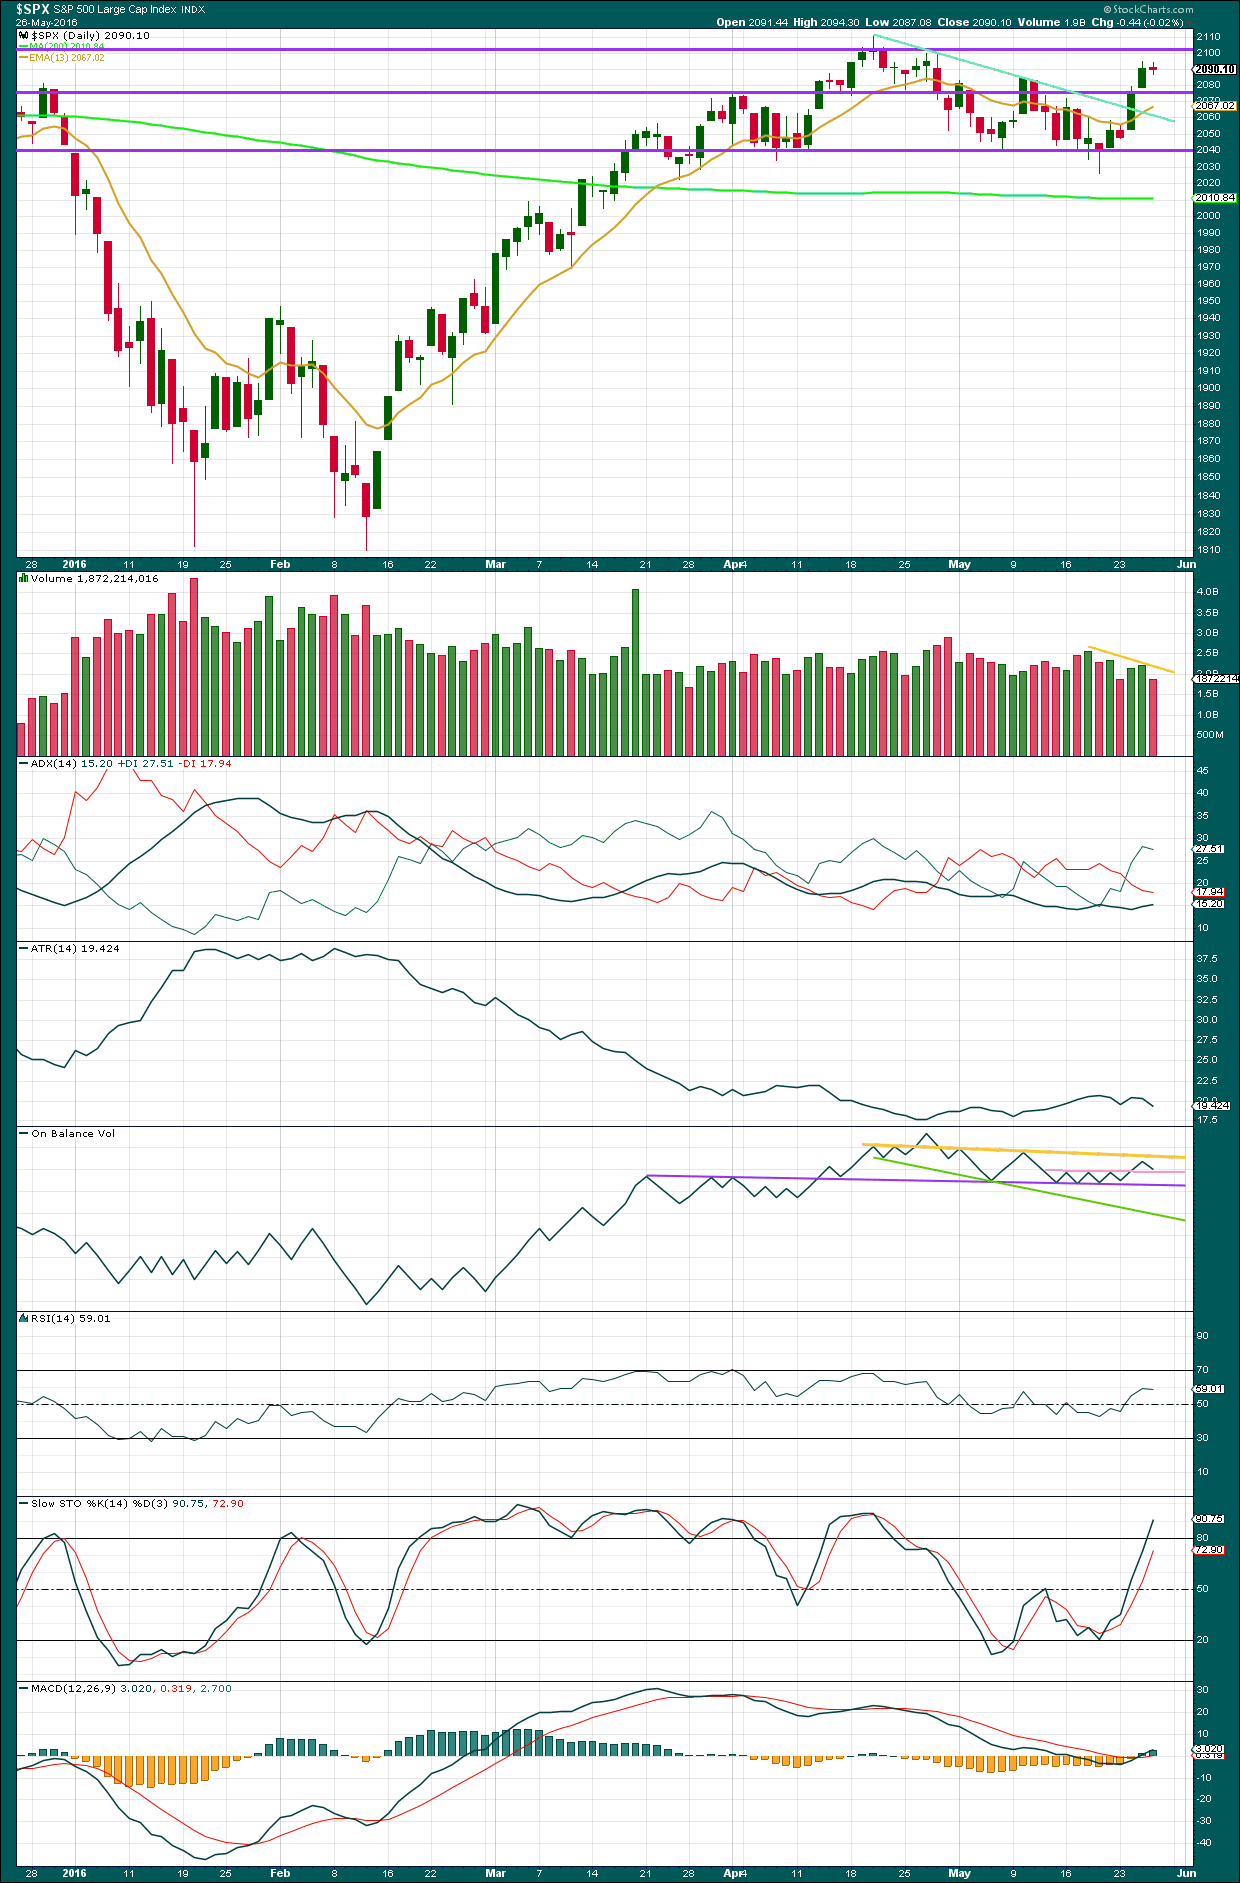
Volume data on StockCharts is different to that given from NYSE, the home of this index. Comments on volume will be based on NYSE volume data when it differs from StockCharts.
A small red doji indicates indecision, a balance between bulls and bears with the bears only very slightly winning for the session. Light volume does not support the fall in price, but for a doji this is not necessarily bullish short term.
Volume overall has been declining since 18th of May (yellow line on volume). Overall, the rise in price was not supported by volume, so it is suspicious. This supports the Elliott wave count which sees this upwards movement as a counter trend movement.
ADX indicates there is a trend and it is upwards. ATR disagrees as it is declining. This also may support the Elliott wave count. There has been a short term upwards trend as price has moved higher overall for four days, but if it is a counter trend movement, then declining ATR would make sense.
On Balance Volume has turned down just below the yellow trend line. It may not get up to the yellow line. If the alternate hourly wave count is correct, then upwards movement from price may be held down by this trend line on OBV, so only one day of upwards movement may be able to unfold before OBV provides strong resistance. A break below the pink line would be a weak bearish signal. A break below the purple line would be a very strong bearish signal, because this line is highly technically significant. A break below the redrawn green line would be another weak bearish signal.
Stochastics is reaching overbought. An end to this upwards swing may be expected to be about here or very soon.
VOLATILITY – INVERTED VIX DAILY CHART
Click chart to enlarge. Chart courtesy of StockCharts.com.
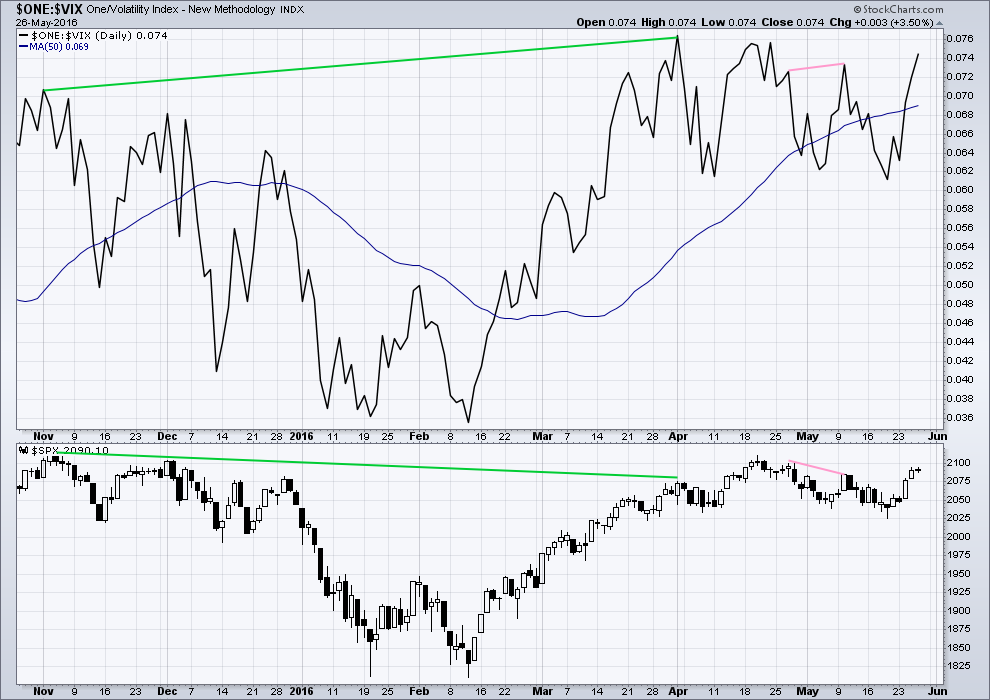
Volatility declines as inverted VIX climbs. This is normal for an upwards trend.
What is not normal here is the divergence over a reasonable time period between price and inverted VIX (green lines). The decline in volatility did not translate to a corresponding increase in price. Price is weak. This divergence is bearish.
The short term divergence noted yesterday has disappeared today. What is very interesting today from VIX is that volatility has declined reasonably substantially on a small sideways day which produced a red candlestick (even though it was a very small one). This decline in volatility today appears to be rather over optimistic; it is not supported by a rise in price. This looks to be a bearish indicator today and supports the main hourly Elliott wave count.
BREADTH – ADVANCE DECLINE LINE
Click chart to enlarge. Chart courtesy of StockCharts.com.
With the AD line increasing, this indicates the number of advancing stocks exceeds the number of declining stocks. This indicates that there is breadth to prior upwards movement.
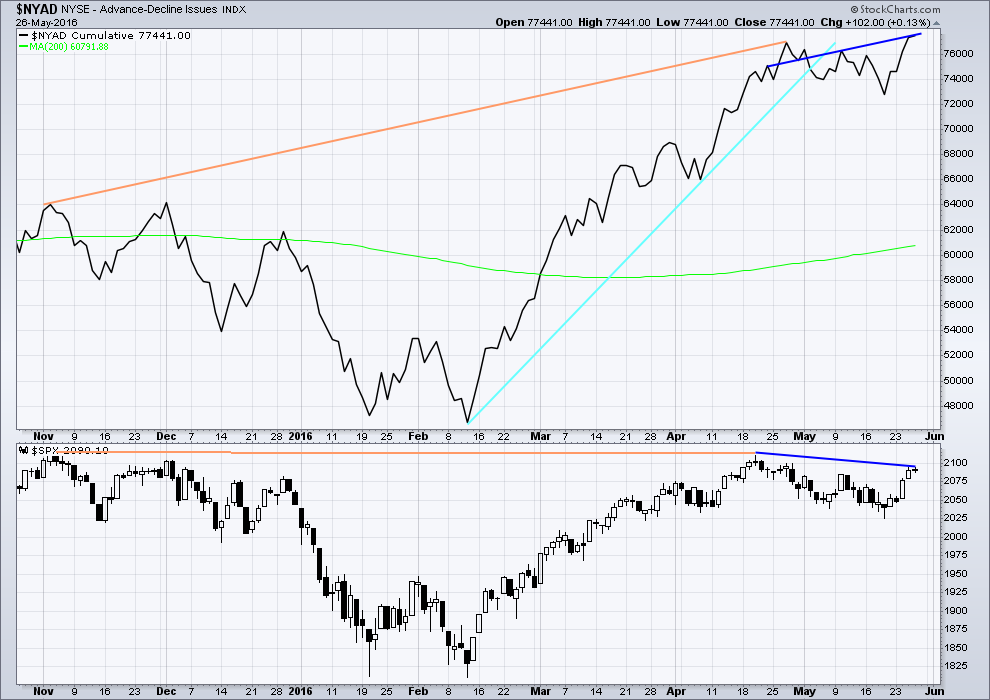
From November 2015 to 20th April, the AD line made new highs while price far failed to make a corresponding new high. This indicates weakness in price; the increase in market breadth is unable to be translated to increase in price (orange lines).
The 200 day moving average for the AD line is now increasing. This alone is not enough to indicate a new bull market. During November 2015 the 200 day MA for the AD line turned upwards and yet price still made subsequent new lows.
The AD line is now declining and has breached a support line (cyan). There is breadth to downwards movement; more stocks are declining than advancing which supports the fall in price.
There is regular bearish divergence today between price and the AD line. Price has made a lower high to the swing high dated 21st of April, but the AD line has made a higher high. This indicates weakness in price.
With divergence between price and the AD line it is reasonably likely that upwards movement is over here. This supports the main hourly wave count.
ANALYSIS OF LAST MAJOR BEAR MARKET OCTOBER 2007 – MARCH 2009
Click to enlarge.
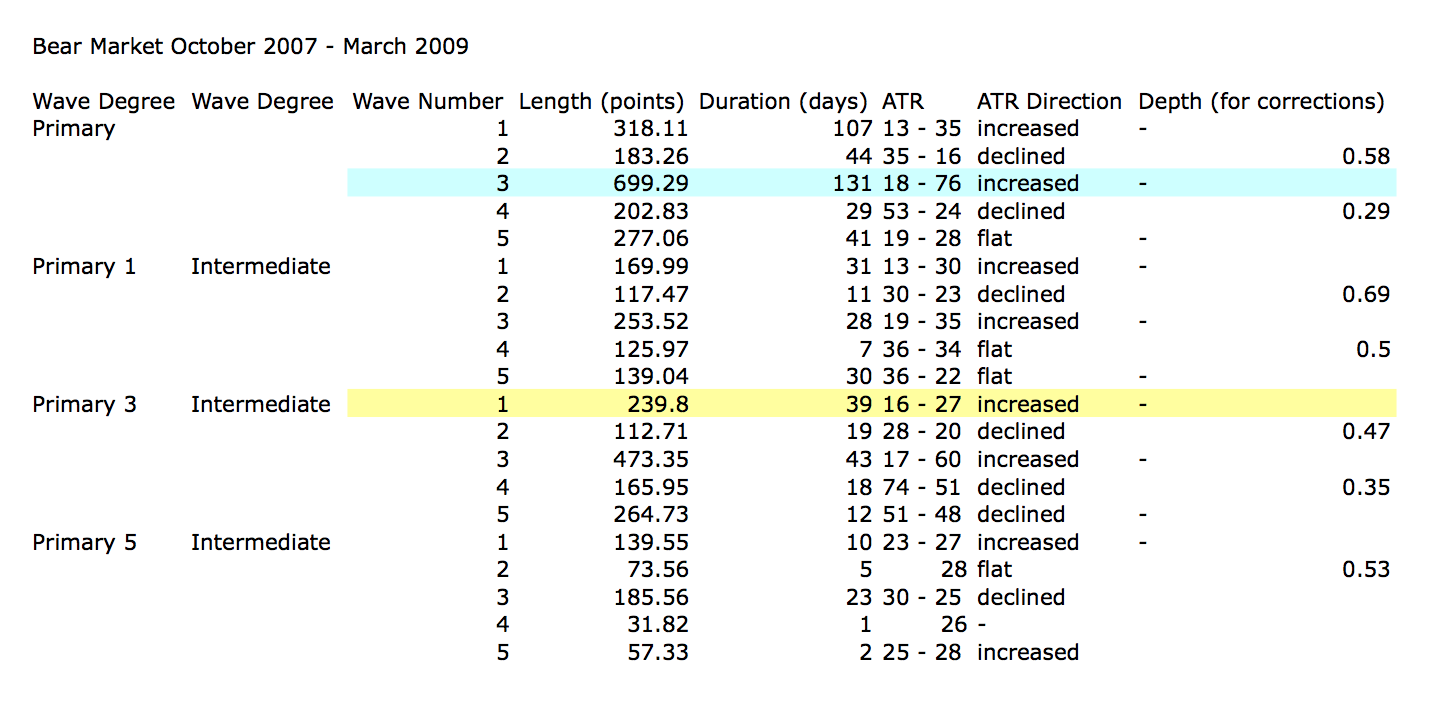
In looking back to see how a primary degree third wave should behave in a bear market, the last example may be useful.
Currently, the start of primary wave 3 now may be underway for this current bear market. Currently, ATR sits about 19. With the last primary degree third wave (blue highlighted) having an ATR range of about 18 to 76, so far this one looks about right.
The current wave count sees price in an intermediate degree first wave within a primary degree third wave. The equivalent in the last bear market (yellow highlighted) lasted 39 days and had a range of ATR from 16 – 27.
To see some discussion of this primary degree third wave in video format click here.
Click chart to enlarge.
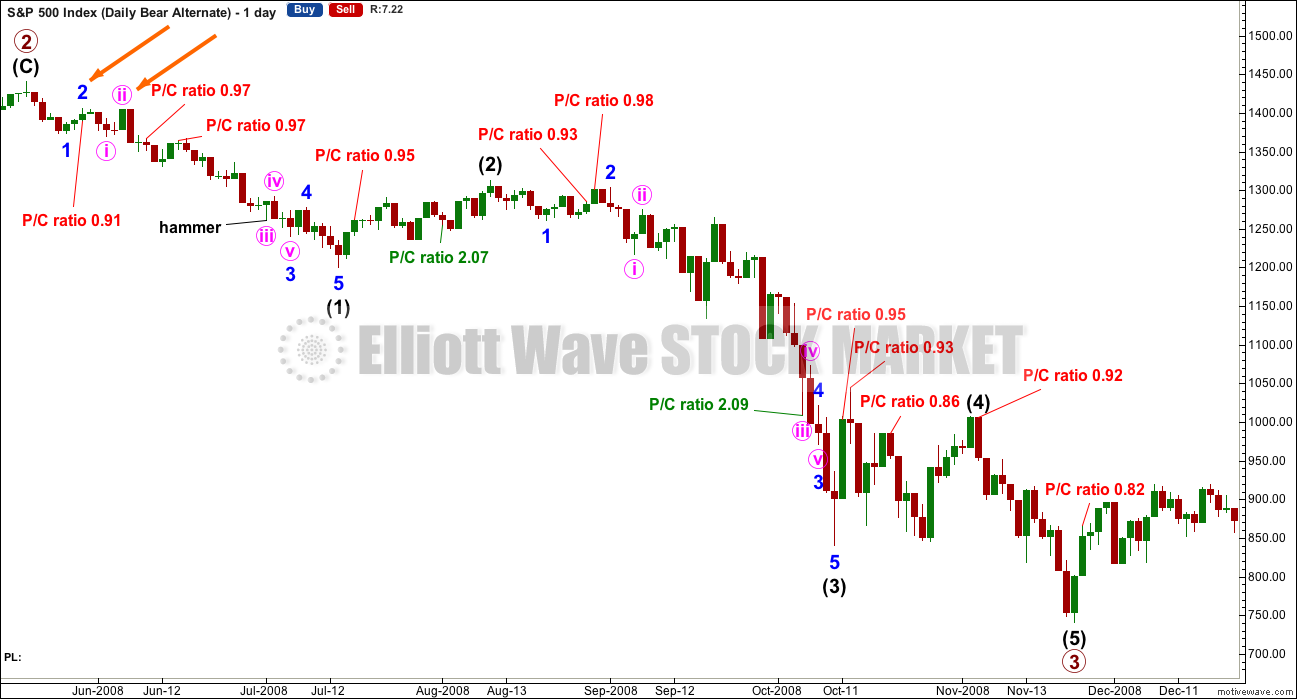
This chart is shown on an arithmetic scale, so that the differences in daily range travelled from the start of primary wave 3 to the end of primary wave 3 is clear.
Primary wave 3 within the last bear market from October 2007 to March 2009 is shown here. It started out somewhat slowly with relatively small range days. I am confident of the labelling at primary degree, reasonably confident of labelling at intermediate degree, and uncertain of labelling at minor degree. It is the larger degrees with which we are concerned at this stage.
During intermediate wave (1), there were a fair few small daily doji and ATR only increased slowly. The strongest movements within primary wave 3 came at its end.
It appears that the S&P behaves somewhat like a commodity during its bear markets. That tendency should be considered again here.
Looking more closely at early corrections within primary wave 3 to see where we are, please note the two identified with orange arrows. Minor wave 1 lasted a Fibonacci 5 days and minor wave 2 was quick at only 2 days and shallow at only 0.495 the depth of minor wave 1.
Minute wave ii, the next second wave correction, was deeper. Minute wave i lasted 3 days and minute wave ii was quick at 2 days but deep at 0.94 the depth of minute wave i.
What this illustrates clearly is there is no certainty about second wave corrections. They do not have to be brief and shallow at this early stage; they can be deep.
This chart will be republished daily for reference. The current primary degree third wave which this analysis expects does not have to unfold in the same way, but it is likely that there may be similarities.
Put / Call ratios are added today from data published at CBOE. This ratio is the index ratio published, not the ratio specifically for the S&P500. It should be a reasonable indicator of sentiment. Only values above 2 and below 1, extremes, are noted. A low P/C ratio indicates more long positions than short, so it is interpreted as bearish, a contrarian indicator. A high P/C ratio indicates more short than long positions, so it is interpreted as bullish, a contrarian indicator.
There were two instances where the P/C ratio gave a bullish extreme above 2 during primary wave 3. One instance happened right at the end of the middle of the third wave. My conclusion is that the P/C ratio may be a reasonable sentiment indicator, but it is not to be taken definitively. It should be one piece of information weighed up alongside other information. Currently, the index P/C ratio is not extreme. Only extremes will be noted.
DOW THEORY
I am choosing to use the S&P500, Dow Industrials, Dow Transportation, Nasdaq and the Russell 2000 index. Major swing lows are noted below. So far the Industrials, Transportation and Russell 2000 have made new major swing lows. None of these indices have made new highs.
I am aware that this approach is extremely conservative. Original Dow Theory has already confirmed a major trend change as both the industrials and transportation indexes have made new major lows.
At this stage, if the S&P500 and Nasdaq also make new major swing lows, then my modified Dow Theory would confirm a major new bear market. At that stage, my only wave count would be the bear wave count.
The lows below are from October 2014. These lows were the last secondary correction within the primary trend which was the bull market from 2009.
These lows must be breached by a daily close below each point.
S&P500: 1,821.61
Nasdaq: 4,117.84
DJIA: 15,855.12 – close below on 25th August 2015.
DJT: 7,700.49 – close below on 24th August 2015.
Russell 2000: 1,343.51 – close below on 25th August 2015.
To the upside, DJIA has made a new major swing high above its prior major high of 3rd November, 2015, at 17,977.85. But DJT has so far failed to confirm because it has not yet made a new major swing high above its prior swing high of 20th November, 2015, at 8,358.20. Dow Theory has therefore not yet confirmed a new bull market. Neither the S&P500, Russell 2000 nor Nasdaq have made new major swing highs.
It is important to note here that traditional Dow Theory (using only DJT and DJIA) has confirmed a bear market and not confirmed the end of that bear market and the start of a new bull market. I would consider Dow Theory to be a solid and effective tool to determine overall market direction. This is another reason why I have little confidence in the alternate bullish Elliott wave count.
This analysis is published @ 09:00 p.m. EST.
The thing I really like about these analyses is the indifference to the noise all around. I find it refreshing. Thank you Lara
Reviewing the data from the last bear market, another remarkable bit of information was how stock buybacks really ramped up even during the depths of the bear market. I will try to find that chart in my archives. There is no question that this probably had a huge impact on the steepness of the market’s fall, especially at the beginning as I remember the chart showing buybacks increasing even as the market decline intensified.
The story is going to be a bit different this time around methinks. Companies are now loaded to the gills with debt from their buyback frenzy the last seven years, with the insiders selling their own shares just as fast as the debt fueled buybacks would allow them. When interest rates begin to inevitably rise, as terror strikes in the heart of all those holders of trillions in corporate bonds over the realization that their principal is in very serious of risk non-repayment, there is going to be an incredible feed-back loop. As rates rise, bond values are going fall, putting immense pressure on bond holders, especially those who have used their bonds as collateral in other deal-making. Rising interest rates will also put a quick end to any more financial engineering in the form of further stock buy-backs, even as the market begins to tank. They will have their hands full trying to service all the debt used to fuel buy-backs on steeply falling top and bottom line revenues. A number of these companies will fail and default on hundreds of billions, if not trillions in bonds. I could go on but you get the picture. Where, oh where, I ask you, is the fear of what’s ahead?! 🙂
How The Next Market Crash Happens
http://seekingalpha.com/article/3977639-next-market-crash-happens
Wait until we start seeing margin calls. Then the money flows will be even worse. Right now we have money flowing into US equities especially large cap because everywhere else, the markets are going down. Got to put that money somewhere.
I sure wish the Federal Reserve Banks had to play by the same rules and get issued margin calls. All they do is print enough money to not need margin.
Margin calls is one of the reasons that I think we will see a precipitous, as opposed to a gradual decline this time around. Margin call redemptions are not leisurely, and would signal the beginning of the end…
David, a good read also. A word of caution about the Markets
http://seekingalpha.com/article/3978296-word-caution-overall-markets
I went back and watched Lara’s video on how the last primary three down developed and it is interesting that she cautioned us about not being thrown off by hesitancy of the downward movement in the initial stages of the move because of the commodity like behaviour of SPX. It’s really quite striking how shallow the decline profile of the intermediate one wave down appears. We could be getting a repeat of 2008. Tuesday will tell! 🙂
Another factor that needs to be considered is that RUT, NYA, NASDAQ and DJTA are all leading down. Only SPX and DJIA of the big indexes are near all time highs. The small caps also called the soldiers, lead the large caps also called generals, down. Soldiers before the generals. But SPX and DJIA should not only also head down, but somewhere along the way they should catch up. When this happens and fear sets in the masses, VIX will go nuts. It won’t surprise me to see VIX at 30 again sometime this year.
But I must admit, it is more than a challenge to hold fast to the iron at the completion of a 2nd wave correction.
I am reminded of another consideration that affects market prices that no amount of sentiment indicators can foresee, and that is exogenous shocks, also referred to by Talib as “Black Swans”. This came in the form of an article where an economist is warning the Social Security could actually end in 2016. Can you imagine what would happen if something like that were proven accurate? The insolvency of the US government (and many others) is not the only ticking time bond waiting to blow up the equities markets. I have always felt it would be the bond market. The entrenched complacency was on spectacular display when Puerto Rico outright defaulted and the market hardly even blinked. It all seems extraordinarily bullish to me. 🙂
http://thesovereigninvestor.com/exclusives/2016-the-end-of-social-security/?z=511245
Vern,
Rational and common sense approach definitely confirms and supports this but these are special circumstances where survival at the top of food chain is at stake. They are going to fight it tooth and nail. Given that others are in similar boat just makes it easier for them to continue the shell game. I am now expecting all time high mid to late next week before some correction (sentiment permitting). S&P might go over to touch 2136 and reaction to that Fibonacci level will tell the tale if a protracted run up is in the wings.
Expecting DJIA to be over 18,200 before some drop.
Vern,
If S&P goes to 2136, is it reasonable to expect UVXY below $9?
A virtual certainty, and probably followed by another reverse split. Failure to fill the 12.20 Tuesday closing gap on Thursday was the first red flag for me personally. Not only did it not not fill the gap on Thursday but we had yet another gap down on Friday. We are either at a very important top in the market, or at the start of a run to all time highs. A gap up open on Tuesday to fill both gaps from Friday and Tuesday would be typical of the start of a major decline and what I would expect for a start of minor three down. A failure to close either gap coupled with an SPX close above 2100 would merit serious reconsideration of the immediate bearish case imho.
I completely disagree… But this time we will all know the resolution within the next two weeks or so.
This is all one BIG CON JOB!
Yes, but as we saw with much of the bull market, a QE fueled con job can go on for years…
hmm,, I hear some sentiment change from members,, wave 2 has done a number on us psychologically,, even if it is the bull count, we are due for a pullback, true ?
I feel better after that adjustment. Thanks Doc. Have a great weekend everybody!
Interesting isn’t it? These amazing series of new 52 week lows in UVXY sure makes it seem like a bigger top than at minor degree. I think the move, whatever direction it takes is going to be bigger and longer than either bulls or bears anticipate. If we go below 10 in UVXY next week It would suggest a lot more upside to come. Another very strange phenomenon is the persistent reports of how bearish everyone is. The other guys observed AAII sentiment at 17 % bullish and argue that this substantially lowers the chances of a protracted decline in the market. They also noted the put/call ratio was as high as 1.13 earlier this month. It is hard for me personally to understand how those facts square with the fact that we are mere percentage points from all time highs in DJI and SPX and the VIX futures derivative has been consistently making new 52 week lows these past several weeks, supposedly a measure of mid term market sentiment. VIX itself is well below historical average also confirming near term complacency. Either the data on bearishness is incorrect, or those measures no longer represent true market sentiment and have somehow become disconnected from what traders are actually doing. Of course some might argue that traders are actually very bearish and that all the market buying has come by way of the banksters! Some think smells really fishy about all this. I am most curious to see what ultimately unfolds. It will be very instructive I am sure!
If things are so bearish, who is bidding up all the stocks?
Price is the ultimate judge. Regardless of how people might say they feel, the market is still going up at an alarming pace.
I spent some considerable time with the P/C ratio from CBOE looking at it during the last primary degree third wave down, and also looked at it currently.
I wouldn’t say that 1.13 is indicative either way. It’s pretty close to neutral.
My conclusion was pretty firmly that it’s only going to be indicative at extremes. Below 2 and above 1 doesn’t look extreme.
During the last P3 down the equivalent point we are at now is minor 2, the high, the end of it. That would be 28th May 2008. On that date the P/C ratio was 1.23. And we all know what happened after that date.
So I really don’t think we should put too much weight on it. That’s why I’m not publishing it daily. I’ll note it if I think it’s extreme, but only then.
Barrons sentiment figures look pretty bullish.
AAII, although it shows 17.8% Bullish… It only shows 29.40% Bearish and 52.90% Neutral
To me this shows Huge Complacency. Which is what we have all seen and feel.
Consensus Bullish Sentiment 71% … This index has been around for decades. If I remember correctly it maxed out at ~84% in April-June 2015 at that %.
I think the other guys are looking for anything to support their change in their preferred count. The AAII is really reaching.
Could be. There is something really strange about their sudden about-face. Why would you suddenly become bullish when all the reasons for your prior bearish stance have become even more pronounced?! I wonder how many of these outfits are taking their orders/cues from unseen masters. Propaganda abounds…. 🙂
Thanks for the historical perspective Lara. I almost get the sense that some of the stuff we are hearing is nothing but propaganda and intended to mislead folk who are leaning bearish into thinking they’ve got it wrong. I was also curious why EWI thought a put/call ration of just 1.13 several weeks ago would be probative of market direction going forward. It is fascinating that the minor two wave of the last P3 peaked so close to the date we have labelled as the top of this one. VIX is hugging its lower BB, so I have to agree with Barons….as David observes, price action and VIX simply do not confirm all the assertions of bearish sentiment. It is very curious that so many are pushing that perspective…..hmmnnnn…..!
Note that AAII has 53% as neutral. If you take out the neutral folks that means the bullishness of those who are actually participating is relatively higher. In other words, of those who think the market has direction and are participating in the market, 35% are bullish.
I think more telling is that the other sentiment measures are much higher than AAII. I am not sure why. But if we throw out the highest and lowest data points, we are still left with a bullish sentiment.
The past two days, I have looked around at sites for a take on perspectives. I have visited some new sites and some I frequent. From what I see, the bullish projections are 3 or 4 to 1 over the bearish. In fact, some who have been bearish for a long time are now turning bullish. This includes other EW analysts. I have seen calls for 2500+ which match Lara’s bull count.
Bottom line for me, I am discounting the bullish / bearish sentiment indicators.
Yeah. It starting to look like it is not just inaccurate, but purely propagandistic.
Rodney… I read your post after I posted above. I agree 100% + what I added.
Go back to my…. They ALL Just LIE posts! Don’t want to keep repeating myself that this is all one BIG CON JOB!
The evidence of a broken economy and fractured markets is all around us. Nonetheless, we cannot underestimate the ability of the banksters to keep things propped up for longer than any of us would have expected. This is one of the reasons I do not expect the start of the next big decline to be halting. I know the last primary three down started slowly but I think the kind of top we are witnessing is going to see a speedy resolution to the downside. These slow overlapping starts to downward moves seems to be evidence that the banksters are still being at least partially successful in resisting the developing new trend. Strong forceful, and clean impulses down will be the first sign, in my opinion, that bearish sentiment has really taken hold. When the market turns in earnest, the banksters will be powerless to stem the tide. In the meantime, I am giving them the respect they are due…. 🙂
Well turns out the alternate was the the one and so far the target looks to be about right.
We shall know on Tuesday I hope.
My shorts are underwater, but that’s okay. It’s not by much and I have confidence in the next wave down turning up before 2,111.05.
Minute c now has a clear five wave look to it on the daily chart. That’s nice.
That may convince a fair few Ellioticians that this upwards move is the start of a new bull run, a five up. Minor 2 may have now done its job, psychologically speaking.
The bear market trend line is overshot. That’s okay. 2,100 is holding… so far.
Tuesday is critical. Price simply must move lower if the wave count is correct. Another pop higher on Tuesday would make me a very nervous Nellie indeed. No Happy Dance would be forthcoming.
There is some slight divergence at todays high with yesterdays high at the hourly chart level between price and MACD.
Its a weak signal though. Fairly often divergence can be noted… only to then disappear.
One small piece of the puzzle only.
The strong weekly candlestick looks very bullish indeed. That too may convince a great many analysts and traders that the next bull run has begun.
Compare this week’s candle to week ending 7/17/2015. Six weeks later the SPX was 250 points lower (roughly 12%).
Or how about the candle for week ending 11/20/2015. Make that 12/24/2015. Four weeks after 12/24 we were down 240 SPX points (roughly 19%).
There are differences in the situations such as price point relative to moving averages. But my point is that a large green weekly candlestick can be quickly reversed.
My shorts are underwater too, actually I think they fell off while trying to swim 🙂
I think I found them downstream a ways,, It says ” Home of the Whopper” on the front,, are those yours?
you found them, thanks!
look how happy John is to get his shorts back,, https://img0.etsystatic.com/035/0/5459790/il_570xN.659010740_6asz.jpg
Doing my happy dance with my shorts on 🙂
Hyuk! Hyuk! 🙂
Be careful with those whoppers; you just might find yourself fighting the “battle of the bulge”! 😀
Thanks Lara:) I always look forward to your end of day analysis trying to make sense of it all 🙂
My heaviest ETF 3x bear I’m in, EDZ, actually went up today by +0.19%. When one compares EDZ to the SPX on a 6 month chart, starting at the stock market high of April 19th, 2016 you can see this EFT really wants to zoom up. In futures short at 2099 flat SPX number. Gap up on Tuesday I will not be happy, we’ll see. Drop down = good.
Double Bottom in SDOW hourly chart with a higher low.
I wish I had more funds to load up more short on Tuesday. But I am all in.
Me too 🙂
Looking at FTSE too…. it’s right at resistance with a strong Stalled pattern… actually four green candlesticks ending with the last two very small real bodies, one a doji. This is a reversal pattern for FTSE.
I’ll update FTSE this weekend and will be entering short early next week myself.
Not liking the persistent trading close to the 2100 pivot. The longer it remains in its vicinity, the greater the likelihood of the market over-taking it. The banksters manged to bust the “sell-in-May” mantra this year. I am going to lighten my short position just a bit and free up a bit of dry powder after today’s price action. Have a great week-end all!
Vern,
I am thinking that counts might change upon the next move that market makes. I don’t think market is going to turn down hard especially how desperately FED and central bankers are pumping money. It will all come crashing down but for now no one wants to break away from this routine. Frankly, I get the feel a lot of smart people working for banisters and FED know what various technical analysis are predicting. Notice how every time we think that this is it, market just throws another wrench.
I think you are correct, there is no evidence at all this market wants to go down. There is a lot of Fed backing and investor expectations it will go up.
While it may try to crash, the Fed will be there with an open wallet to save it.
If the after-hours run up continues we may see a strong gap up Tuesday.
It is indeed a mistake to under-estimate the banksters. It is almost as if they know exactly when to step into the market at critical junctures and distort the waves with massive cash dumps to try and influence market sentiment. We have seen this so often you would have to be blind to not recognize that it goes on. The key question remains whether the bullish sentiment can be maintained in the face of the harsh economic realiites. Royal Dutch Shell just announced another round of massive lay-offs so clearly the picture is not as rosy as many would have us believe. Tuesday I think is a make or break day for the bearish case. We know the FED continues to massively pump, the question is whether they have convinced the crowd that the game is still on. Things looking quite toppy to me so my expectation is that despite the valiant effort, we are due for a trip Southward evidenced by the complete absence of any fear whatsoever. Cheers!
Well, you can be sure the market won’t be going down any time Frau Yellen speaks…
Unless some overseas news of significance hits the market before open on Tuesday, I am tempted to think they will ramp the open on Tuesday to crush some more shorts.
I am almost feeling that perhaps the meaningful correction is going to happen post US election not before…
It’s hard to imagine that a plunge is likely to happen in the near term, with this uber bullishness and Fed support. Unfortunately.
It would take a huge geo-political type event to move the needle.
There is plenty of craziness coming along down the road however.
I am keeping and eye on NDX. As bullish as all this looks, price action outside the BB, like parabolic rises in price, ALL end the same way – with a brutal mean reversion. I have never seen it fail to take place, perhaps a bit delayed, but it always reverts. Based on that principle alone, and assuming that the other indices will trade similar to NDX, a substantial decline is inevitable….unless this is the first time that rule is broken….!
Vern,
If the efforts are to get democrats back in White House, it is given that news on economy will be spun positively and efforts will continue to keep markets at these levels. People see their portfolios doing good, they get the feeling all is well and democrats are the party to support. I have been watching the markets since we were expecting big downturn and how it was supported by fed buying
No question about the political motives of the FED in keeping the markets elevated. In fact, it is my thesis that they are blatant liars about having ended QE and they are still pumping behind the scenes. The interesting thing about that is that the crowd thinks that the FED will be there as a back-stop when the market start to tank. They don’t realise that when that happens it will be irrefutable evidence that their interventionist polices have miserably failed. There will be no back-stopping the next crash. They are already all in.
NASDAQ closes above its BB for the 4th day in a row…
That is very rare indeed…
Last time this happened was May 23-29, 2014 (4 trading days).
This really does look like a last gasp for the bulls…
Confused about this melt up into the close
EW price target has been 2099 for some time now, I’m going short futures there and just place a stop loss in.
Bingo, I am showing 2099 on SPX
SPX closes at the high of the day 2099.06
Three new 52 week lows in UVXY today.
Either a historic interim top, or the prelude to a manic run higher….odds are the former….
Hopefully this will be a blow off top… blasting up into after hours trading.
Prob not short covering either, they likely took advantage of the dip earlier which was a gift to get out. These are longs confident enough to lay down positions in front of a 3 day holiday, thinking Tuesday will be a big gap up.
H&S or not – this market may just go up and up with the blessing of Fedfrau Yellen. The market has gone up in the face of terrible technicals.
And why not, if you just bought into every dip for the last 3 months, you would be golden right now.
Man, what I would give for the elusive face melting waterfall rip down. I hope this is the blow off top we’ve been hoping for – and hope IS a strategy right?
Although expected for the final run-up, it is still shocking to see folk buying the market at these levels. Volume actually higher today as well in this bullish display at the close….
Vern,
FED is probably buying by the truck loads :0
Every time the Frau speaks they a dump truck full of cash ready…
Yep. I think we are going to see a big move next week. If we don’t have futures down big over the week-end I will be a bit concerned about the near term bearish case. If we close above 2100 on Tuesday I would go to cash for the short term until we had a bit more clarity on what Mr Market has up his sleeve…..
Another Bull looking for a 12% move from here.
Wow… they are all over the place saying 10%, 12%, etc., etc.
EDIT 2:36: I see H&S patterns forming on just about every index on the 5 min chart level.
Joseph,
I posted a few days back as MaClellan folks mentioned that H&S talk is over blown and being misread by the Bulls. I will share more stuff later..
SPX hourly BB pinching together. Something’s about to give!
it interesting to see the candle developing on the daily chart
A bearish engulfing candlestick may be in the making in SPX…..
We will know the bears mean business with a move above 12.20 in UVXY. That should lead to some massive short covering before market close…
Yes. If we can close down 3 points or more, we will have a bearish engulfing candle following a doji. The two candles in combination is a very strong reversal signal. One long candle down day to follow is the confirmation, imo.
Here come the banksters with the cash dumps…this ought to be interesting….
We may get some action between now & 2:30 to 3:00PM… then it all goes dead.
The hourly bear wave count may not be invalidated. An upthrust about the line is possible and if we close below the line today I would consider that a very bearish occurrence because it would signal the bulls could not maintain control at that level.
I think EW rules are that any move beyond the invalidation point in any time frame means invalidation. This of course does not militate against your argument for the bearish case. I think the alternate played out… 🙂
True yet invalidation simply means you must choose the next best alternative and that could be an alternate count or simply waiting for the count to reveal itself. Another possibility that Elliot Wave rules do not consider is an alternate technical picture.
The invalidation point for the hourly bear count in 2111.05, which would take minor two past the start of minor one…
The main hourly bear count has been invalidated with a move above 2094.73 From Lara’s written commentary,
“Subminuette wave ii may not move beyond the start of subminuette wave i above 2,094.73.”
I suspect the adjusted main bear hourly count will take yesterday’s completion of minuette v of minute c of Minor 2 and shift it forward in time to today’s high.
Let’s see if we can start heading to 2058 in earnest.
This is my thinking…
Another 52 week low in UVXY???! Amazing. The acme of complacency. No question about it!
“Probably in the coming months a rate move will be appropriate!”
The witch has spoken!
Now go to the Hamptons!
EDIT 1:40: Now I will say this again…
Joseph
May 27, 2016 at 12:58 pm
IT’s all one big con job! They all just LIE! All the TIME!
For… 7 Long Years!
Look for ACTUAL ACTION taken… Ignore everything that is said!
Good one!
VIX on the move. UVXY lagging. We may see another peculiar case of VIX spiking to a high ahead of the Unicorn as happened last August. That could be a bit tricky for those of us trading the beast…I may for the first time try to discern an EW count for the coming run higher….I know….”Good luck with that!” right?! 🙂
Inter-market divergence between SPX and DJI, the former alone making a higher high today…fractured markets indicate weakness…
Short and leveraged. There might be more distribution and chop, but by next Friday I’d expect prices to be much lower than right here.
GLTA
We’re less than 5 points right now from invalidating the bear wave count.
What a great set up to go short here…
Good luck 🙂
it was suppose to be 15 points, but I think everyone knows that!
🙂
No early close today. I thought it would close at 1:00PM
Volume way behind yesterday!
Will probably be the lowest of the year…
That always bullish guy with the black glasses of Asian decent is calling for a 10% up move from here.
Yea… OKAY!!!!
This is facinating to watch – its as if tiny wave v up into 2099 is going to end at the moment Janet Yellen opens her mouth today.
I must say I remained completely befuddled by the breathless expectation of the masses, that anything Frau Yellen has to say today has anything whatsoever to do with reality. Rmarkable that so many supposedly intelligent and informed folk truly expect that the FED will raise rates until and unless they do so forcibly. The next item on the agenda is the implosion of the bond market, at which time they will be forced to raise; they will not do it one nano second before….
The whole thing is just Alice In Wonderland, where words don’t mean anything. A sad sorry state the world “leaders” got us to. All played out in the EW count though!
IT’s all one big con job! They all just LIE! All the TIME!
For… 7 Long Years!
Look for ACTUAL ACTION taken… Ignore everything that is said!
Unlikely that Yellen has any policy statement today – isn’t it a Harvard award ceremony?
Next actual Fed meeting June 6th?
Headline: “Live blog and video of Janet Yellen interview May 27, 2016, 11:20 AM ET”
about interest rates at harvard, along with a speech
OK, thanks.
Thought they were just giving her an award and slap on the back…
Interesting if this moves the markets.
With this low volume the algos can really push things around. And only 15 points from the Alt invalidation.
If we do not get a sharp impulse down just about here I will be taking a second look….classic thrust out of the triangle formation. Under bearish circumstances it should be immediately reversed to the downside…
They did make that run at the pivot after all on the fifth wave up….
Daily SPX zoomed up. Taking length of (a) x 1.618 then wave (c) of [b] target is 2099.29.
Peter, may I ask what larger degree count you are using. I take it you have discounted we are completing minor w2?
My opinion, count, is Primary wave III topped in May of 2015. Since then A down August 24th, 2015. B up into Oct. 2nd, 2015. C down into Feb.8th, 2016. D or X up into April 19th. Then who knows what down now….could be an E or the start of another A-B-C. Lasting long into 2017. Whenever that bottom of Primary IV is, then Primary V up. I still have something really bad showing for the year 2022. Trying to think what it is, maybe the top, or bottom, of Primary V for the supercycle or grandsupercycle. And that is going back ~500 years B.C.. Matches up with really interesting dates such as the first stock market opening in Philly in the USA (it was not NYC). The great depression, etc..
Thank you Peter.
Last time NASDAQ had 3 candle bodies above its BB, and also closed above the BB also was June 1, 2014. This is either a raging bull market about to expand upwards after it takes a sideways breath, or its one of the most overbought conditions we’ve seen in a very long time…
This is great risk/reward ratio…
Good find Ari. On June 1st 2014, both of the Bolinger bands on the daily Nasdaq were pointing up. Today the top band is pointing up and the bottom band downwards. The BB is widening. This will help allow more downside it Minor 3 materializes.
Yep, Memorial Day weekend. Where investors at their Hamptons’ summer homes to campsite campfires realize the fed communicated they are going to raise interest rates, the markets didn’t crash so the fed feels invincible, thus no more QE cocaine money needed. And corporate earnings declined by 7+% despite the huge corporate stock buybacks. Could all equal the weekend of a top in the markets.
I know this is a pure technical analysis website – but on a fundamental basis – I agree Peter , zero interest rates / zero cost of capital , have lead to cheep leverage in financial markets . Now with the cost of short term borrowing increasing , I can no longer borrow at 3 % and buy a stock yielding 4 % . Higher rates have to take some air out of the mkt .
According to my data feeds we have a new high above 2094.73. Thus the main hourly bear count is invalidated and the alternate hourly is on the table.
We also have a gap down open on UVXY. Now we look for a reversal later in the day to fill the gap and end the day with a daily green candlestick.
I have to say that I like the alternate, despite its lower probability. As a matter of fact, going with the lower probability wave count has recently quite often been the right call!
I know the SPX makes rounding tops but I am not convinced that the start of this third wave down at multiple degrees is going to display the kind of tentative hesitancy we have been seeing in the decline so far. The final thrust up out of the triangle would be a perfect completion to the move and an exquisite hook for eager bulls to be reeled in just before the reversal after the final wave up. If a third is at hand, I would expect the reversal to be immediate, relentless, and spectacular. None of us will be still wondering if a third down is underway…time to sit back and enjoy the ride!
So you think the 3rd wave will be a Magic Carpet Ride. I been waiting for a long time. It is elusive and has not shown up yet. Makes one wonder if it ever will show up. When it does, it is sure to be a wild ride. One could say it was Born To Be Wild.
Steppenwolf,,, get your motor runnin,, get out on the highway,,, sorry if that was a bit pitchy
Yeah. I am determined not to get too excited…until it’s time to get excited…it has been quite a long wait…..it is entirely possible that it could get even longer… 🙂
Hi Lara,
1.) Why are you selecting the wave three target at 2.618 down at 1907 instead of 1.618 for wave 3?
2.) The P/C ratio is a good addition. I recall that There is a website that used to check this but they did a 10 day moving average of the puts/calls and noted extremes during those time periods were better at marking tops/bottoms. I think it may have been Don Hays Advisory. He had a lot of good charts in there. It is a subscription site. I haven’t been there in a while.
Cheers,
Dermot
1) Because minor 2 is very deep, so far 0.77 of minor 1. When a second wave is deeper than 0.618 the first the third is more likely 2.618 than 1.618 of the first. IME.
2) Thanks for the tip. I’ll look into it.
I am here, first in line, now I will go read the analysis,, so don’t bother me when I’m reading.
ok Im done,, I graduated from the sped redding course, you can now proceed to bother me.
Bother ☞