
Last analysis expected upwards movement, which is exactly what happened.
Summary: The downwards trend is not in doubt but short term how high a bounce goes is unclear. The main hourly wave count expects upwards movement for another one or two days to a target at 2,099 to complete minor wave 2. Look for price to find resistance at or just above the bear market trend line.
To see last published monthly charts click here.
To see how each of the bull and bear wave counts fit within a larger time frame see the Grand Supercycle Analysis.
To see detail of the bull market from 2009 to the all time high on weekly charts, click here.
New updates to this analysis are in bold.
BEAR ELLIOTT WAVE COUNT
WEEKLY CHART
Click chart to enlarge.
This bear wave count fits better than the bull with the even larger picture, super cycle analysis found here. It is also well supported by regular technical analysis at the monthly chart level.
Importantly, there is no lower invalidation point for this wave count. That means there is no lower limit to this bear market.
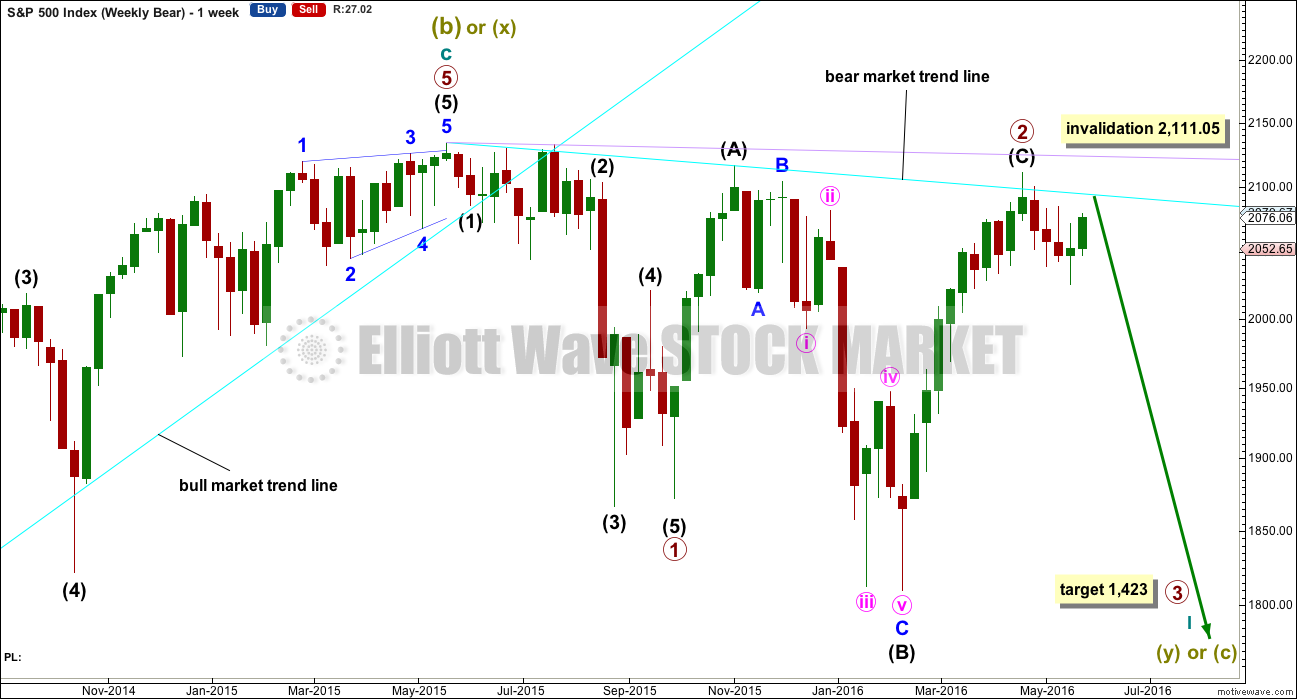
Primary wave 1 is complete and lasted 19 weeks. Primary wave 2 is over lasting 28 weeks.
An expectation for duration of primary wave 3 would be for it to be longer in duration than primary wave 1. If it lasts about 31 weeks, it would be 1.618 the duration of primary wave 1. It may last about a Fibonacci 34 weeks in total, depending on how time consuming the corrections within it are.
Primary wave 2 may be a rare running flat. Just prior to a strong primary degree third wave is the kind of situation in which a running flat may appear. Intermediate wave (B) fits perfectly as a zigzag and is a 1.21 length of intermediate wave (A). This is within the normal range for a B wave of a flat of 1 to 1.38.
Within primary wave 3, no second wave correction may move beyond its start above 2,111.05.
DAILY CHART
Click chart to enlarge.
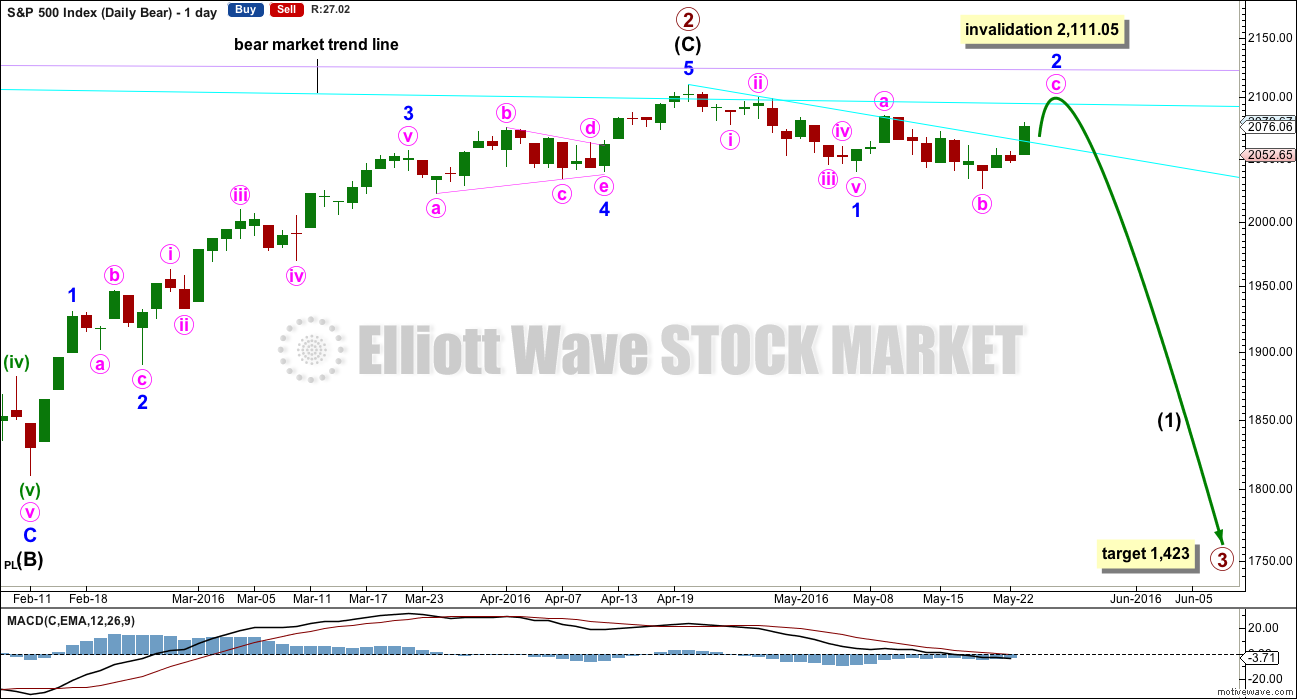
If intermediate wave (C) is over, then the truncation is small at only 5.43 points. This may occur right before a very strong third wave pulls the end of intermediate wave (C) downwards.
The next wave down for this wave count would be a strong third wave at primary wave degree. At 1,423 primary wave 3 would reach 2.618 the length of primary wave 1. This is the appropriate ratio for this target because primary wave 2 is very deep at 0.91 of primary wave 1. If this target is wrong, it may be too high. The next Fibonacci ratio in the sequence would be 4.236 which calculates to a target at 998. That looks too low, unless the degree of labelling is moved up one and this may be a third wave down at cycle degree just beginning. I know that possibility right now may seem absurd, but it is possible.
Alternatively, primary wave 3 may not exhibit a Fibonacci ratio to primary wave 1. When intermediate waves (1) through to (4) within the impulse of primary wave 3 are complete, then the target may be calculated at a second wave degree. At that stage, it may change or widen to a small zone.
If minor wave 2 is incomplete, then it may not move beyond the start of minor wave 1 above 2,111.05.
If minor wave 2 continues higher, then it may end when price finds resistance again at the bear market trend line. First, it needs to break above resistance at the short term bear market trend line.
MAIN HOURLY CHART
Click chart to enlarge.
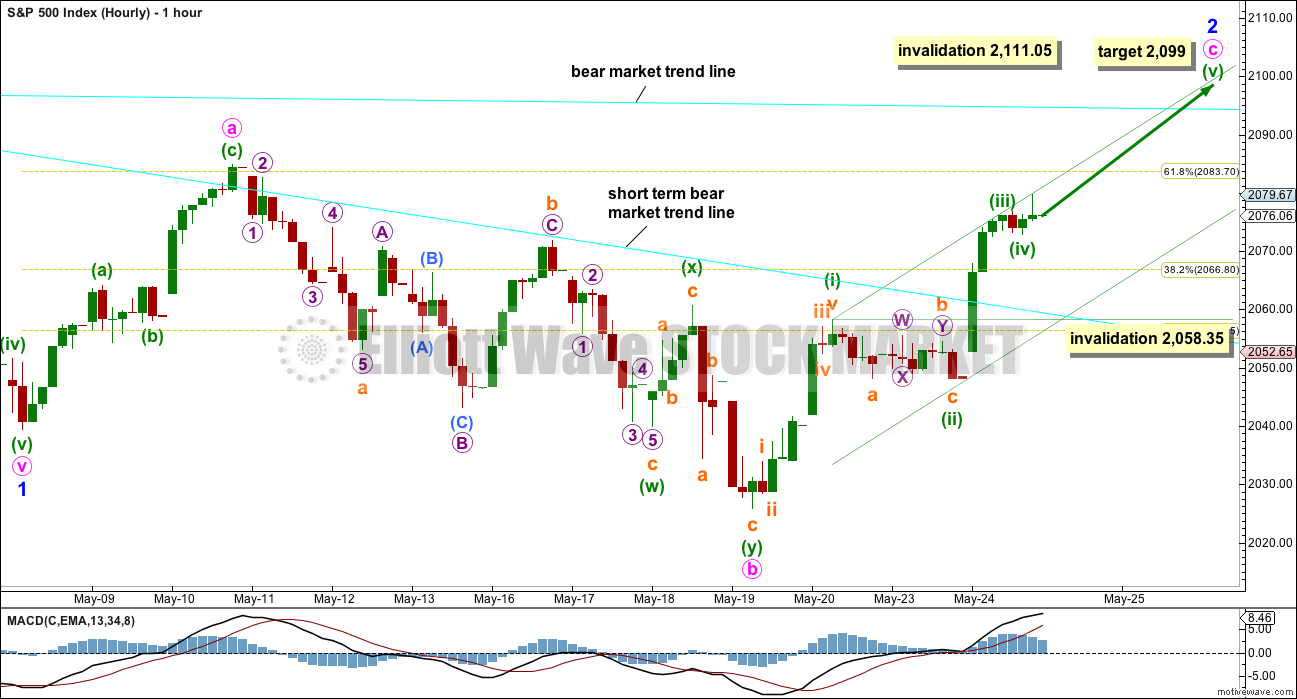
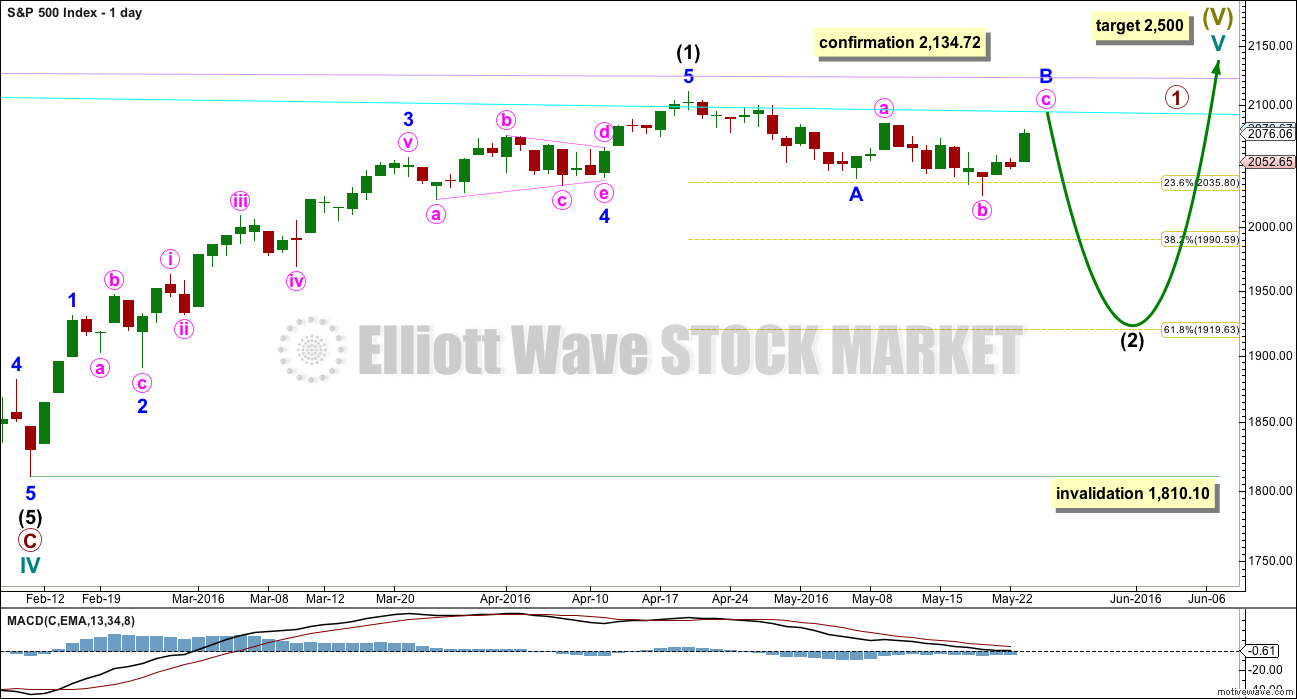
Minor wave 2 looks like an incomplete expanded flat correction. Within the flat, minute wave a is a complete three, a zigzag. Minute wave b is also a three, a double zigzag, and at 1.30 length of minute wave a is nicely within the normal range of 1 to 1.38.
The subdivisions of minute wave b fit perfectly on the hourly and five minute charts. Within the double zigzag, minuette wave (x) is brief and shallow and minuette wave (y) moves below minuette wave (w) deepening the correction and achieving its purpose. The structure has a downwards slope and looks like a reasonable double zigzag.
At 2,099 minute wave c would reach 1.618 the length of minute wave a. This would see minor wave 2 end with a slight overshoot of the bear market trend line and close to the round number pivot of 2,100, both of which should provide very strong resistance.
If this wave count is right, then we may be offered a gift from the market for the perfect short entry to ride primary wave 3 down.
Minute wave c must subdivide as a five wave structure and so far is unfolding as an impulse. Within minute wave c, minuette wave (iii) may have completed during Tuesday’s session. If that is correct, then minuette wave (iii) is slightly shorter than minuette wave (i). This limits minuette wave (v) to no longer than equality with minuette wave (iii) at 2,101.07, so that minuette wave (iii) is not the shortest and the core Elliott wave rule is met.
If my labelling within minute wave c is wrong today, it may be because of expecting minuette wave (iv) to be over already. The structure does fit on the five minute chart, but it may be too brief. It may be that only subminuette wave a of a larger triangle or flat is complete. If minuette wave (iv) continues further sideways and lower tomorrow, then it may not move into minuette wave (i) price territory below 2,058.35.
I would not entertain the possibility that minute wave c and so minor wave 2 could be over at today’s high. Minute wave c would be truncated by 5.2 points, which for these small waves is substantial (11% of minute wave a and 9.7% of minute wave c). The truncation is far too large to be seriously considered. The conclusion must be that price is very likely to move higher over the one or two days.
If minor wave 2 is to total a Fibonacci thirteen daily candlesticks, then it has only one day left in which the structure must complete. It may be able to do this now.
BULL ELLIOTT WAVE COUNT
WEEKLY CHART
Click chart to enlarge.
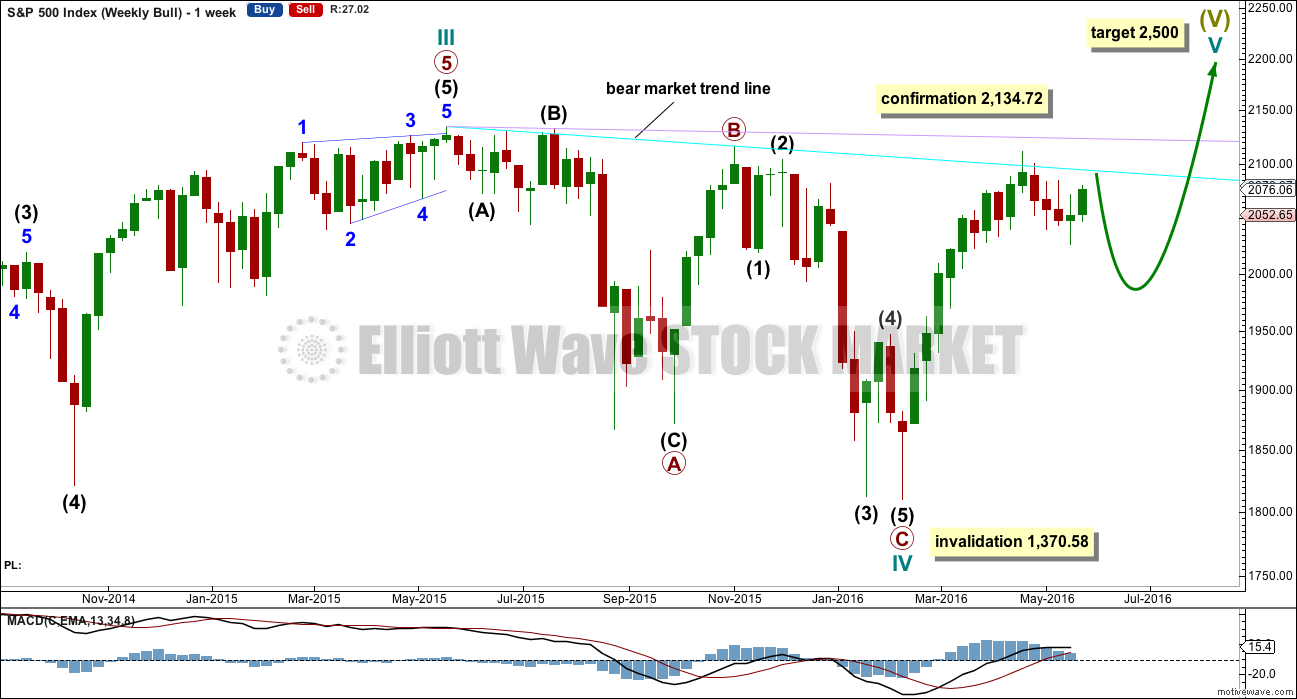
Cycle wave IV is seen as a complete flat correction. Within cycle wave IV, primary wave C is still seen as a five wave impulse.
Intermediate wave (3) has a strong three wave look to it on the weekly and daily charts. For the S&P, a large wave like this one at intermediate degree should look like an impulse at higher time frames. The three wave look substantially reduces the probability of this wave count. Subdivisions have been checked on the hourly chart, which will fit.
Cycle wave II was a shallow 0.41 zigzag lasting three months. Cycle wave IV may be a complete shallow 0.19 regular flat correction, exhibiting some alternation with cycle wave II.
At 2,500 cycle wave V would reach equality in length with cycle wave I.
Price remains below the final bear market trend line. This line is drawn from the all time high at 2,134.72 to the swing high labelled primary wave B at 2,116.48 on November 2015. This line is drawn using the approach outlined by Magee in the classic “Technical Analysis of Stock Trends”. To use it correctly we should assume that a bear market remains intact until this line is breached by a close of 3% or more of market value. In practice, that price point would be a new all time high which would invalidate any bear wave count.
This wave count requires price confirmation with a new all time high above 2,134.72.
While price has not made a new high, while it remains below the final bear market trend line and while technical indicators point to weakness in upwards movement, this very bullish wave count comes with a strong caveat. I still do not have confidence in it.
The invalidation point will remain on the weekly chart at 1,370.58. Cycle wave IV may not move into cycle wave I price territory.
This invalidation point allows for the possibility that cycle wave IV may not be complete and may continue sideways for another one to two years as a double flat or double combination. Because both double flats and double combinations are both sideways movements, a new low substantially below the end of primary wave C at 1,810.10 should see this wave count discarded on the basis of a very low probability long before price makes a new low below 1,370.58.
DAILY CHART
Click chart to enlarge.
If the bull market has resumed, it must begin with a five wave structure upwards at the daily and weekly chart level. That may today be complete. The possible trend change at intermediate degree still requires confirmation in the same way as the alternate hourly bear wave count outlines before any confidence may be had in it.
If intermediate wave (2) begins here, then a reasonable target for it to end would be the 0.618 Fibonacci ratio of intermediate wave (1) about 1,920. Intermediate wave (2) must subdivide as a corrective structure. It may not move beyond the start of intermediate wave (1) below 1,810.10.
In the long term, this wave count absolutely requires a new high above 2,134.72 for confirmation. This would be the only wave count in the unlikely event of a new all time high. All bear wave counts would be fully and finally invalidated.
TECHNICAL ANALYSIS
WEEKLY CHART
Click chart to enlarge. Chart courtesy of StockCharts.com.
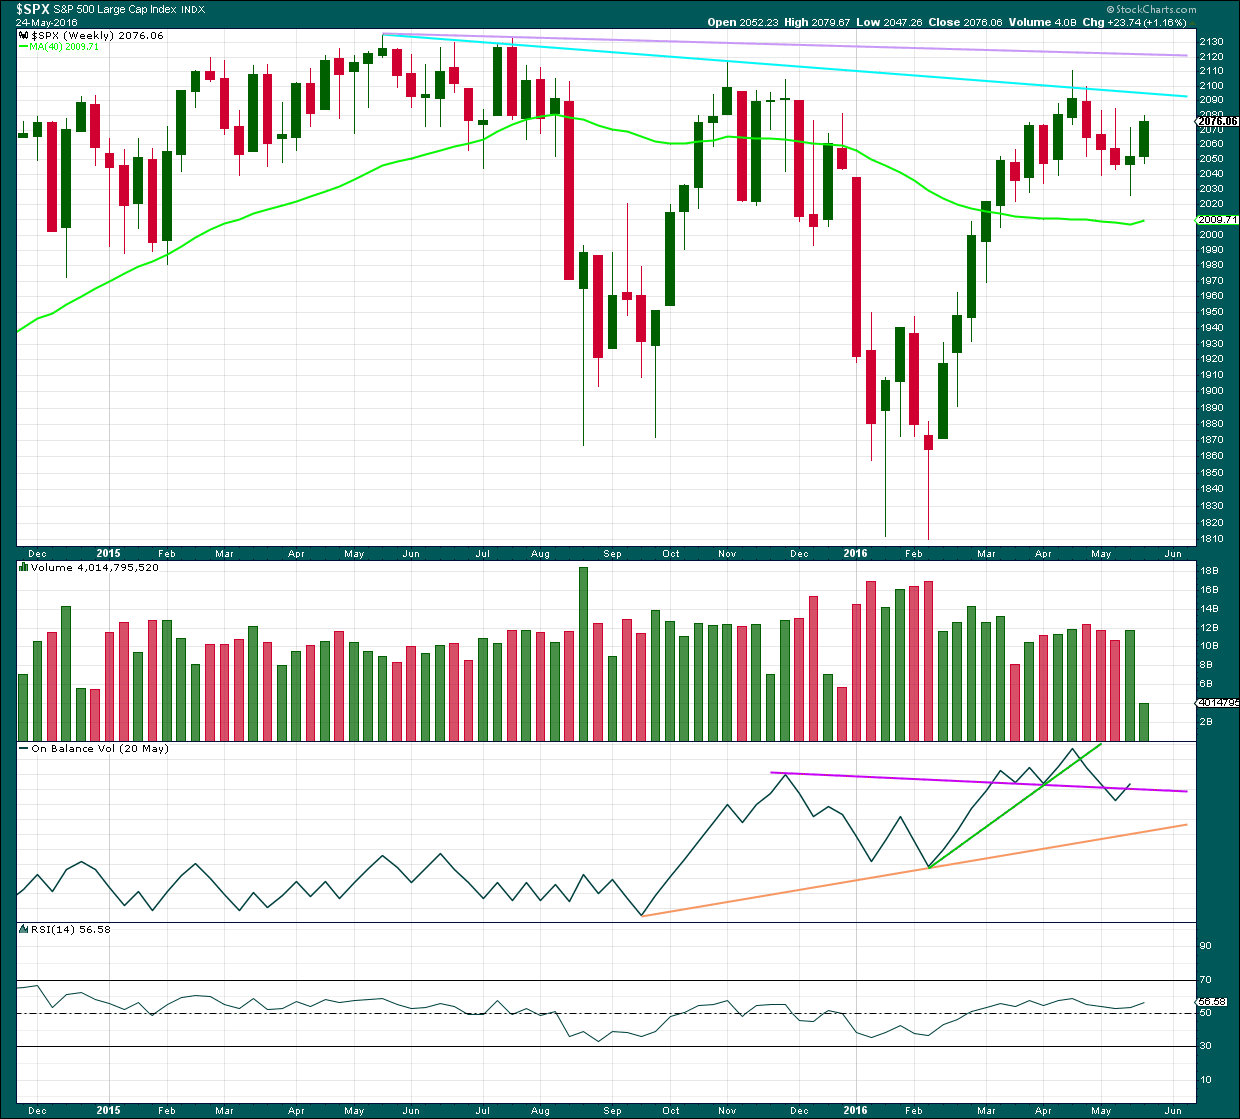
There is a bearish engulfing candlestick pattern at the last high. This has occurred at the round number of 2,100 which increases the significance. Volume on the second candlestick is higher than volume on the first candlestick, which further increases the significance. That it is at the weekly chart level is further significance.
Engulfing patterns are the strongest reversal patterns.
Now this pattern is followed by another red weekly candlestick. The reversal implications of the pattern are confirmed.
This is a very strong bearish signal. It adds significant weight to the expectation of a trend change. It does not tell us how low the following movement must go, only that it is likely to be at least of a few weeks duration.
There is also a Three Black Crows pattern here on the weekly chart. The first three red weekly candlestick patterns are all downwards weeks. The pattern is not supported by increasing volume and only the third candlestick closes at or near its lows; these two points decrease the strength of this pattern in this instance. That the pattern occurs at the weekly chart level increases its strength.
On Balance Volume broke below the purple line and is now returning to just above it. The bearishness of the break below the purple line is negated.
DAILY CHART
Click chart to enlarge. Chart courtesy of StockCharts.com.
Volume data on StockCharts is different to that given from NYSE, the home of this index. Comments on volume will be based on NYSE volume data when it differs from StockCharts.
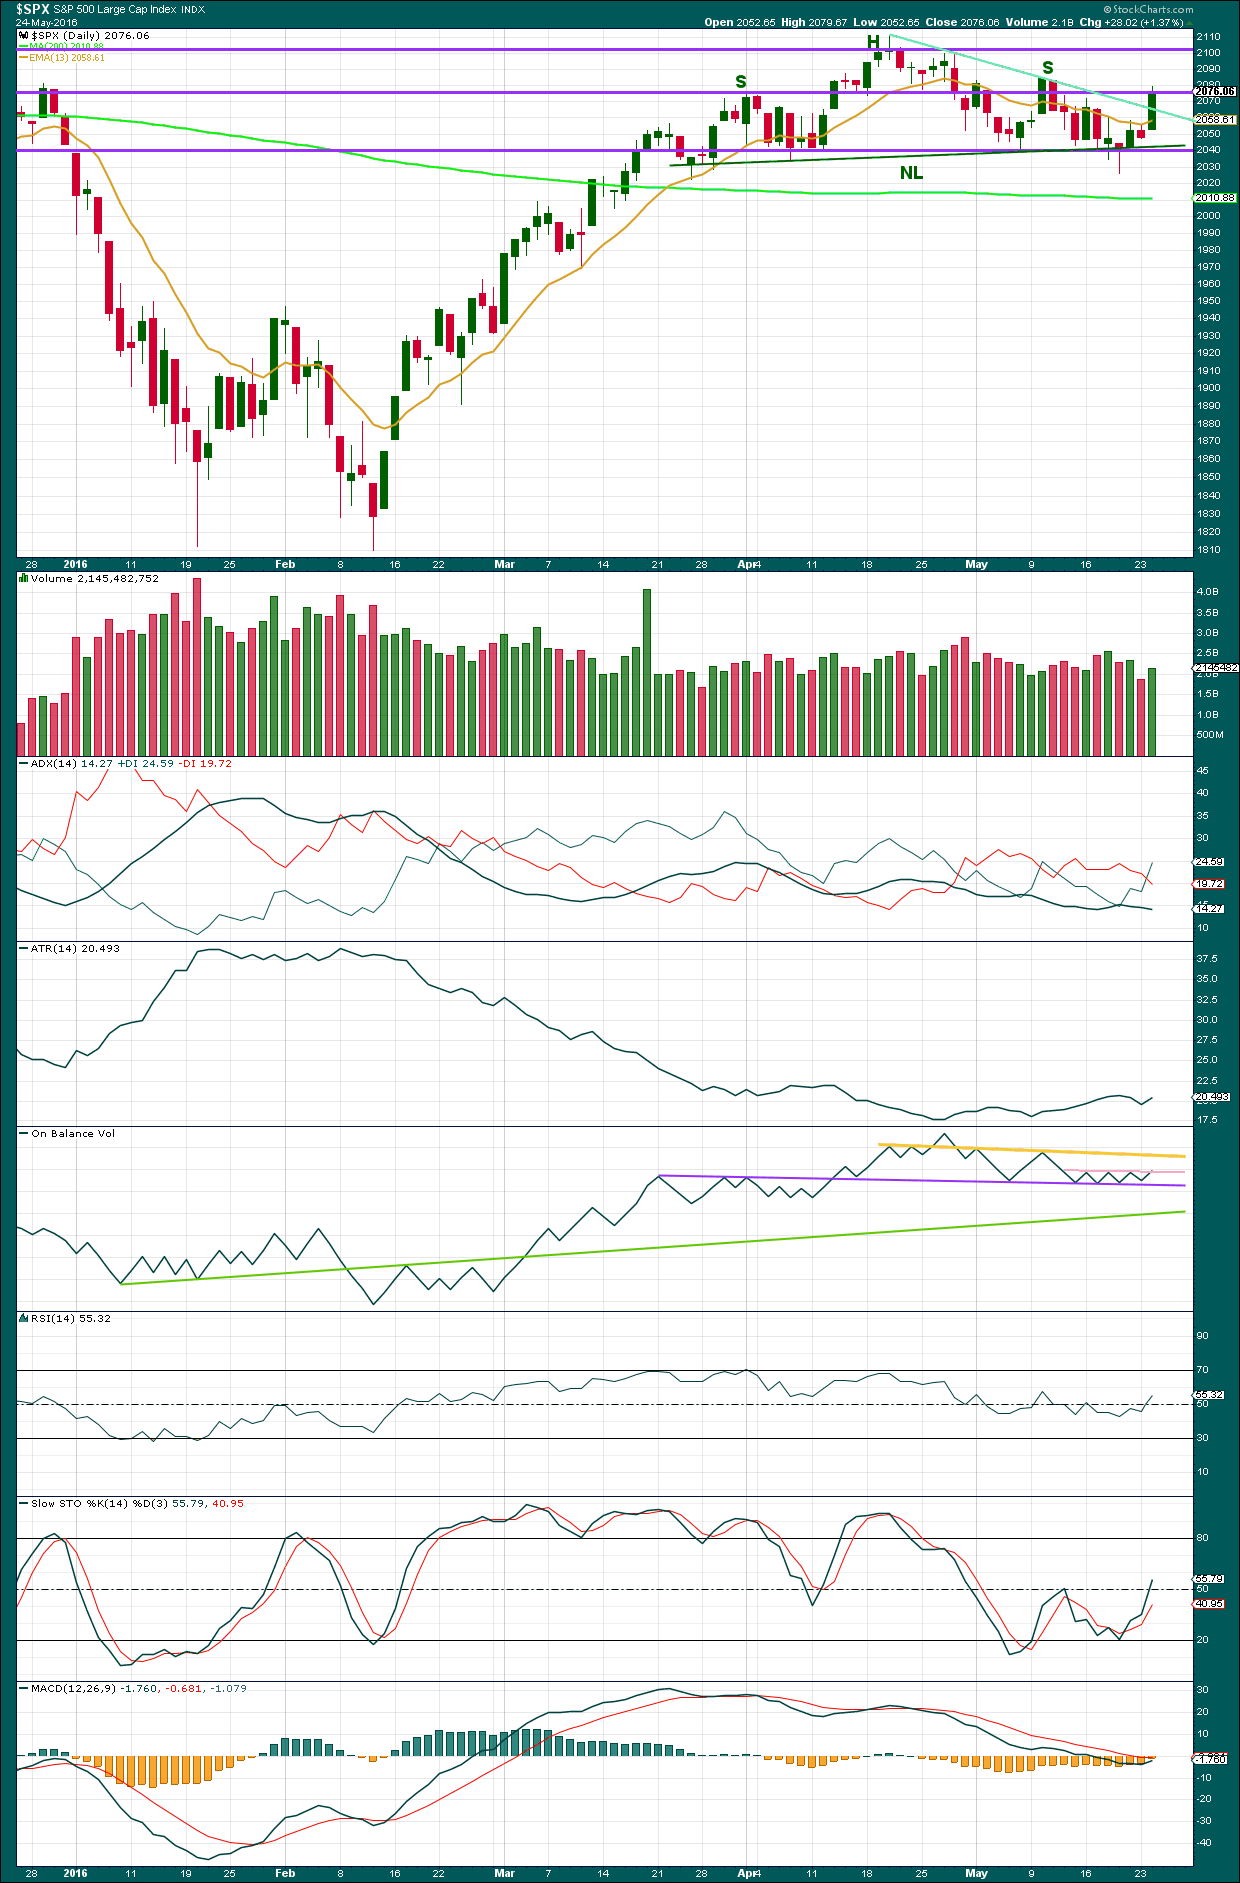
The rise in price for Tuesday’s session has some support from volume. Price may find some resistance about 2,075. The next line of resistance is 2,100. The short term bear market trend line was breached and did not provide resistance.
The Head and Shoulders pattern may be still forming the right hand shoulder. When this current upwards movement is over, then exactly where the left and right hand shoulders may be will be reassessed.
ADX today has indicated a trend change to upwards. The ADX line is declining indicating the market is not trending. ATR today disagrees: it is turning upwards today indicating the possible start of a new trend. Some disagreement between these two indicators at the start of a new trend is to be expected. If they come to agreement, then more confidence may be had in what they say.
On Balance Volume may today be breaking above the short term pink trend line. If OBV moves up from here, it should find resistance at the yellow line. If at that stage price has found resistance about 2,100, then upwards movement would be reasonably expected to end there.
RSI is returning above neutral. There is no divergence today between price and RSI.
Stochastics is approaching neutral, returning from oversold.
MACD has not yet indicated a trend change, but it may be about to.
VOLATILITY – INVERTED VIX DAILY CHART
Click chart to enlarge. Chart courtesy of StockCharts.com.
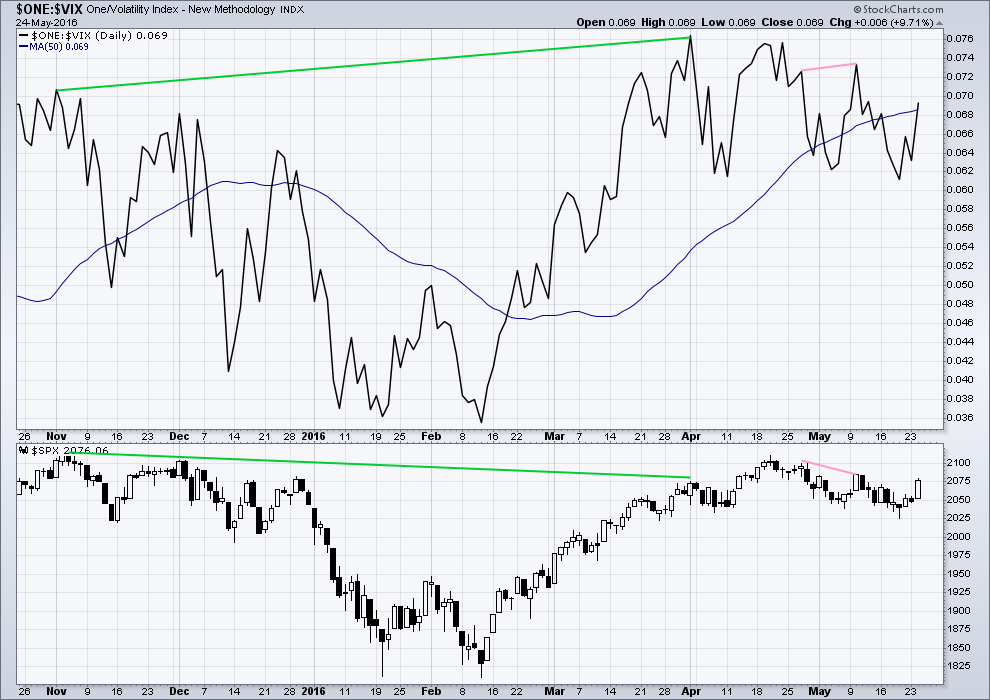
Volatility declines as inverted VIX climbs. This is normal for an upwards trend.
What is not normal here is the divergence over a reasonable time period between price and inverted VIX (green lines). The decline in volatility did not translate to a corresponding increase in price. Price is weak. This divergence is bearish.
Upwards movement which is now unfolding for price will be watched carefully in relation to VIX. If there is divergence between price and VIX, it may signal the end of upwards movement. There is no divergence today.
BREADTH – ADVANCE DECLINE LINE
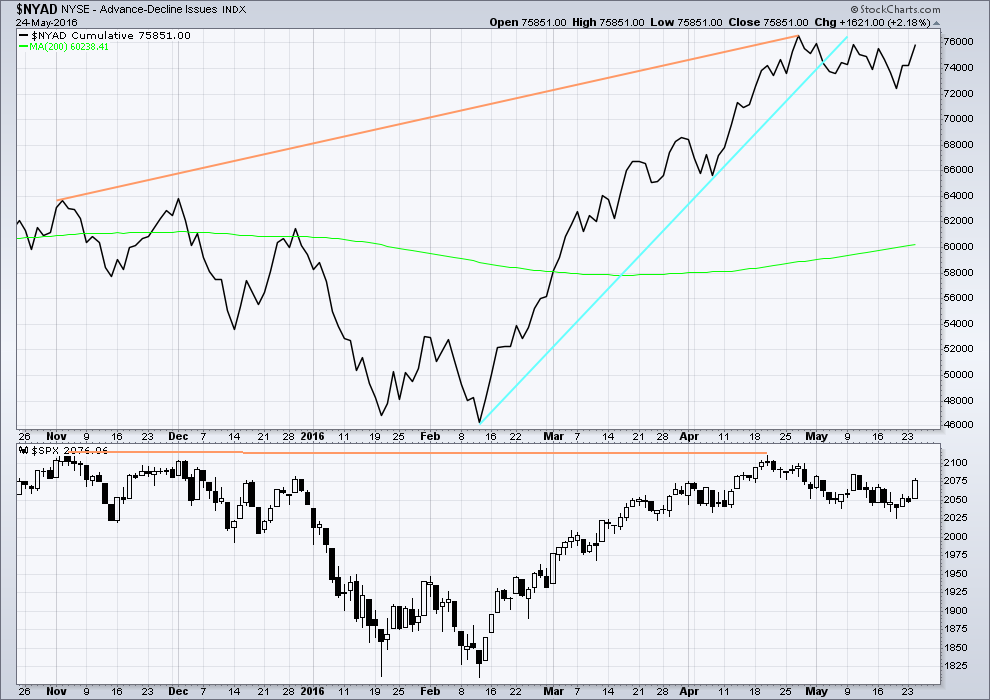
Click chart to enlarge. Chart courtesy of StockCharts.com.
With the AD line increasing, this indicates the number of advancing stocks exceeds the number of declining stocks. This indicates that there is breadth to prior upwards movement.
From November 2015 to 20th April, the AD line made new highs while price far failed to make a corresponding new high. This indicates weakness in price; the increase in market breadth is unable to be translated to increase in price (orange lines).
The 200 day moving average for the AD line is now increasing. This alone is not enough to indicate a new bull market. During November 2015 the 200 day MA for the AD line turned upwards and yet price still made subsequent new lows.
The AD line is now declining and has breached a support line (cyan). There is breadth to downwards movement; more stocks are declining than advancing which supports the fall in price.
Price will be watched carefully while it moves higher in relation to the AD line. If there is divergence between price and the AD line, it may signal an end to upwards movement. There is no divergence today.
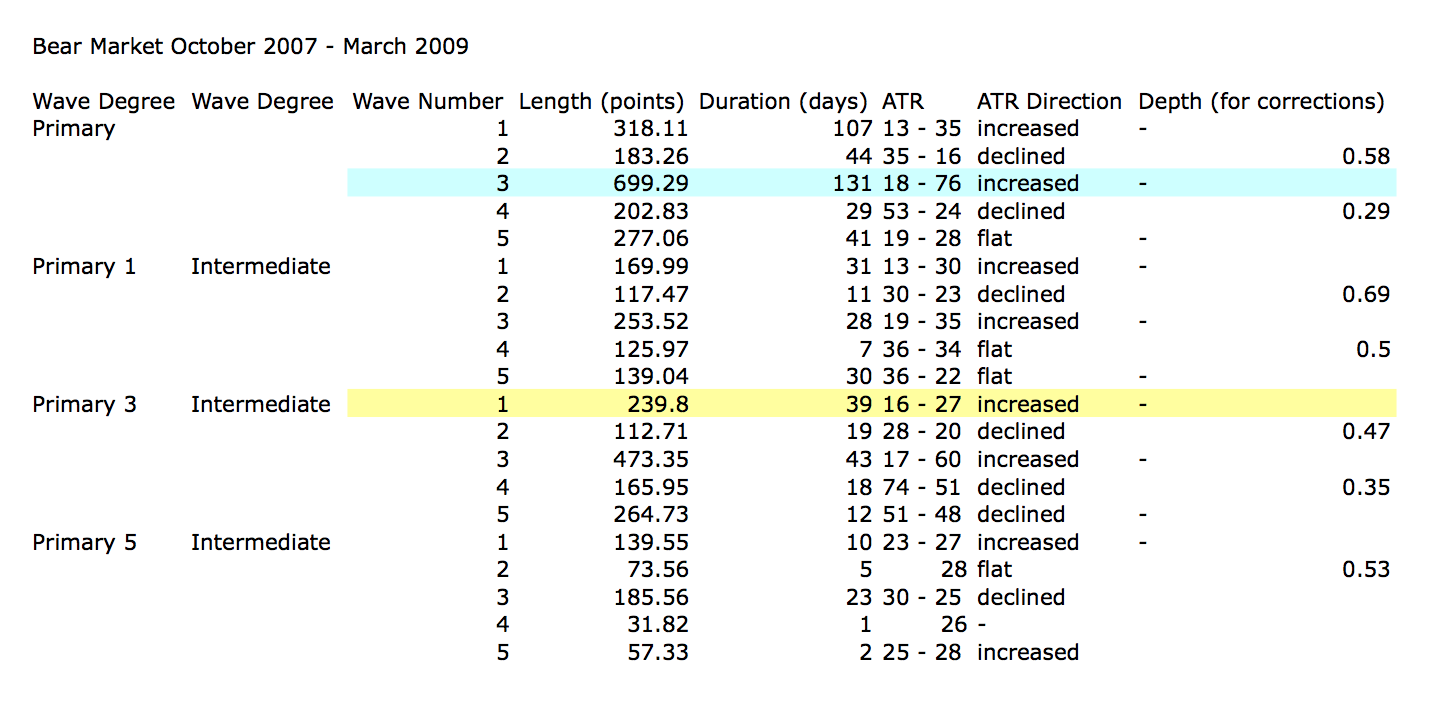
ANALYSIS OF LAST MAJOR BEAR MARKET OCTOBER 2007 – MARCH 2009
Click to enlarge.
In looking back to see how a primary degree third wave should behave in a bear market, the last example may be useful.
Currently, the start of primary wave 3 now may be underway for this current bear market. Currently, ATR sits about 19. With the last primary degree third wave (blue highlighted) having an ATR range of about 18 to 76, so far this one looks about right.
The current wave count sees price in an intermediate degree first wave within a primary degree third wave. The equivalent in the last bear market (yellow highlighted) lasted 39 days and had a range of ATR from 16 – 27.
To see some discussion of this primary degree third wave in video format click here.
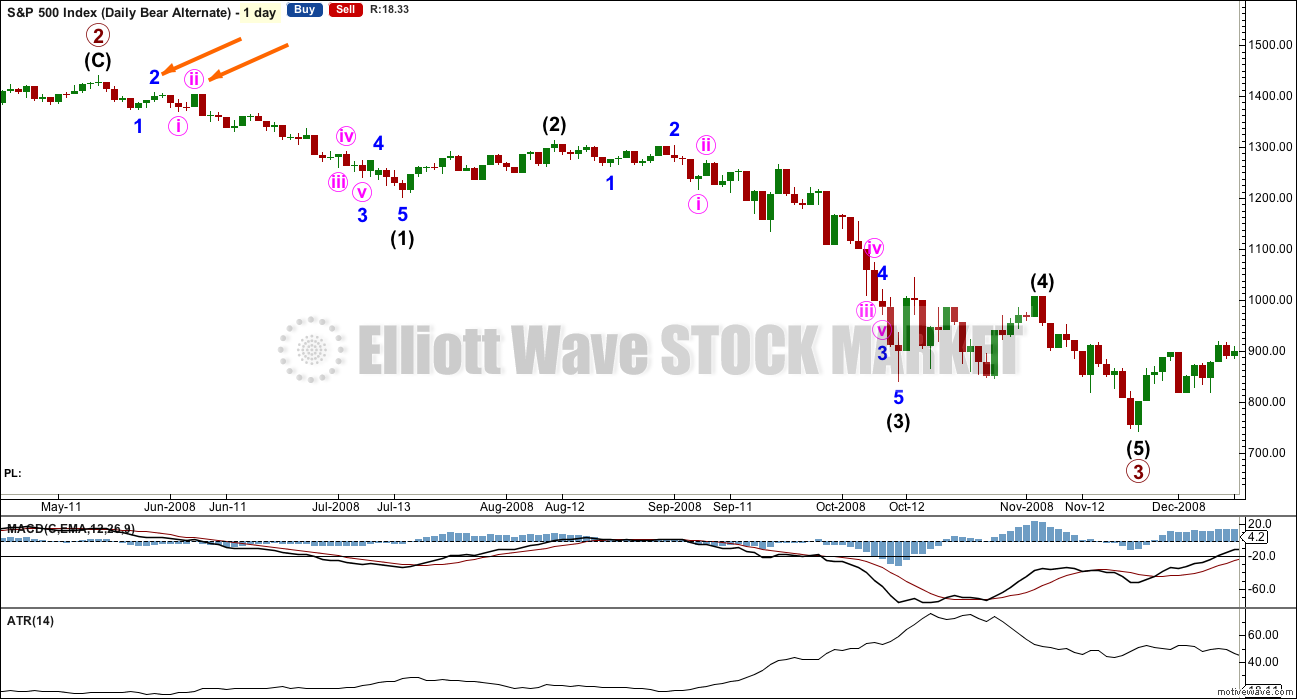
Click chart to enlarge.
This chart is shown on an arithmetic scale, so that the differences in daily range travelled from the start of primary wave 3 to the end of primary wave 3 is clear.
Primary wave 3 within the last bear market from October 2007 to March 2009 is shown here. It started out somewhat slowly with relatively small range days. I am confident of the labelling at primary degree, reasonably confident of labelling at intermediate degree, and uncertain of labelling at minor degree. It is the larger degrees with which we are concerned at this stage.
During intermediate wave (1), there were a fair few small daily doji and ATR only increased slowly. The strongest movements within primary wave 3 came at its end.
It appears that the S&P behaves somewhat like a commodity during its bear markets. That tendency should be considered again here.
Looking more closely at early corrections within primary wave 3 to see where we are, please note the two identified with orange arrows. Minor wave 1 lasted a Fibonacci 5 days and minor wave 2 was quick at only 2 days and shallow at only 0.495 the depth of minor wave 1.
Minute wave ii, the next second wave correction, was deeper. Minute wave i lasted 3 days and minute wave ii was quick at 2 days but deep at 0.94 the depth of minute wave i.
What this illustrates clearly is there is no certainty about second wave corrections. They do not have to be brief and shallow at this early stage; they can be deep.
This chart will be republished daily for reference. The current primary degree third wave which this analysis expects does not have to unfold in the same way, but it is likely that there may be similarities.
DOW THEORY
I am choosing to use the S&P500, Dow Industrials, Dow Transportation, Nasdaq and the Russell 2000 index. Major swing lows are noted below. So far the Industrials, Transportation and Russell 2000 have made new major swing lows. None of these indices have made new highs.
I am aware that this approach is extremely conservative. Original Dow Theory has already confirmed a major trend change as both the industrials and transportation indexes have made new major lows.
At this stage, if the S&P500 and Nasdaq also make new major swing lows, then my modified Dow Theory would confirm a major new bear market. At that stage, my only wave count would be the bear wave count.
The lows below are from October 2014. These lows were the last secondary correction within the primary trend which was the bull market from 2009.
These lows must be breached by a daily close below each point.
S&P500: 1,821.61
Nasdaq: 4,117.84
DJIA: 15,855.12 – close below on 25th August 2015.
DJT: 7,700.49 – close below on 24th August 2015.
Russell 2000: 1,343.51 – close below on 25th August 2015.
To the upside, DJIA has made a new major swing high above its prior major high of 3rd November, 2015, at 17,977.85. But DJT has so far failed to confirm because it has not yet made a new major swing high above its prior swing high of 20th November, 2015, at 8,358.20. Dow Theory has therefore not yet confirmed a new bull market. Neither the S&P500, Russell 2000 nor Nasdaq have made new major swing highs.
This analysis is published @ 10:54 p.m. EST.
Good morning every body!
Looking good for a short entry here or very soon…
I’ve scrolled really quickly but haven’t read all the comments. If anyone has specific questions please post at the top for me to save me some time? I don’t have a lot of time this morning.
Now working on the 5 min chart and will have something to post soon.
This is what I have for the hourly, but its pending my checking of the 5 min
I’m leaving that as it is. Looks about right on the 5 minute chart.
With price sitting right on the bear market trend line I think that is very likely where it will end.
Now to see if volume is light and if there’s any divergence with price and one of RSI, VIX or the AD line. Also, has OBV touched the yellow line?
Volume higher by only 4 Million…
558.587M Today vs 554.344M
Not sure if the feed is right but seeing 2087.50 right now in after hours.
2090.54 is SPX close
ES is 2087.25 but SPX equivalent is ~ 2091.04
Dammit. That’s not good.
FWIW, some inter-market divergence in the volume profile today. SPX slightly higher, DJI slightly lower…
There was a clear intra day div with UVXY at the last high so I’d presume VIX is same but not checked it.
EDIT – If the data I am looking at is correct, VIX is down today more than UVXY which seems kind of strange. Perhaps UVXY shorts heading for the exits.
So far looks like it. Divergence between the high of 10th May and the new high today; price made a new high and VIX did not. Indicates weakness, bearish.
That’s good to see.
I’ll be concerned if volume is higher today though, that would indicate maybe tomorrow to go a little higher.
Shorts back on at 2,089.96. Stop just above 2,111.05. Target 1,423
Fibonacci fan lines measuring the move from the Feb. 11 low to the Apr. 20 high provided support at the 50% line on at 2025.19 on May 19 and resistance at the 38.6% line at 2094.38 today. This may add support to Minor 2 being complete or close to it when coupled with the bear market trend line adding additional resistance. However, if the LT bear market line is to be breached, there is room for one more upward move very early tomorrow to find resistance again where the 38.6% fan line meets 2099. I can live with nine points up from today’s close, if that’s the case.
Just took a position in UVXY shares at 11.80. First time trading this one.
Blimey… stay nimble! 🙂
just in time for the infamous end of day volatility sell off
I really wanted to see that gap filled at 12.20. I am going to be a bit concerned (short term of course) if we do not gap up through it tomorrow out the gates…have a great evening all!
100% short (again!) with stop at 2102.
Hopefully I can let it run more than a couple of days (or hours) this time.
This last wave up still might extend whilst it remains above 2089 but it looks like toast to me atm.
If we gap up tomorrow I’ll be sick as a scrapyard dog!
short heavily in bearish 3x ETF’s. will short futures on drop down through key point(s) or 2098-2099.
If we do it will probably be an exhaustion gap. Perhaps futures will clue us in….
What’s the thought on the daily candlestick today? dabble in candles but certainly not an expert.
The hourly is painting a nice picture!
Thanks for the input
I am far from an expert in anything. But the longer the upper wick the better. A long upper wick / shadow will shows that the bulls could not keep control away from the bears. Thus, it would be bearish. So lets keep dropping these last 4 minutes.
Still up .75% for the day…
Hourly telling a tale so far…
Bearish Engulf from 2-3PM followed by a long upper wick for the 3-4PM
That is timed with the main hourly count and I think Olga’s 1 min count.
ES has the same exact candlestick pattern in the hourly. Longer wick
I don’t think there’s much in it. It’s not a reversal pattern, it doesn’t have a long upper wick to signal exhaustion…
Nothing there to indicate the end to this upwards movement
Even in the hourly?
Bearish Engulf from 2-3PM followed by a long upper wick for the 3-4PM
ES has a much longer wick from 3-4PM and same pattern.
I was referring to the daily only.
I still wouldn’t read too much into candlestick patterns at the hourly level.
At the end of minuette (i) on the hourly chart there was an evening doji star, could also be interpreted as a bearish engulfing pattern. Yet price kept going up.
For a reversal at the daily chart level I’d be looking at the daily candlestick.
How’s that, 2094.52. I clearly jumped the gun as Olga called. Now we have completed wave action along with completed price action. It can turn lower now at any moment to start Minor 3.
High for the Day 2094.73 … hit last 5 min
Is it soup yet???
Nah. It’s toast maybe 🙂
Below 2090.68 might be the first clue the game is up. Think we might still need a tiny pop higher but it’s done what it needs to do (except turn us into Bulls 🙂 ).
2090.20
could be just wave 4
Impulse down…!
UVXY should quickly reclaim 12.20 if we are done…
Right on cue! Now we are talking. It looks to me like Minor 2 is over at 2094.03.
My data on IB shows a tiny (0.15 point) truncation on that last move higher (2094.16).
Does your platform show a higher high?
I have a truncation for SPX on Stockcharts.com
This move down might still be a W4 then (i.e. C of 4).
A tiny 3 up that does not go above that high would suggest the move is over.
Going below upper baseline, then below 2079 will seal the deal.
UVXY is already suggesting the show is over though.
94.21 on mine
TOS
I have with FXCM 2094.6 and IG 2094.52
Lets hope those numbers will be confirmed on all platforms in t he next 15 minutes. Thanks.
2094.38 on Google SPX index
High for the Day 2094.38
High on 2:45PM Candle 2094.21 is 2nd high of the day.
High for the Day now 2094.73 with this 3:25-3:30 candle
NO. I am allowing for the truncation based upon the size of the candles and the size of the move we have seen since 2094 at 2:45 PM. I know it is a risk to call it now. But subsequent action is strong.
I may have jumped the gun on this one. I’ve bee n known to do that.
UVXY divergence with this last move up….
Slight truncation maybe? C’mon Mr M!
Maybe still in small W4 (barrier triangle)?
Upper trendline of base channel might provide support if this is still a 4th wave.
Published 10 minutes ago:
“Only one company in the S&P 500 Index has majority ‘sell’ ratings. Published: May 25, 2016 2:18 p.m. ET”
Now that is really interesting. Thanks.
Looking for a move back below trend-line to signal top is in….
Esp. ahead of a US 3 day holiday – and Yellen giving a talk on Friday.
Looks like Memorial Day Weekend 2016 has started at mid day today (Wed)!
Glad I was out for a while…. BORING! If nothing changes in the next 20 min. I am out of here.
COME ON!!!!!!!!!!!!!!!!!!!
Here’s what I have trouble understanding, what PM out there would actually buy this market at this level? Especially when considering the move we have had in 3 1/2 trading days? Who does that? LOL….
Banksters! 🙂
“crooksters”…lol
30 second chart
Something to share with everyone for those of you who don’t know, put your SPX chart to 30 minutes. Then slide your crosshairs over the time beginning from the far left of the screen. Take note what happens many times around 13:00 and just slightly after. So many times the short term trend continues, then changes direction. It is the Chicago boys (traders) coming back from lunch. Even with computer trading nowadays it still is a little tip which comes true many times day after day…
Yes. I have noticed significant movements at this time
Yes, often times trend changes or re-establishes itself after 12pm. Significant moves tend to happen in the pm.
Someone posted about waiting to see distribution at the top, as a counterview (good for helping everyone think myself included), that is typical for a top in an up market. But we’ve been in a corrective market for a year now. Since then we’ve been seeing one day tops; my evidence is look at a daily SPX chart and the dates Aug. 17th, 2015; Nov.3rd 2015; Dec.1st 2015; Dec.29th, 2015 and April 20th, 2016. Every time a one day top by itself with no distribution before a healthy drop.
Well, I personally don’t mind “not” catching the top…..or the bottom. Years and years of trying to call turns has made me learn one thing about myself, I’m horrible at it. When I did catch them (the top or the bottom), I realize it was BLIND luck.
So now, I wait for the turn. You can still male all the money you need after the turn has happened. If this wave turns out to be a 3 wave down, there will be plenty of room to make all money you can handle on the short side….IMHO.
GLTA!
I catch tops and bottoms….but as posted more than once I’m willing to get stopped out numerous times. Lose 10 basis points but gain 50+ play. At this juncture I’ve gained 6.1 points a few days ago, lost 2.5 this morning, so shorting today and if I get stopped out again then will be at about break even – and had fun doing it all. Just viewing it as better and better places to get in.
UVXY showing life; making new highs while SPX nowhere near lows of the day… good sign 🙂
Looks like consolidation, BB squeeze for a final move down
So Rodney , these are your thoughts ? a five up to complete a 3 ? I just can not count anything under 5 min , have a struggle looking at 15 .
This might help you out 🙂
Got it ! Thank you Olga .
That’s is how I am counting. Thanks Olga.
Thank you Olga! 🙂
Perfect
If UVXY hits 12.20 we’re done….
It’s gettin frisky… I’d be suprised if we get another lower low.
Gotta be ahead of the curve with this fella.
Boy ain’t that the truth. If it’s not Scottish….it’s CRAP! 🙂
Is this not 5 off the low of 5/19
Yes that is how I am counting it atm
Fred,
I think your view is correct. The question is, “Has the final 5th wave up within minute c of Minor 2 has completed?” It certainly could be. But the 1 minute chart leads me to believe we have one more wave up. My targets are 2095.5 where minuette 5 = minuette 1. The second target is 2099 where v = 1.62 * i. The third target is 2107 where v = iii. These are all approximations.
Your third target cannot be met without W3 being shortest.
Then it is not valid. Thanks.
Either a second or fourth wave underway. Momentum of next move up should clarify methinks…
Key SPX Simple Moving Averages as of today for what we are waiting for:
2063.70 50 Day MA
1997.02 100 Day MA
2010.82 200 Day MA
==================
2024.37 50 WK MA
2030.67 100 WK MA
1841.95 200 WK MA
1810.10…. well you all know what this is. Break this now, this time… and its down to
the 200 Month MA.
1808.46 50 Mo MA
1480.31 100 Mo MA
1350.16 200 Mo MA… By the time we get down here this may be at or near the
Bear Count Target of 1423 ….. See, it all fits the big picture….
THIS TIME!
Have to go out for a while… back by 2:30PM
When you look at the EDZ etf (inverse, bear 3X) it really wants to take off at any little drop in the SPX.
As much as I would love to see a higher low, any move above 12.20 today and it’s anchors away on my last quarter.
W2 of 5 of C was sharp so price will possibly mess around sideways for a bit now before one final pop higher.
Plenty of upward gaps to fill 🙂
Below 2079 the fat lady might already be in full song.
Olga or anyone else – from the May 19th low are you seeing it as a corrective 3 wave up? and a-b-c
I’m seeing it as a 5 wave impulse (C wave – as per Lara’s amin count) atm. If it goes above 2101.07 it might be something alot more bullish but I consider that at a lower probability alternate atm.
The 4th wave within it was quite alot shorter duration than 2nd wave (but also shallow), giving it a bit of a strange look but I have seen that happen before in S&P
Another nice scalp on the fifth up. Grabbed 208.5 calls at the open for 0.87, unloaded for 1.50. Holding one as a canary in the coal mine and it is already down to bid of 1.30. I think we have one more pop….
Will load my last quarter of Unicorns on the move back toward low of 11.28; I expect a higher low…
I would like to dedicate this Gordon Lightfoot classic to the rally….
https://www.youtube.com/watch?v=MOOs-MqDOI0
Thanks for the nostalgia Verne. Reminds me of my childhood 🙂
SPX daily, 4 hour, and hourly charts showing SPX above the upper Bollinger Band.
Time to kick some above-the -Bollinger- Band Booty! 🙂
It’s better to swing with BB bands when you are moving sideways conversely incorrect to attempt to swing BB bands when trending. Also oscillators are useless in a directional trend be it short or long-term.
Much more than BB penetration in play I wager…. 🙂
Good point Ivy. Thanks.
BB penetration is often a reversion, not trending play, because price can’t stay at extremes.
Unicorn bouncing on the fourth, one more low I think….
Looking for a higher low to pounce
Yeah Baby!! 🙂
It looks like a move back to test 2085 would be a good spot to get a little long for a move to 2099 over the next day or two.
With such an explosive move up, it would be really rare to see a meaningful reversal until we get some distribution at the top.
GLTA
The old chestnut:
SPX has to chop – before it can drop 🙂
Good Morning Everyone,
Was a little early yesterday when I bought SPX PUTS and Uvxy calls. Just added to positions. Bought 204 SPY PUTS at .22. Brought cost average to .39.
Bought UVXY 14.5 Calls at .21. Brought cost average to .29.
Had to pull trigger. SPX hourly outside BB. RSI oversold. Stochastics oversold. Do not get that set up too often. It works until it doesn’t work anymore!
Don’t you mean overbought?
Yes-overbought. Thanks for catching it!
Ya just don’t get away with much ’round here matey! 🙂
Bought another 10% UVXY @ 11.31.
If we go above 2101.07 I’ll be bailing
Looks like we still need a small 4th and 5th wave up to me.
agree
I have to say it has been a while since I have been around a community of traders with the kind of savvy to short rallies toward the end of a trend. I am starting to feel a little bit of awe of youse guys…. 🙂
in perspective i caught the Feb. 2016 low, my long futures contracts paid out $63,458.21. Reason why I don’t mind being stopped out 10 times.
Nice payday. Almost as nice as my Unicorn trade from last August. Believe it or not, I left half my money on the table exiting that trade too early….
But pointing out I lost ~$1,450.00 this morning.
Yet picked up 6 basis points on the Sunday night trade into Monday night. So still ahead.
One waits for months for days like this
I am giving even odds on a push to SPX 2100 for maximum embedded bullishness. Any takers? You will have to take Unicorns as payment! 🙂 🙂 🙂
I say it won’t get there. What’s the bet?
You give me one Unicorn if it does, I give you one if it does not….. 🙂
Sub-min three of minuette five almost done I think; it may not make it…
I say this all ends at 2094.11
Is that before or after reverse split? If SPX goes to 2100 UVXY will be looking very sad 🙂
I think I can confidently state that a reverse split is NOT in our immediate future…. 🙂
Thanks!
I sure hope not 🙂
Accumulating some 3X bear ETF’s, SDOW and EDZ, here.
Here is a 30 second chart for those who may not have that timing on their platform
If you go over to a ‘Today’ chart, you can even get 15 second action! 🙂
Vern,
Looks like GOLD headed to 1100s and NUGT is taking a beating…now below $70 and counting.
I am short gold and loving it! 🙂
I am counting subminuette 1 & 2 of minuettete 5 of minute c of Minor 2 complete. Subminuette 3 underway and perhaps even complete. Only subminuette 4 & 5 left to complete the wave count. Subminuette 4 cannot go into subminuette 1 territory at 2079.67.
What say you?
Yep – 2079.67 might be first clue it’s over
Was stopped out, next short 2099ish.
Hey Bulls…. ALL ABOARD! Run Bulls… RUN!!!!!
FWIW…MaClellan folks went bullish yesterday with the expectations for rally into June end. Special mention of the H&S suggesting folks are over assessing the implications as H&S form all the time even within an uptrend 🙂
That’s a little worrying actually – McClellan is pretty darn accurate most of the time…
If the right shoulder of the H&S is penetrated this will be seen as a bullish entry point with a price projection well above the invalidation line.
Probably stating the obvious here, but it’s noteworthy that if W4 of C is still in progress, it can make a higher high then fall down impulsively in 5 waves (so an expanded flat). The ‘tell’ is if the wave up to the final high is a 3 rather than a 5 wave structure (albeit at such low degree it can often be hard to know for sure).
Is important not to mistake the 5 waves down (C of expanded flat) as a trend change – that’s the main reason I await the confirmed 3 up after the 5 down.
Obv below 2058 cannot be a 4th wave.
Bulls all over the media now Dennis Gartman saying
““I think we are likely to trade better, maybe not today particularly, but I bet by Friday we are higher and I bet by next week we are higher again,” he told CNBC. “
The fact this clown gets so much media attention (and people seem to listen to him) is all that I need to know about the current state of affairs.
I assume he gets paid? How many jobs would you not get fired for being so bad….
I too am seeing some talking heads and advisors turning bullish. I’ve seen a projection for 2500+ which is essentially Lara’s bull count.
We are in a 2nd wave. The job of a 2nd wave in market psychological terms is to turn the masses bullish. The masses come to say, “What we just went through was only a correction in an on-going bull market.” I think we are hitting that point.
I am looking for a move to just under 2100 to close today in the green somewhere in the vicinity of 2090 beneath the high of the day. Then tomorrow we see bearish engulfing pattern to begin Minor 3 down just as Minor 1 down started.
Perfect! 🙂
ES overnight high 2085.50 that’s an SPX equivalent of 2088.56
Right now SPX would open up 8.19 to 2084.25 1st 2 min or so
End of wave 2 (V) C circle at any time now.
Based on futures vs fvalue…
Right now SPX would open up ~ 7.44 to ~ 2083.47 in 1st 2 min or so
End of wave 2 (V) C circle at any time now.
EDIT 9:32AM Right on target 2084.39
Valid Trucation Zone has arrived 2085.50
I’ve gone short futures at 2084, will risk 2.5 points.
Yeah – I’ve just bought 10% UVXY @11.75. I expect S&P will go a bit higher but UVXY doesn’t always go lower on higher highs.
In any case, still got plenty of dry powder to deploy.
If the count is right, W3 being shorter than W1 is good news for max. target prediction.
If it goes back up to this sessions high I’ll short some more, and lower my stop loss. If knocked out then will do the same again up at 2099. All worth it when looking for a 50+ basis point drop.
Yep! Always a great set-up when you get a third wave shorter than a first as you get a clear number that says you are wrong so far as the fifth wave up is concerned (as you astutely pointed out yesterday). I think the number is 2101.07 when minuette five equals minuette three. I will be looking for two new UVXY lows today – at the end of sub-min three and once more at the end of sub-min five. We may get some divergence with that final wave up. I expect the flash boys to take us just a bit beyond the round number. The bulls will be beside themselves with giddiness. Lock and Load!
The head and shoulders bearish top (head the April 20th high) is still in play as throwbacks can occur. The chart of the AMD stock shows one for example. Noting on a throwback volume is typically light.
Great chart Peter. It is funny you posted that as I have been thinking the next reversal is going to come with a gut-wrenching gap down as illustrated by the price action in your chart. Folk who don’t handle the current rally right (scalping) and go all-in are going to be very badly hurt. No doubt people thought price was returning to test the break-out from the neck-line, and then the bottom drops out. Wow! Great heads up!
We have a new 52 week low on the pre-market ask for UVXY! (11.88)
We are past truncation in the futures — SPX is welcome to fall from here now.
NS100 is right at 62% retrace (similar for FTSE100) — good place to start falling too..
Futures do not count on Lara’s charts and analysis. The only data that is used is the cash price during a regular NYSE trading day. A count cannot be completed, confirmed or invalidated by what extended hours or futures prices do.
Need the SPX print
We may get a valiant run at the round number pivot today.
How nice it would be to get an outside reversal day!
I will be loading another quarter of my Unicorn calls as close to the day’s low as possible.
The last quarter will be held for the first green close.
There is no alternate count, i love that chutzpah.
🙂
Yeah, but it does make me a little nervous…
Sod’s Law (Sod is a close relative of Murphy) says now I’ve only one wave count it’ll be invalidated.
However, you do have a bullish alternate to the bear count. So Sod, whoever that may be, does not apply.
Ah no, Sod gets me regularly from time to time.
Whether it be surfing, trading or just life in general.
Rudy, What language the word chutzpah ? 🙂
yiddish or hebrew
Yafee meood Rudy
First!
Thomas is mighty quick tonite
Quick as a sprite he was…! 🙂