
A small inside day does not clarify the situation.
Summary: The downwards trend is not in doubt but short term how high a bounce goes is unclear. The main hourly wave count expects upwards movement for another two days (or maybe a little longer) to a target at 2,099 to complete minor wave 2. A new high above 2,058.35 would now add confidence. The alternate hourly wave count expects an acceleration of downwards movement towards a target at 1,988 (short term). This would be confirmed below 2,025.91.
To see last published monthly charts click here.
To see how each of the bull and bear wave counts fit within a larger time frame see the Grand Supercycle Analysis.
To see detail of the bull market from 2009 to the all time high on weekly charts, click here.
New updates to this analysis are in bold.
BEAR ELLIOTT WAVE COUNT
WEEKLY CHART
Click chart to enlarge.
This bear wave count fits better than the bull with the even larger picture, super cycle analysis found here. It is also well supported by regular technical analysis at the monthly chart level.
Importantly, there is no lower invalidation point for this wave count. That means there is no lower limit to this bear market.
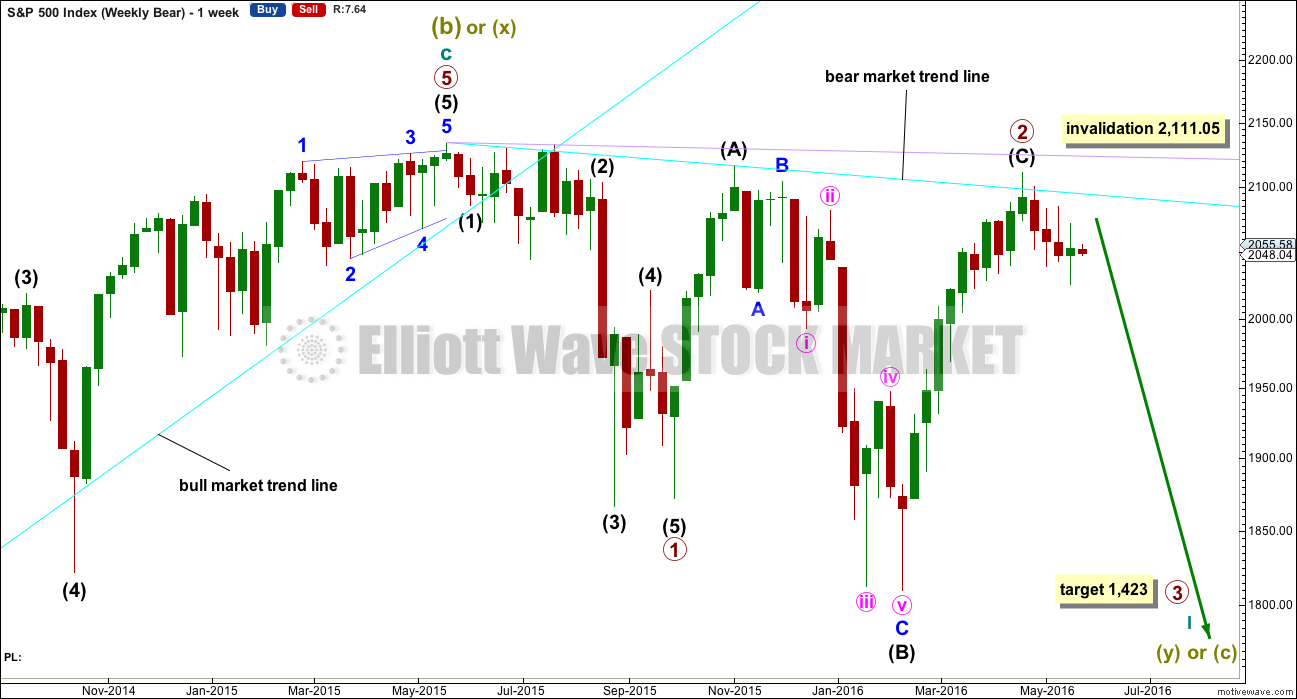
Primary wave 1 is complete and lasted 19 weeks. Primary wave 2 is over lasting 28 weeks.
An expectation for duration of primary wave 3 would be for it to be longer in duration than primary wave 1. If it lasts about 31 weeks, it would be 1.618 the duration of primary wave 1. It may last about a Fibonacci 34 weeks in total, depending on how time consuming the corrections within it are.
Primary wave 2 may be a rare running flat. Just prior to a strong primary degree third wave is the kind of situation in which a running flat may appear. Intermediate wave (B) fits perfectly as a zigzag and is a 1.21 length of intermediate wave (A). This is within the normal range for a B wave of a flat of 1 to 1.38.
Within primary wave 3, no second wave correction may move beyond its start above 2,111.05.
DAILY CHART
Click chart to enlarge.
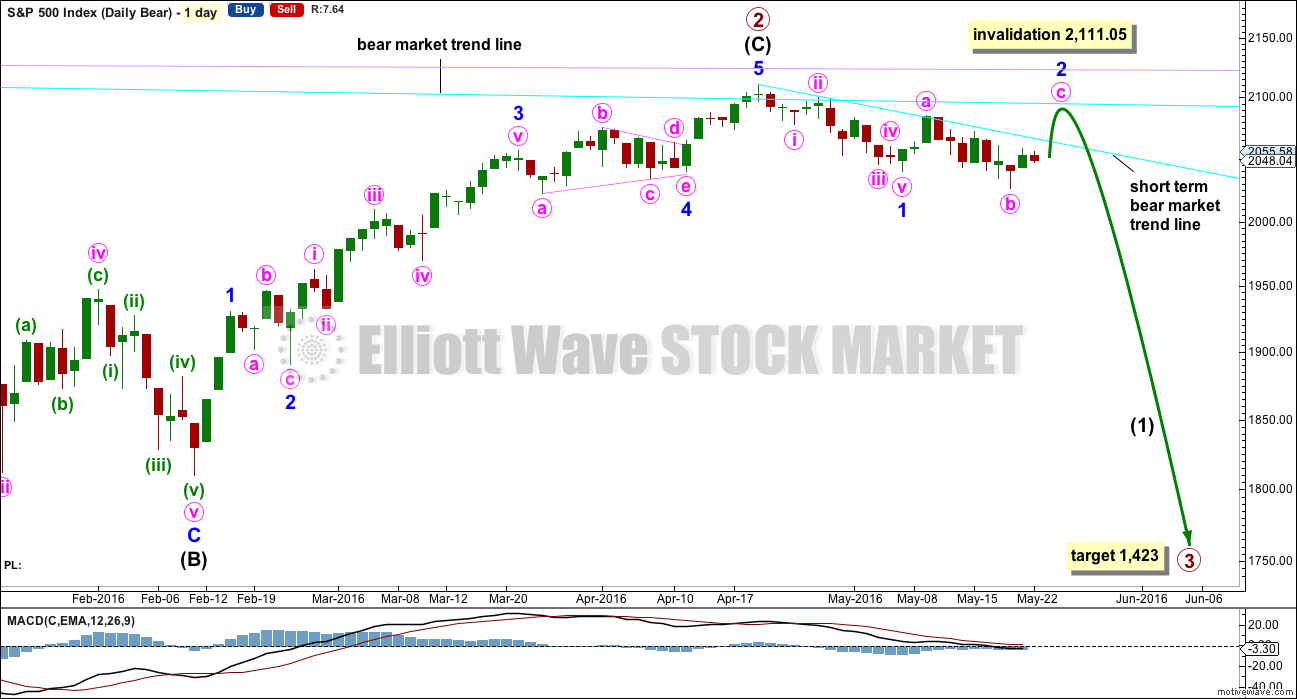
If intermediate wave (C) is over, then the truncation is small at only 5.43 points. This may occur right before a very strong third wave pulls the end of intermediate wave (C) downwards.
The next wave down for this wave count would be a strong third wave at primary wave degree. At 1,423 primary wave 3 would reach 2.618 the length of primary wave 1. This is the appropriate ratio for this target because primary wave 2 is very deep at 0.91 of primary wave 1. If this target is wrong, it may be too high. The next Fibonacci ratio in the sequence would be 4.236 which calculates to a target at 998. That looks too low, unless the degree of labelling is moved up one and this may be a third wave down at cycle degree just beginning. I know that possibility right now may seem absurd, but it is possible.
Alternatively, primary wave 3 may not exhibit a Fibonacci ratio to primary wave 1. When intermediate waves (1) through to (4) within the impulse of primary wave 3 are complete, then the target may be calculated at a second wave degree. At that stage, it may change or widen to a small zone.
If minor wave 2 is incomplete, then it may not move beyond the start of minor wave 1 above 2,111.05.
If minor wave 2 continues higher, then it may end when price finds resistance again at the bear market trend line. First, it needs to break above resistance at the short term bear market trend line.
MAIN HOURLY CHART
Click chart to enlarge.
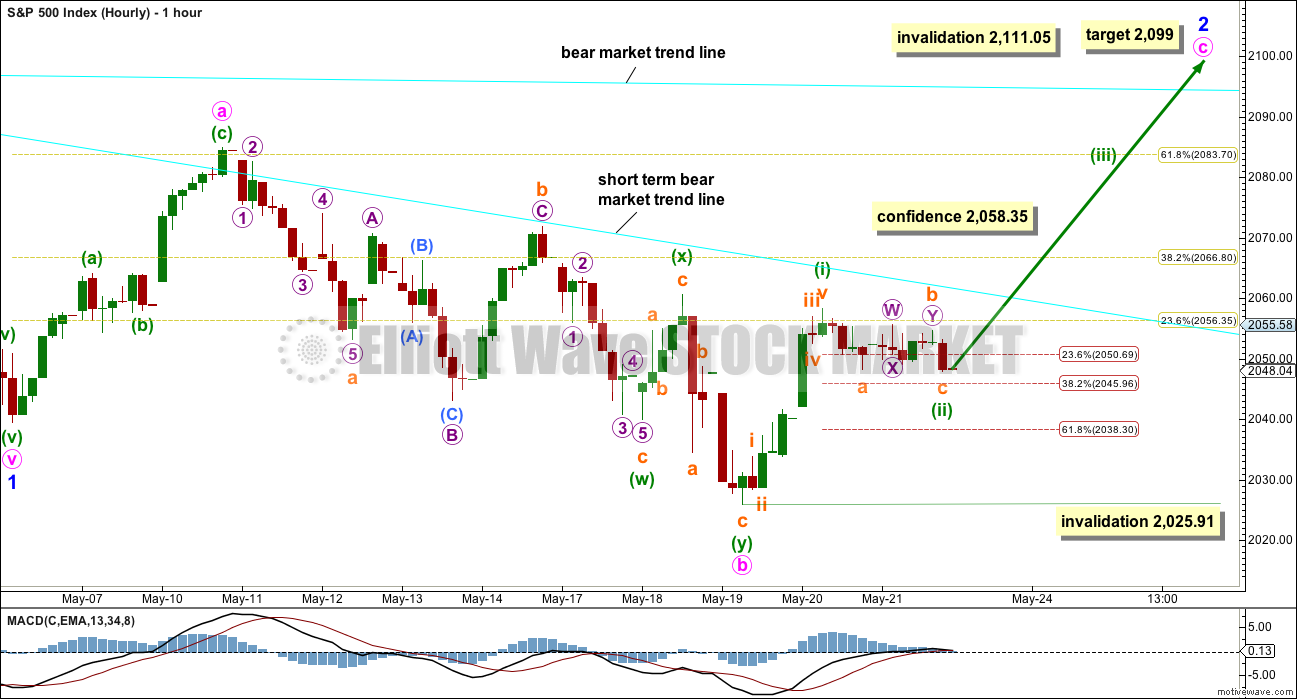
Minor wave 2 may be still unfolding as an expanded flat correction. Within the flat, minute wave a is a complete three, a zigzag. Minute wave b is also a three, a double zigzag, and at 1.30 length of minute wave a is nicely within the normal range of 1 to 1.38.
The subdivisions of minute wave b fit perfectly on the hourly and five minute charts. Within the double zigzag, minuette wave (x) is brief and shallow and minuette wave (y) moves below minuette wave (w) deepening the correction and achieving its purpose. The structure has a downwards slope and looks like a reasonable double zigzag.
At 2,099 minute wave c would reach 1.618 the length of minute wave a. This would see minor wave 2 end with a slight overshoot of the bear market trend line and close to the round number pivot of 2,100, both of which should provide very strong resistance.
If this wave count is right, then we may be offered a gift from the market for the perfect short entry to ride primary wave 3 down.
A new high above 2,058.35 now would invalidate the alternate below and confirm this main wave count at the hourly chart level.
In the short term, minuette wave (ii) may be a complete zigzag. It may be over at Monday’s low, or it may yet continue lower when the next session opens for Tuesday. If it does continue lower, then it may end about either the 0.382 or 0.618 Fibonacci ratios. The 0.382 ratio is favoured in this instance because there subminuette wave c would be close to equality in length with subminuette wave a.
Within minute wave c, minuette wave (ii) may not move beyond the start of minuette wave (i) below 2,025.91.
If minor wave 2 is to total a Fibonacci thirteen daily candlesticks, then it has only two days left in which the structure must complete. It may be able to do so if tomorrow moves price strongly higher, but at this stage it looks unlikely. It looks like minor wave 2 may need more than two more sessions to complete.
ALTERNATE HOURLY CHART
Click chart to enlarge.
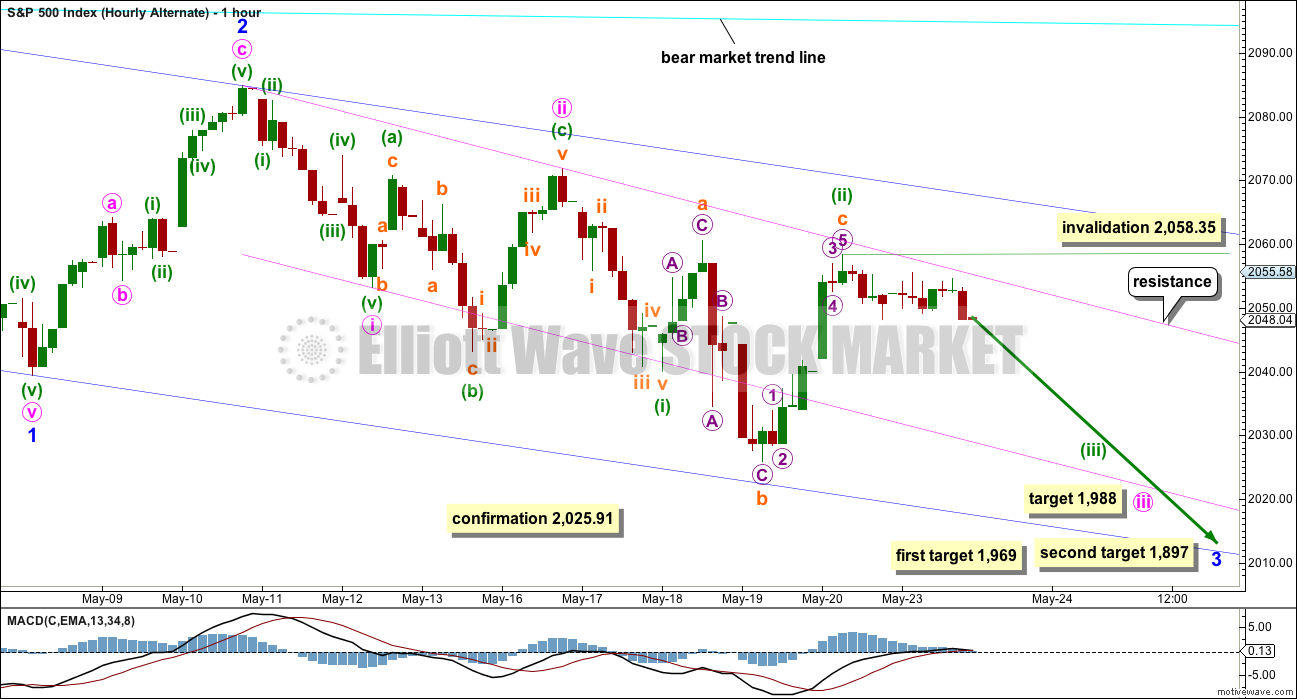
This was the main wave count up to the end of last week. It is relegated to an alternate now for two main reasons:
1. Minuette wave (ii) is seen as a rare running flat. This reduces the probability of the wave count.
2. At the weekly chart level, On Balance Volume is no longer clearly bearish short term.
If minor wave 2 is over, then it is a more brief zigzag. Within downwards movement from the start of primary wave 3, this wave count sees three overlapping first and second waves.
Minuette wave (ii) has a complete structure but subminuette wave c has failed to move beyond the end of submineutte wave a at 2,060.61. It is truncated by 2.26 points. This is possible, but it does not have a very good probability.
Downwards and sideways movement for Monday’s session is not part of the upwards wave labelled subminuette wave c, because it is too far out of proportion with all other small corrections within it. This looks like a new wave. It is unconvincing for the start of a third wave at three degrees.
At 1,988 minute wave iii would reach 2.618 the length of minute wave i.
The targets for minor wave 3 remain the same. At 1,969 minor wave 3 would reach 1.618 the length of minor wave 1. If price gets to this first target and the structure is incomplete, or if price keeps falling through this first target, then the second target will be used. At 1,897 minor wave 3 would reach 2.618 the length of minor wave 1.
BULL ELLIOTT WAVE COUNT
WEEKLY CHART
Click chart to enlarge.
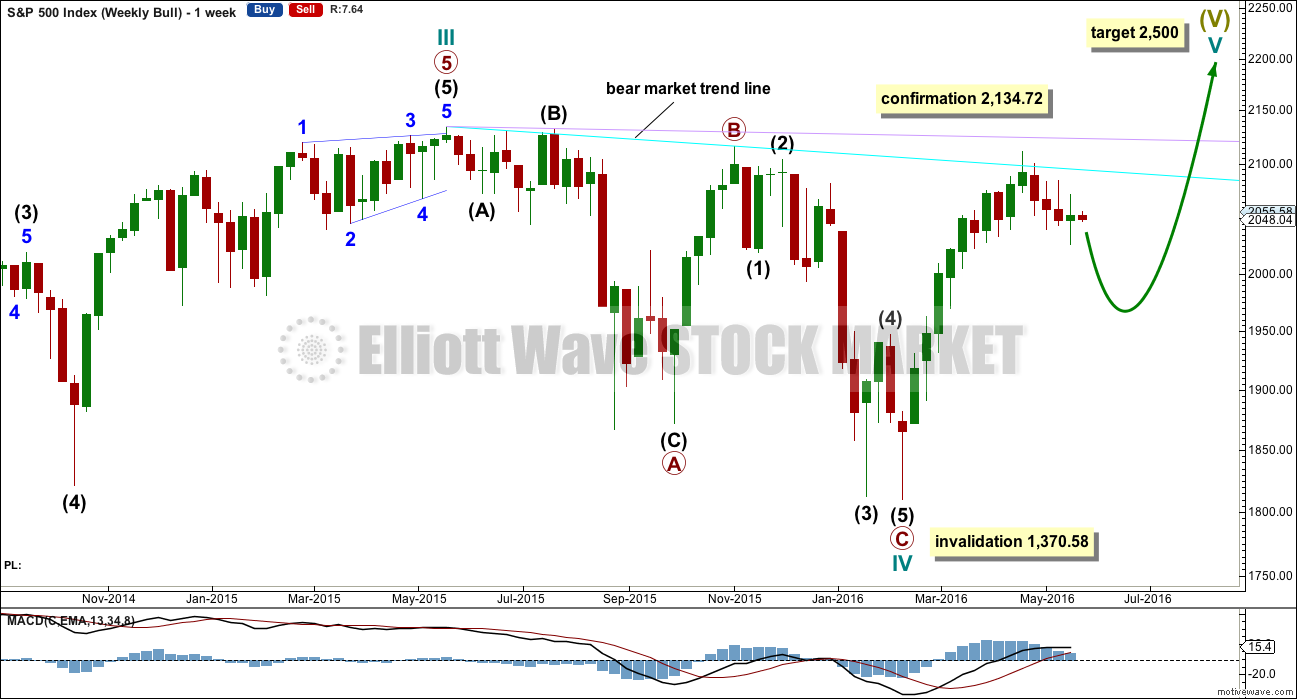
Cycle wave IV is seen as a complete flat correction. Within cycle wave IV, primary wave C is still seen as a five wave impulse.
Intermediate wave (3) has a strong three wave look to it on the weekly and daily charts. For the S&P, a large wave like this one at intermediate degree should look like an impulse at higher time frames. The three wave look substantially reduces the probability of this wave count. Subdivisions have been checked on the hourly chart, which will fit.
Cycle wave II was a shallow 0.41 zigzag lasting three months. Cycle wave IV may be a complete shallow 0.19 regular flat correction, exhibiting some alternation with cycle wave II.
At 2,500 cycle wave V would reach equality in length with cycle wave I.
Price remains below the final bear market trend line. This line is drawn from the all time high at 2,134.72 to the swing high labelled primary wave B at 2,116.48 on November 2015. This line is drawn using the approach outlined by Magee in the classic “Technical Analysis of Stock Trends”. To use it correctly we should assume that a bear market remains intact until this line is breached by a close of 3% or more of market value. In practice, that price point would be a new all time high which would invalidate any bear wave count.
This wave count requires price confirmation with a new all time high above 2,134.72.
While price has not made a new high, while it remains below the final bear market trend line and while technical indicators point to weakness in upwards movement, this very bullish wave count comes with a strong caveat. I still do not have confidence in it.
The invalidation point will remain on the weekly chart at 1,370.58. Cycle wave IV may not move into cycle wave I price territory.
This invalidation point allows for the possibility that cycle wave IV may not be complete and may continue sideways for another one to two years as a double flat or double combination. Because both double flats and double combinations are both sideways movements, a new low substantially below the end of primary wave C at 1,810.10 should see this wave count discarded on the basis of a very low probability long before price makes a new low below 1,370.58.
DAILY CHART
Click chart to enlarge.
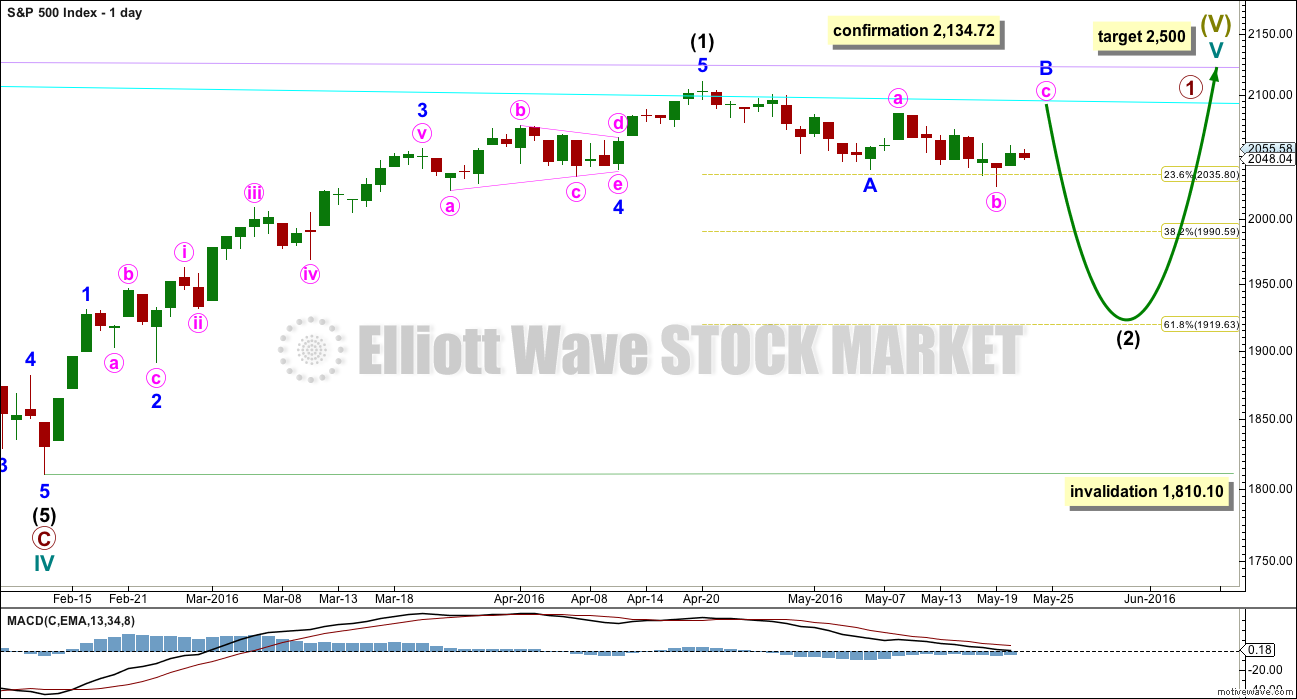
If the bull market has resumed, it must begin with a five wave structure upwards at the daily and weekly chart level. That may today be complete. The possible trend change at intermediate degree still requires confirmation in the same way as the alternate hourly bear wave count outlines before any confidence may be had in it.
If intermediate wave (2) begins here, then a reasonable target for it to end would be the 0.618 Fibonacci ratio of intermediate wave (1) about 1,920. Intermediate wave (2) must subdivide as a corrective structure. It may not move beyond the start of intermediate wave (1) below 1,810.10.
In the long term, this wave count absolutely requires a new high above 2,134.72 for confirmation. This would be the only wave count in the unlikely event of a new all time high. All bear wave counts would be fully and finally invalidated.
TECHNICAL ANALYSIS
WEEKLY CHART
Click chart to enlarge. Chart courtesy of StockCharts.com.
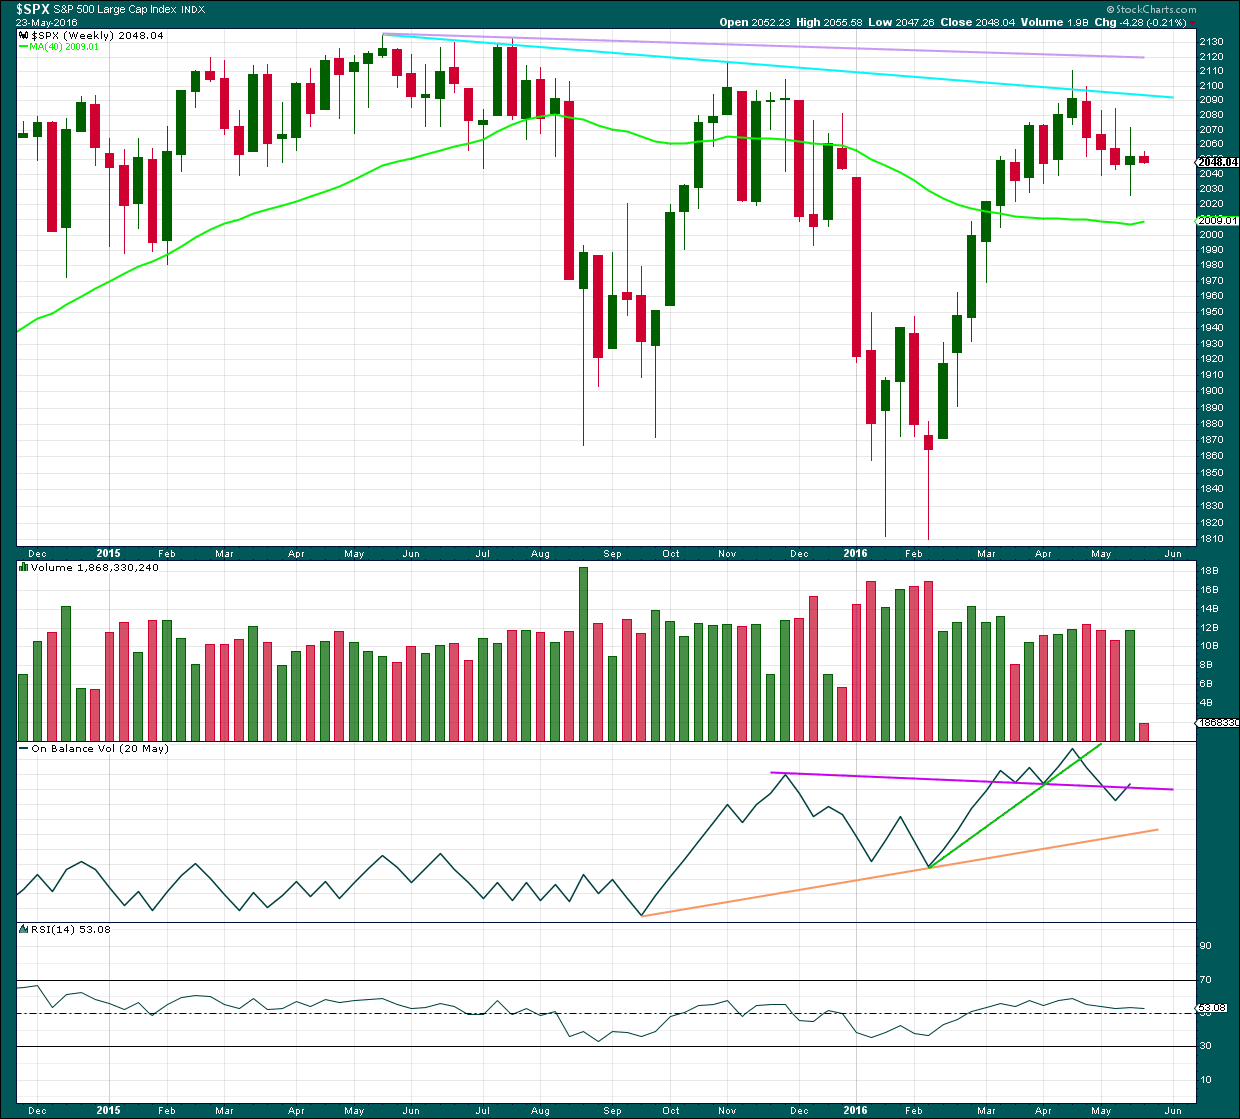
There is a bearish engulfing candlestick pattern at the last high. This has occurred at the round number of 2,100 which increases the significance. Volume on the second candlestick is higher than volume on the first candlestick, which further increases the significance. That it is at the weekly chart level is further significance.
Engulfing patterns are the strongest reversal patterns.
Now this pattern is followed by another red weekly candlestick. The reversal implications of the pattern are confirmed.
This is a very strong bearish signal. It adds significant weight to the expectation of a trend change. It does not tell us how low the following movement must go, only that it is likely to be at least of a few weeks duration.
Last week’s candlestick has a long upper shadow and is again red which is bearish.
There is also a Three Black Crows pattern here on the weekly chart. The first three red weekly candlestick patterns are all downwards weeks. The pattern is not supported by increasing volume and only the third candlestick closes at or near its lows; these two points decrease the strength of this pattern in this instance. That the pattern occurs at the weekly chart level increases its strength.
On Balance Volume broke below the purple line and is now returning to just above it. The bearishness of the break below the purple line is negated.
DAILY CHART
Click chart to enlarge. Chart courtesy of StockCharts.com.
Volume data on StockCharts is different to that given from NYSE, the home of this index. Comments on volume will be based on NYSE volume data when it differs from StockCharts.
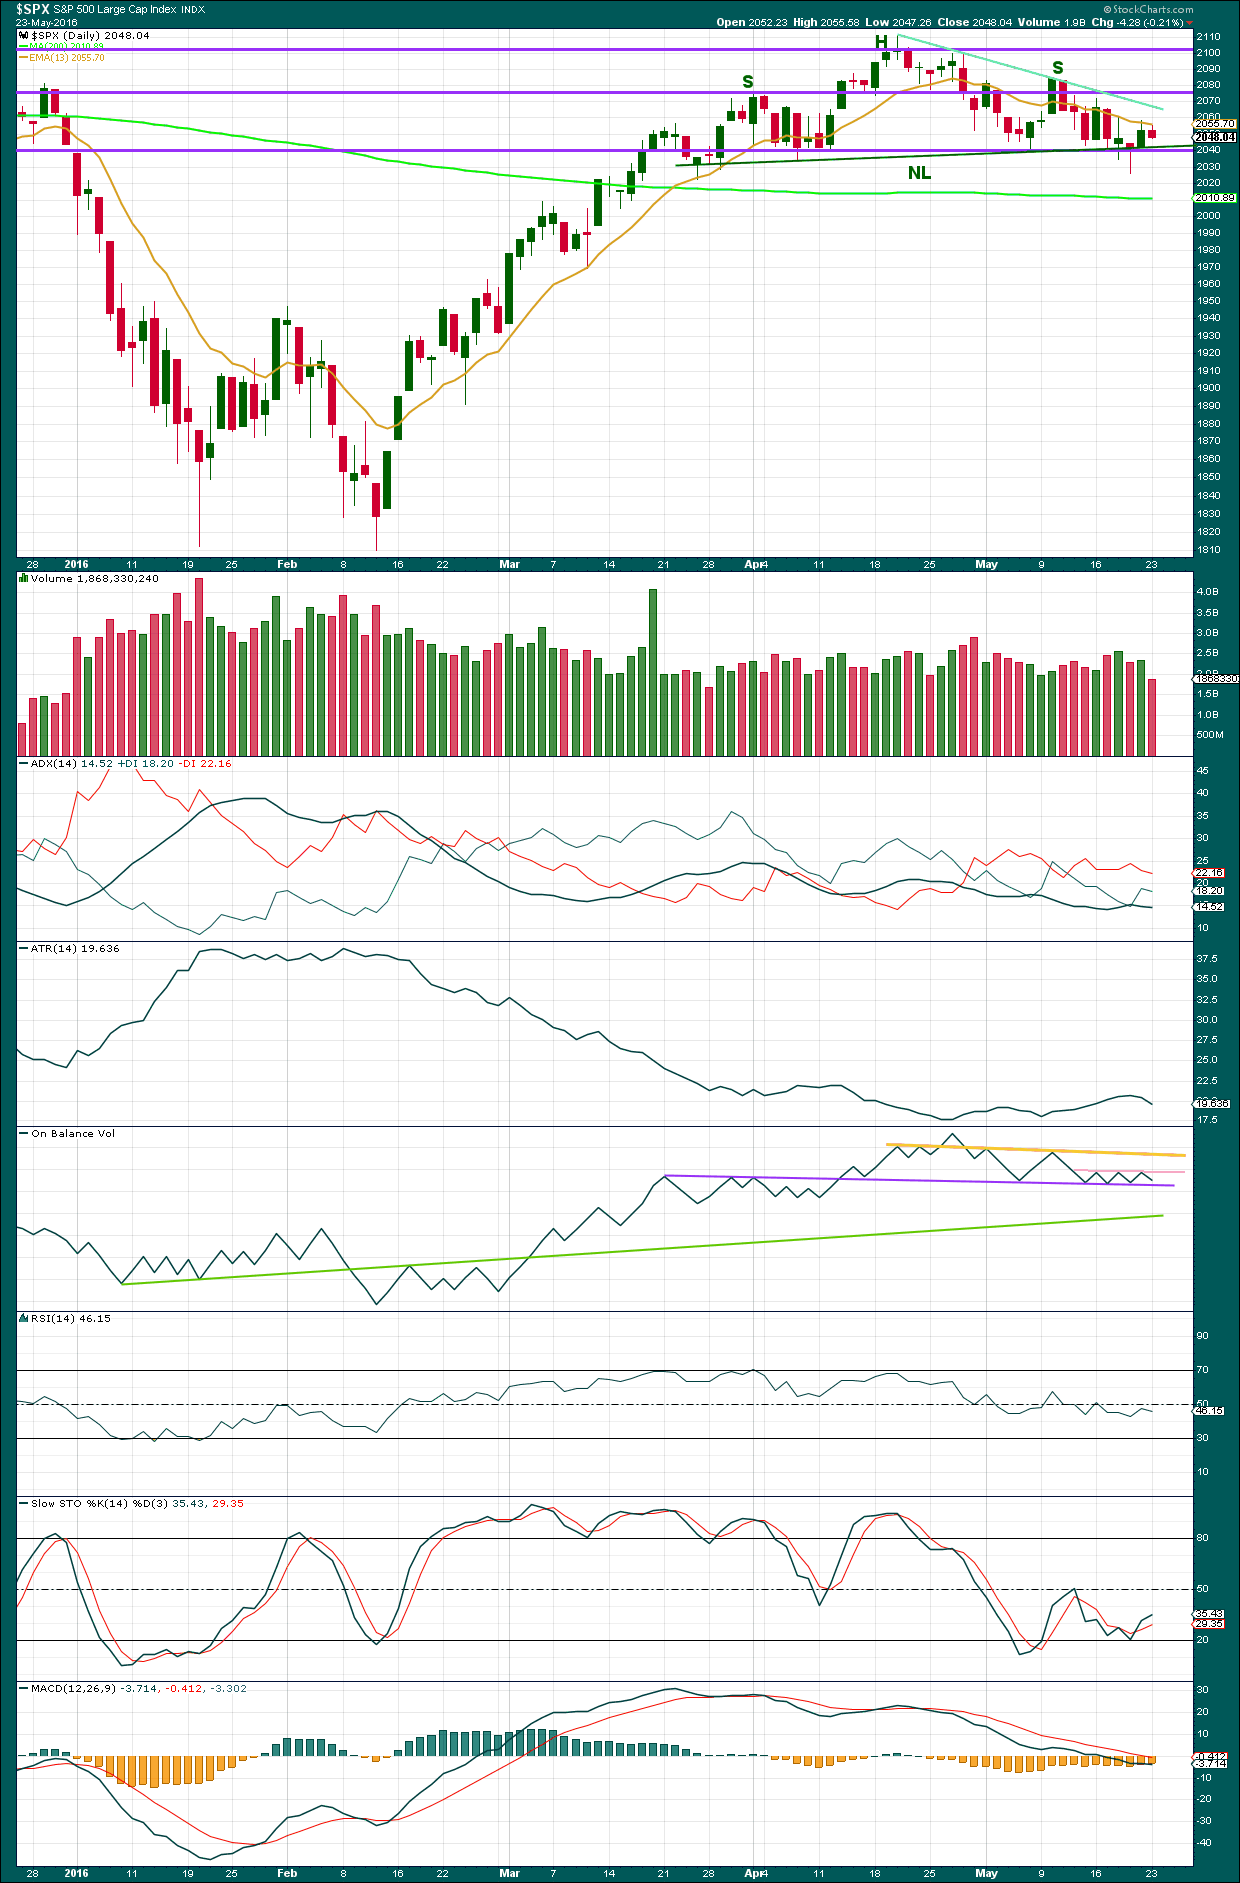
The hammer of Thursday’s candlestick is working to show a trend change, so far from down to up. It should be expected that price may find resistance initially at the sloping blue line and after that at the horizontal line about 2,080 and finally at the horizontal line at 2,100.
The Head and Shoulders pattern has not been confirmed with a breach of the neckline. Price cannot move below and stay below it. The neckline is drawn across the two lows between shoulders and head, from the low of 7th April to the low of 6th May.
There was some support for the rise in price for Friday’s session by volume. This usually indicates that the rise in price is not finished. Now for Monday’s session the small fall in price comes with lighter volume. A small inside day which closes red on lighter volume looks like a small countertrend movement, indicating it is reasonably likely that price shall continue higher until it finds resistance.
ADX is now slightly declining indicating the market is not trending. ATR is also slightly declining in agreement.
On Balance Volume has found strong support at the purple line. This line has very strong technical significance. The pink line is redrawn today to sit across the last three highs for OBV. A break above this new pink line would have some technical significance. It would be a short term bullish signal. If the pink line is breached, then the yellow line (which has reasonable technical significance) may provide resistance. A break below the purple line would be a strong bearish signal.
RSI is close to neutral. There is room for price to rise or fall.
Stochastics is returning from oversold.
VOLATILITY – INVERTED VIX DAILY CHART
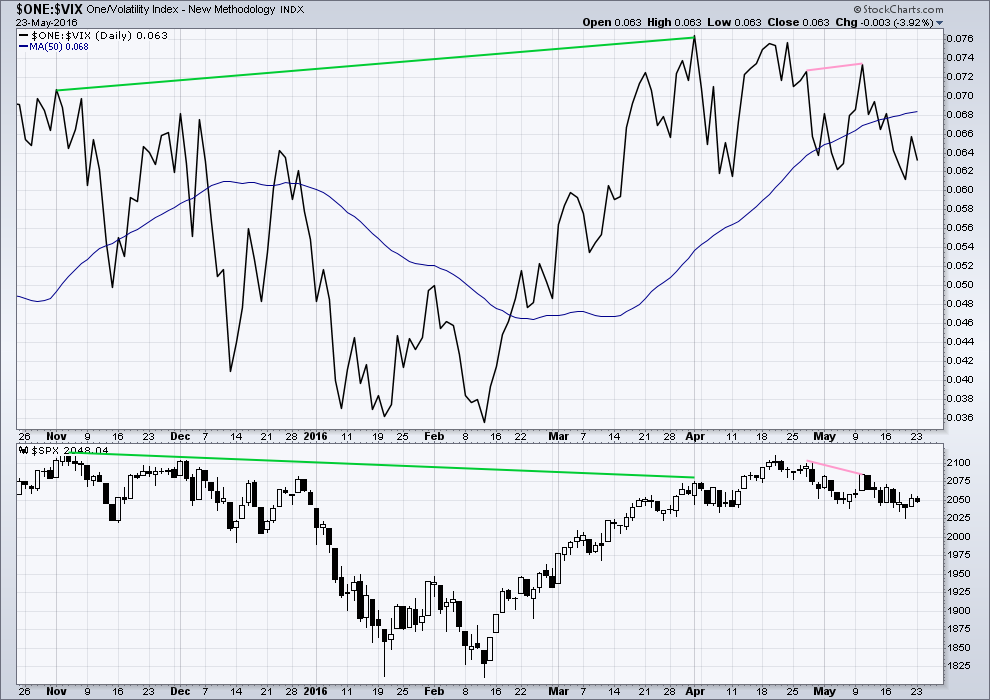
Click chart to enlarge. Chart courtesy of StockCharts.com.
Volatility declines as inverted VIX climbs. This is normal for an upwards trend.
What is not normal here is the divergence over a reasonable time period between price and inverted VIX (green lines). The decline in volatility did not translate to a corresponding increase in price. Price is weak. This divergence is bearish.
BREADTH – ADVANCE DECLINE LINE
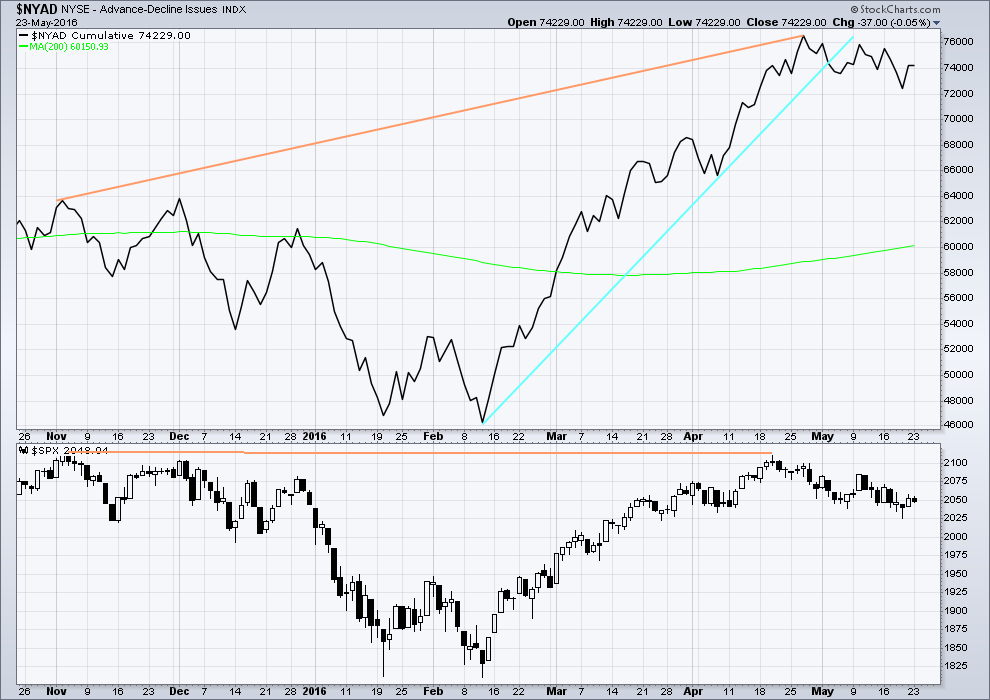
Click chart to enlarge. Chart courtesy of StockCharts.com.
With the AD line increasing, this indicates the number of advancing stocks exceeds the number of declining stocks. This indicates that there is breadth to prior upwards movement.
From November 2015 to 20th April, the AD line made new highs while price far failed to make a corresponding new high. This indicates weakness in price; the increase in market breadth is unable to be translated to increase in price (orange lines).
The 200 day moving average for the AD line is now increasing. This alone is not enough to indicate a new bull market. During November 2015 the 200 day MA for the AD line turned upwards and yet price still made subsequent new lows.
The AD line is now declining and has breached a support line (cyan). There is breadth to downwards movement; more stocks are declining than advancing which supports the fall in price.
The bullish divergence noted yesterday disappeared also for the AD line and did not yield a green daily candlestick for Thursday’s session. Again, this is an illustration of why divergence should be noted as one piece of evidence; on its own, it is not definitive.
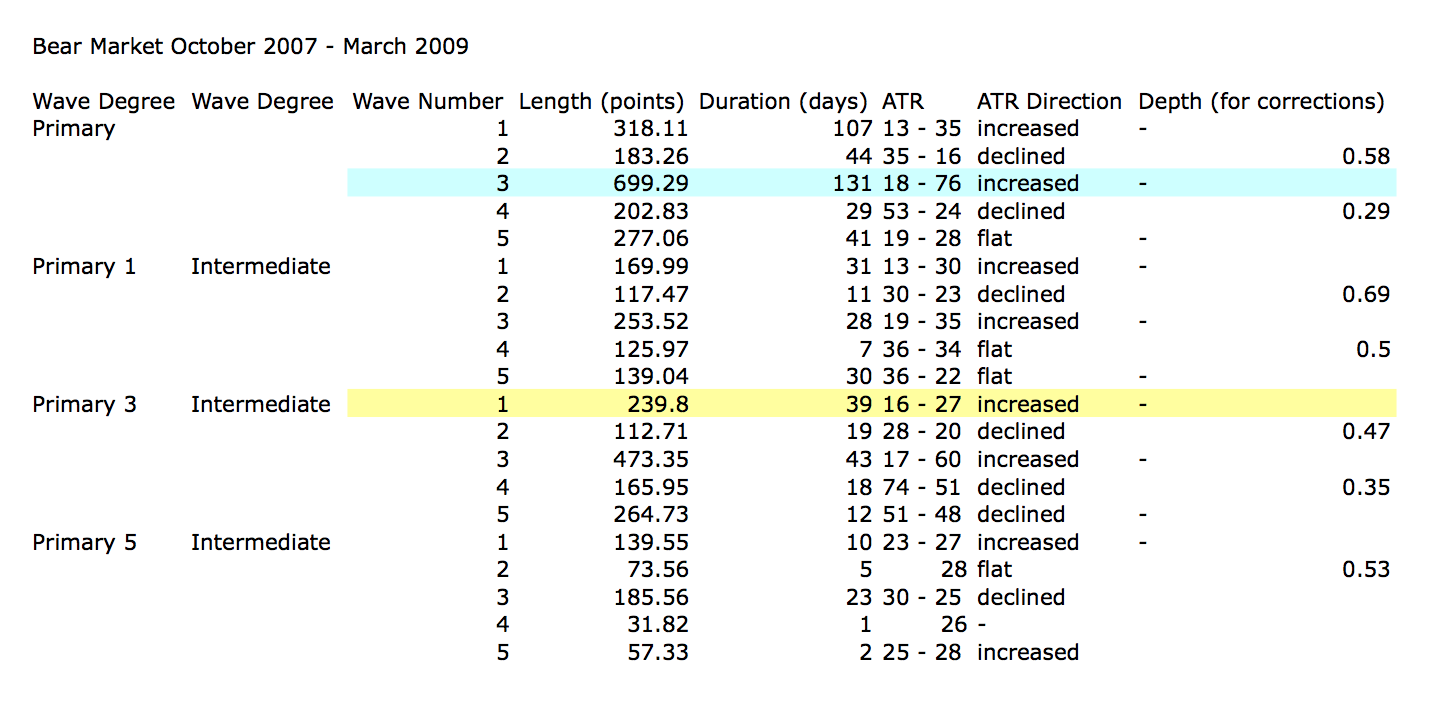
ANALYSIS OF LAST MAJOR BEAR MARKET OCTOBER 2007 – MARCH 2009
Click to enlarge.
In looking back to see how a primary degree third wave should behave in a bear market, the last example may be useful.
Currently, the start of primary wave 3 now may be underway for this current bear market. Currently, ATR sits about 19. With the last primary degree third wave (blue highlighted) having an ATR range of about 18 to 76, so far this one looks about right.
The current wave count sees price in an intermediate degree first wave within a primary degree third wave. The equivalent in the last bear market (yellow highlighted) lasted 39 days and had a range of ATR from 16 – 27.
To see some discussion of this primary degree third wave in video format click here.
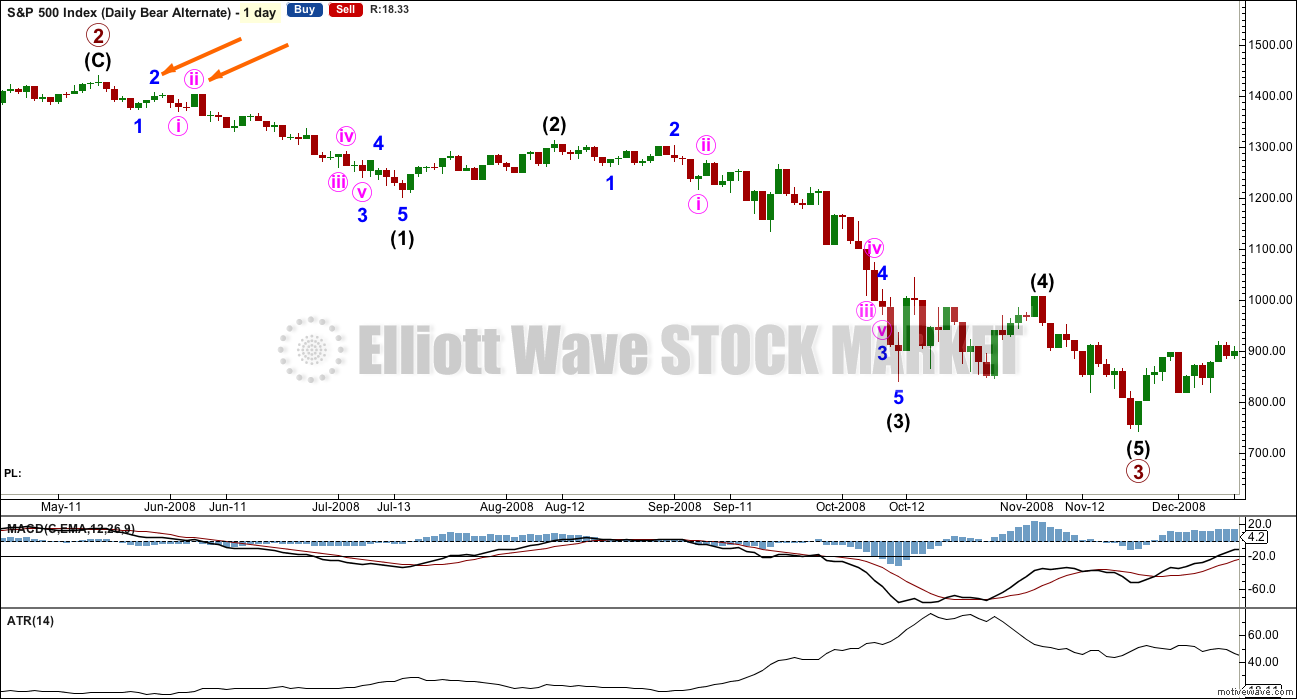
Click chart to enlarge.
This chart is shown on an arithmetic scale, so that the differences in daily range travelled from the start of primary wave 3 to the end of primary wave 3 is clear.
Primary wave 3 within the last bear market from October 2007 to March 2009 is shown here. It started out somewhat slowly with relatively small range days. I am confident of the labelling at primary degree, reasonably confident of labelling at intermediate degree, and uncertain of labelling at minor degree. It is the larger degrees with which we are concerned at this stage.
During intermediate wave (1), there were a fair few small daily doji and ATR only increased slowly. The strongest movements within primary wave 3 came at its end.
It appears that the S&P behaves somewhat like a commodity during its bear markets. That tendency should be considered again here.
Looking more closely at early corrections within primary wave 3 to see where we are, please note the two identified with orange arrows. Minor wave 1 lasted a Fibonacci 5 days and minor wave 2 was quick at only 2 days and shallow at only 0.495 the depth of minor wave 1.
Minute wave ii, the next second wave correction, was deeper. Minute wave i lasted 3 days and minute wave ii was quick at 2 days but deep at 0.94 the depth of minute wave i.
What this illustrates clearly is there is no certainty about second wave corrections. They do not have to be brief and shallow at this early stage; they can be deep.
This chart will be republished daily for reference. The current primary degree third wave which this analysis expects does not have to unfold in the same way, but it is likely that there may be similarities.
DOW THEORY
I am choosing to use the S&P500, Dow Industrials, Dow Transportation, Nasdaq and the Russell 2000 index. Major swing lows are noted below. So far the Industrials, Transportation and Russell 2000 have made new major swing lows. None of these indices have made new highs.
I am aware that this approach is extremely conservative. Original Dow Theory has already confirmed a major trend change as both the industrials and transportation indexes have made new major lows.
At this stage, if the S&P500 and Nasdaq also make new major swing lows, then my modified Dow Theory would confirm a major new bear market. At that stage, my only wave count would be the bear wave count.
The lows below are from October 2014. These lows were the last secondary correction within the primary trend which was the bull market from 2009.
These lows must be breached by a daily close below each point.
S&P500: 1,821.61
Nasdaq: 4,117.84
DJIA: 15,855.12 – close below on 25th August 2015.
DJT: 7,700.49 – close below on 24th August 2015.
Russell 2000: 1,343.51 – close below on 25th August 2015.
To the upside, DJIA has made a new major swing high above its prior major high of 3rd November, 2015, at 17,977.85. But DJT has so far failed to confirm because it has not yet made a new major swing high above its prior swing high of 20th November, 2015, at 8,358.20. Dow Theory has therefore not yet confirmed a new bull market. Neither the S&P500, Russell 2000 nor Nasdaq have made new major swing highs.
This analysis is published @ 09:41 p.m. EST.
Looks to me for ES at the 4H we have nice symmetry between the recent low and the high within the channel. I wonder if tomorrow is down?
ALERT: China… YUAN fix lowered! It’s now the lowest since 2011
Is there a link to corroborate?
The European Central Bankers are clowns of the first order. They again have futures jacked up a ridiculous 2% plus. The last time we saw this kind of bluster those markets were down at the start of trading…down big time. I will be watching the European open very closely; in this case the hapless banksters may actually give us a clue as to what is likely to transpire when US markets open…
The H&S pattern in both indices decisively negated today. That in no way means we are out of the woods. I have to smile at all the bullish celebrations underway. I do not think the uncertainty over the medium term will be resolved until we see how the market responds to the 1800 area. The bullish case will face that pivot as the last line in the sand and will have to establish a triple bottom there for the bullish case to remain viable imo. No doubt in my mind about the near term prospects; the only question is how deep…?!
Hey Olga:
Here is that hilarious Mike Myers Scottish skit…. 🙂
http://www.dailymotion.com/video/xgzfxs_if-it-s-not-scottish-it-s-crap_shortfilms
hee hee,,, holy hagass,, I was wundering where you came up with the Scottish crap thing
My humour can sometimes be a bit eclectic…I sometime mistakenly assume the same of my audience… 🙂
ROFL
That was a great laugh
Cheers Verne!
Glad it made you smile! 🙂
Ed Yardeni…. Market can go up 10% from here!
Roll out the Perma-Bulls!
SPX volume today 554.344 Million vs yesterday’s 520.674 Million. Wow, yesterday market was flat and today up big… You would think volume today would be more than double yesterday’s.
Good morning, a bit late here today sorry folks.
This upwards move isn’t done. Minute c has to move at least slightly above a at 2,084.87 to avoid a truncation.
If it can do it in one more day, tomorrow, then minor 2 would total a Fibonacci 13 sessions.
My job now is to figure out if minuette (iii) and (iv) are complete. I suspect it’s an impossible task. But that’s what I’ll be trying to do. With some reasonable probability.
For now the target at 2,099 remains the same. I expect it has a really good probability.
If price can reach it then the market players may turn overly bullish. Which would be necessary for this wave count to expect a big fall.
For what it’s worth, the current bid on trades closed today down from the highs. This suggest some kind of upward momentum peak achieved today. Have a great evening everyone!
A move above 12.16 gives an impulsive move up off the bottom for UVXY…looking for three wave move down if that happens to load remaining calls…
I can’t believe how low UVXY is… or to say it another way, how much price has eroded.
Glad it stayed above 10. Reverse split not likely. Calls can be had for cheap! 🙂
Calls Cheap? How cheap?
I think I am going to take a look at the calls for a spec trade.
Lara thinks we have some more upward movement to avoid a truncation.
If the market stays in character, he is going to ambush anyone going long into the close tomorrow, as well as those who failed to take profits today. That has been the pattern. It looked to me like a small impulse down off the day’s high and UVXY also had an impulse up off the bottom. You could get a better entry than I did on UVXY 12.00 calls expiring next week (I paid 0.92) if the market moves higher tomorrow. The low this morning was 11.92 for UVXY so I would look for it to make a higher low on any move up in SPX tomorrow and grab a few of those calls. Any price under a buck is imo a reasonably low risk entry. A couple contracts would be a good way to stick a toe in the water and won’t break the bank. 🙂
I just love seeing your sepculative side Joseph! You gotta live a little!
Will see how trading is tomorrow morning and then I will take a shot… maybe.
Expiring next week… that’s a hard trade for me to pull the trigger on.
One of the hardest things to do is adjust with the market. I really love doing my due diligence, entering my position, walking away and letting the trade play out. That is the way I prefer to trade. I just got tired of being right on the calls and seeing my position double or triple, then give it all back literally hours later when trading the indices. The only way to trade the current market is to mercilessly scalp it. Even when the third down gets going, I plan on taking money off the table early and often. The algo boys have ruined this market for position and directional traders. Allowing profitable trades to sit in this market is a sure way to turn winners into loosers…!
Sold 208 calls. Will hedge with 209 calls expiring this week if move up continues into close….
Take a look at the Unicorn folk…hit 11.92 and bounced hard. Adding next week’s 12.00 strike calls @ 0.92 per contract. Half order…. 🙂
I was just reviewing some previous posts by Lara around the July / Aug 2015 top and the Nov / Dec top.
My primary observation is how the July correction morphed into an expanded flat like this second wave is morphing into.
Of course the 2084 level should be taken out to avoid truncation.
Ideally for my trading I’d like to see the top hang around for a few days near the 2100 level, but I also recognize (like Vern mentions) that a quick dump could also follow this low-volume dip buying.
There is a bit of seasonality at play with end-of-month and a holiday combined, in that there is a slight upward bias to both of those events. I’m holding some near-the-money calls that expire next week to hedge my ES short position.
Looking a couple of waves ahead, the last two tops have seen a series of embedded 1-2s that are pretty deep (and difficult to trade)…I’ll be watching for a more “impulsive” type of wave that extends vs. deep 1-2s to kick off this 3rd wave down.
A quick note on the Fed, my commercial banker at Chase has forwarded that there internal “Fed people” believe no rate hike before the Brexit vote in June, then most definitely in July. It’s all in the waves…
GLTA
Very conflicted about my hedges. Mr. Market has turned hijacking profits into a fine art and I have a feeling he is going to do the same thing with in-the-money calls left in the market over-night. I think I will sell SPY 208 calls and pick up a few 210 to remain hedged against a blow-off spike up tomorrow…thinking out loud…. 🙂
Boy am I glad I exited that huge spread trade. A good reminder not to fall in love with what we THINK the market should do…
This is a classic blow off move up; this kind of move has not seen meaningful follow-up for many months. I would be cautious on the long side here folk…
The FED has ZERO credibility! ZIP… ZERO!!!!
Don’t anticipate because they are all just LIEING!
ONLY pay attention after ACTUAL ACTION is TAKEN! Otherwise it’s the status quo until ACTUAL ACTION!
Just Remember They ALL LIE!
The FED holds the public at large in utter contempt. I cannot imagine who exactly their audience is when they start jawboning about raising interest rates. Their next move will be to take back the last rate hike. They have no choice!!
Gadzooks! People cannot possibly be that STUPID… 🙁
I pay no attention to them.
I only know they’re making some kind of statement when members here mention it.
I have better things to do 🙂
I don’t think they move the market though, as much as they would like to think they do. The market will do what it will do, no matter what the Fed says. I know that’s also a rather unpopular statement to make.
We are about to find out if this is three or five up; I think it is three….
Maybe not….??
We should be seeing much more momentum for a third up….must be five….
Starting to nibble at UVXY calls. Like the hourly setup with RSI and stochastics both oversold now. Very short term and small position bought 14.5 calls for .38. Probably a little early.
Waiting for a break of 12.00, followed by an impulsive five up…
Sometimes an ETF can help us with the count on the underlying asset. For instance, SQQQ (chart below) is showing a potentially completed Minor 2 which means QQQ could have finished Minor 2 as well. The implication would be that SPX is not far behind and this lends support to the main hourly bear count.
Nice find!
And I am able to post a chart! Goodie for me.
I guess I’m in the unpopular minority here but i just don’t see any of the bear counts noted here unfolding.
As I got badly burned following the bear count after the Feb lows (and so have disregarded it ever since) i would encourage all to take a good objective look at the daily chart of the bull count and tell me if that is not what price has been printing?
A new alt bear count appears every week, or so it seems, but to me the one count that HASN’T significantly morphed is the one indicating that primary IV completed in Feb 2016 and we are now on the next leg up in this crazy CB and algobot fuelled bull market.
I know that all the technical indicators in the world are pointing down, but that is also what every trader in the world sees… and for that reason alone the odds of it playing out are low probability in my book…
I just don’t want anyone to get burned positioning themselves for 1400 in the SPX when the chances of that this year (i believe) are very slim indeed.
Choose to disregard my ramblings if you disagree, but for those who like confirmation, copy the following into your notes and see how it plays out…
We top tomorrow in the 2080’s before moving down to 1950 early June then rallying all the way into the good old 4th July…. to over 2100. That will complete wave 1, then we spend the next few months tracing out a wave 2.
THEN we get a third wave, leading to new ATH’s in 2017…
Not posting to be controversial or contrarian, posting in the hope it’s helpful to someone.
GL
Like!
Yes we have… After 3 years of false starts and waiting… The Bear Wave is finally here… since May 2015.
It’s good to see so many doubters! AND that is NOT just from people here! We here who believe are the very few!
Something I tell myself daily…”Trade the market that I see, not the market I want to see!”
Staying nimble and having an open mind about direction is everything.
Thanks Stuart so much for your comments and thoughts. Lara has the bull count because it can work out that way. She does not have much confidence in it though. As we move down into the high to mid 1900’s, the shape of the waves should tell us which way we go from there. Until then, no matter the count, I am expecting a correction to the move from 1810 to 2111. What we have see so far is insufficient. Thanks again.
By the way, questioning the count in no way makes you unpopular in my book. We need it.
What you are saying has to be taken very seriously Stuart and anyone who dismisses what you are saying as rambling is in my opinion not very thoughtful.
The fact of the matter is that if you try to trade this market based on what you expect, as opposed to what the market actually does, you WILL get burned. I do not trust this market and my current approach to trading it, regardless of what I think the wave count is, is to square accounts daily. Whether you are a bull or a bear, it has got to be clear to even the most casual observer that you cannot make directional trades in this market. I really appreciate your comment, despite my own view that the bearish count has a lot of ancillary supporting evidence. Thanks much for giving a different perspective
Always good to question the count. Yet I believe the sentiment is with you to the overally bullish side. Blue line is up over 45 level in the chart typically indicates a drop is going to take place. Who knows how many points though is the other question….anyone else have more current sentiment numbers?
71% Bullish is all I need to know… A reliable Index that has been around for decades:
http://www.barrons.com/public/page/9_0210-investorsentimentreadings.html
Hi Peter,
Thanks for the chart. I fully expect a pullback (and soon) just not to the magnitude that supports the bearish wave counts.
1950+ is my bet, not below. And we should see that level in early June
I rather much prefer being bearish (currently short FTSE and will open another short position on ES either tonight/tomorrow morning) but I’m not seeing the longer term bearish perspectives playing out, even though that would be my overall preference.
I have learned not to underestimate what “they” will do to keep this thing afloat. And we all know that when this thing unwinds, it will be very, VERY messy, but to me that’s a few years off yet…
And hey, if you needed a reason to be longer term bullish just check out what the Gartman indicator is saying. Right now he’s bearish 🙂
we’re not too far off then, maybe 1820 area for me. Just don’t believe IV is over with yet and won’t be until late 2017 or early 2018. Not enough time has passed from the 2009 low and not low enough price to provide a real correction from the July 2015 top of the SPX. Plus, as posted awhile back there just is no cash money (per the Merrill Lynch/BofA data/charts they publish) to go up into new highs at this time for a Primary V.
Speaking of cash, it would surprise an awful lot of people to learn how much of this market’s rise has been due to companies buying their own shares, which in turn was financed with debt. The sword of Damocles hanging over the US equities market is not primarily the declining top and bottom line revenue, but rather its exposure to mountains of corporate debt, assumed while interest rates were artificially suppressed. Those bonds are going to blow up, and I think it is going to happen in 2016. Declining revenues brought on by recessionary conditions in the US is going to be contractionary (massive deflation due to disappearing demand), the implosion of the corporate bond market is going to be catastrophic. Virtually no one has this inevitable outcome on their radar when they talk about the future of the equities markets…a huge mistake in my humble opinion…
Thanks for your thoughts, it is really helpful.
We need to look at all possibilities, especially what is in front of us in the actual markets.
Your comment is most welcome Stuart.
Although I have no confidence in the bull wave count I keep publishing it because it is technically possible. What if I’m wrong? That’s certainly happened before. I’ve learned the hard way to be open to other possibilities.
While we see many bearish technical indicators there are plenty of other analysts out there seeing bullishness in this market.
I keep looking, truly I do. If you have any technical indicators which are bullish (indeed, any members) particularly at the weekly and monthly chart levels, then please do share.
All information should be taken into consideration.
Volume again remarkably light today. The story book ending to this move would be a final spike up today followed by an immediate impulsive reversal to the downside. Either way, at the close I will be exiting my final upside hedges in the form of a few 208 SPY calls regardless…this is the eye of the hurricane…
Final move down in UVXY underway and another new low at 20.17….Holy Smokes!!
We really could bust the 12.00 floor…
I guess that bullish hammer three days ago on the daily charts was the real McCoy. We were also at the lower band of the daily Bollinger Bands. Now were are headed to the upper Bollinger Band which is around 2090. This move will help to expand the bands for the move down.
Minuette 3 equals Minuette 1 around 2079. If I am correct this is the area of the bear market trendline from the ath.
Yep. It has been a reliable signal the last few times we have seen one.
We now have a double tap at 12.20 on both 1 and 5 min charts for UVXY with a rounding bottom. We could start to see some persistent divergence with SPX price if we are close to a top….
The banksters really like to ramp things up at the end to try and shake out early birds taking short bets….
I am glad you also noticed the rounded bottom on UVXY. I’ve been watching it. It started mid February at 60. If it is in fact a rounded bottom that completes, it projects a target of 60 around the end of September. However, what so often looks like a rounded bottom so very often morphs into something else.
Correction: Lara’s bear market trendline shown clearly on the main hourly count. It is around 2095.
The corrective waves are annoyingly protracted. Either a meandering fourth wave or possibly sub-min two, the latter of which implies even greater mania upwards ahead…
Maybe Minute B of Minor 2 was not over at 2026, and is tracing out a triangle 😉 ??? Might explain price not wanting to go out of the base channel atm…
A move below 2058 & 2047 before we get a clear 4th and 5th wave may point to a larger corrective sideways structure for wave B of Minor 2 playing out.
I really want to see this resolved as an expanded flat rather than it going complex though…. How much longer could Minor 2 play out before it started looking odd??
EDIT: I think the structure would be too big, so give is a low probability, but I’m keeping an eye on it.
Looks like we get to 2085 in the lunch hour to ~2:00PM – Then down, down, down… Once & for all.
That would be quite a monster for minor two if minute B not yet done.
I’m starting to think we have another lazy small degree second wave correction…
Fourth new low at 12.20 for UVXY…how low…can it go…?!
Yeah I agree – it’s on the back burner atm unless price causes me to reconsider.
If I understand correctly what you mean, then another 2nd would suggest the huge move up today was only sub min 1 of minuette 3 – which would make this current wave potentially huge – (possibly making new ATH).
I’m therefore thinking we are finishing off minuette iii and min iv will start soon.
Still very suspicious atm that price is still contained within the base channel.
Move above 2085 would elliminate triangle
Forget that last line – move above 2085 wouldn’t eliminate (running triangle), but the odds would be low imho.
I really need to stop trying to beat the edit timer 🙂
Gotta be quick!
We could get a three up shorter than one (if just one done), and a five up shorter still…..
Nasdaq 100 (NDX) chart attached; 2 hour one. Possible wave count.
Any reason you expect it’s corrective rather than impulsive?
I’m assuming you are not labelling wave A as 3 waves as your B target is not high enough for a flat.
Looking at the weekly chart of the Nasdaq 100 (NDX) is my reasoning as to why. It made its high on November 30th, 2015 (long after the July 20th, 2015 high of the weekly SPX). Since Nov.30th top there was a clear 5 waves down for a larger “A”. After that A a larger “B” three waves up appears to be taking form, counting up from the Feb.8th, 2016 low.
Is the count on your chart part of ‘larger “B”’ (i.e. you are expecting B to go higher) or has that now finished at top of your chart?
If ‘larger’ B has finished, presumably you are now expecting a 5 wave move down from the top of your chart for a C wave?
If you could place a label at the top of your chart so I can see the larger context I won’t ask so many daft questions 🙂
Weekly NDX chart. Large A down done in Feb.2016. Currently in large B now, a is done as of April 20th, 2016, in b down now, then c would be back up again to complete the B. Other counts would be great to see too.
Thanks Verne
Nice to know there are other members in the UK
I can only see the isle of Arran though and on a clear day Northern Ireland.
http://www.inverkip.com
Lovely view over Scottish Mountains today!
As a follower of this site and EWI I notice the strong divergence between wave counts with EWI strongly biased towards the push from early Feb being wave 1 of a final 5th wave. This was also discussed in the latest EWI theorist and would fit in with Lara’s bullish option which I know is not favoured. I will wait with keen interest to see what happens in the next week or so!
A nice whisky is waiting once the fog clears.
I can see England, Ireland, Scotland and Wales today 🙂
(you need to look in different directions though!)
https://en.wikipedia.org/wiki/Snaefell
If it ain’t Scottish, it’s crap! 🙂
Welcome Geoff!
Whaaaaat!!!
Not sure I agree with that one Verne old boy 🙂
Just an old line from Mike Meyers of Saturday Night Live fame…. 🙂
Nice save 😉 🙂
He must have been referring to whiskey…. 🙂
Isn’t it whisky for the Scots version, and whiskey is the Irish version?
I’ve got quite a lot of Scots in me. My mothers maiden name was Monteith.
New to post. Hello everyone. Just shorted SPX at 2073. 60 minute chart close outside upper BB. Also oversold stochastics. Too good of a setup. In the past, when you get these conditions, usually very profitable in short term (3-5 days). Bought 204 SPX put @.56
Looks like you picked up the SPY puts expiring next week. I would like to see an impulse down on the five minute chart accompanied by a sprint by the Unicorn off the bottom to mark the top. Those puts are probably going to get a bit cheaper but if you don’t mind being temporarily under water you should make some coin… 🙂
Minuette five up underway…
Thanks so much. Do not mind at all if I am underwater as long as the desired outcome is accomplished! I enjoy reading your posts- very insightful!
Welcome Craig and all new members. Thanks for posting and sharing ideas and strategies.
Looking at the nasdaq chart it has a clear picture of 5 down and an ABC correction, Just looking like C wave now, if this is the case would the S&P fit better if this wave is Minute 2 of minor 2?
Without a chart I’m not sure what you are seeing, but different indexes can have a different count. They often align eventually to rise / fall together.
Not sure if it is valid or not but this is what i see
I can’t get your (iii) of minute i of Minor 2 to sub-divide as an impulse (that doesn’t mean it won’t – but I can’t) . Also wave (v) at the same degree (to 2026 low) looks like a clear 3 wave structure to me.
Move up today should reach 2085 to avoid a truncation which would settle any doubts Minor 2 ended there.
Just my humble opinion 🙂
Having said all that (!!) – this move up from 2026 is acting more like a zig zag ABC correction atm (staying inside the base channel), albeit I still expect that will be resolved with a bit more time.
But… a move now below 2058 and finally 2047 without first getting a clear 4th and 5th wave would leave me scratching my head and looking for a possibly larger corrective pattern.
You’d have to resolve the middle of both of those third waves. Can you get them to subdivide as impulses?
When I’m trying to figure out a wave count it is always the middle of the third wave which I focus on for impulses. They can only subdivide as impulses.
Thanks! Just as olga was saying, so 3rd waves are usually quite strong clear 5 waves which are classed as impulsive moves. Everyday is a school day 🙂
I think minuette four on deck…
Minuette 3 currently shorter than Minuette 1. It is still finding resistance at the upper base channel.
I expect it will evenually break through and go a bit higher, but if it is finished as you suspect then Minuette 5 would need to be shorter than 3.
A move below 2058 would be the first shot across the bow.
I vote for a short sweet wave five… 🙂
This market is not allowing neither bulls nor bears to repose on gains; I think the whack-a-mole market action will continue….
Like Aug 17/18.
If SPX follows that pattern, next week while I am away, there will be fireworks and it will be a wonderful homecoming at the end of the week.
I like the fractal, it’s been following very well. Not sure we get a 10% drop in 6 trading days but if we do I’ll take it.
If you don’t spot Momma Grizzly I’d settle for a couple ‘o cubs… 🙂
Looks like the Unicorn tracing out a contracting triangle fourth. A nice spike down should be on deck….
Count is fairly obvious atm – but here’s a chart of poss current action anyway 🙂
Did someone discover cure for all diseases or immortality drug that markets are so excited? Holy smoke blind leading the blind.
Olga – when I move around the crosshairs on IB the numbers don’t show up, either on the price bars or for the technicial indicators. Don’t remember changing anything…but do you know how to get them back on?
On chart:-
Edit -> Chart Parameters
In Additional Data & Features, tick check box ‘Bar Details Zone’
Thanks for the help, getting there on learning the IB system. It really is great.
TD Waterhouse web broker has been down all morning. This is the second time in a week this has happened. Time to switch…frustrating
Very bad. You don’t want to be locked out of your account in the coming days. I would put nothing past these crooked banksters….
I think we’ve all got that to look forward to in (not too distant) future.
UVXY CANNOT print a green candle today, I don’t care what the wave count calls for…if it does…
Interesting that SPX volume is about the same as yesterday at this exact time… just very slightly ahead.
This move is ALL bankster driven. I noticed that market declines have not been telegraphed by futures lately and that means there are few aggressive sellers. The impulsive declines we have seen have been literally the market falling under the weight of its own bloat. It all makes perfect sense. Once the selling starts in earnest, it ought to be quite interesting.
UVXY certainly not overly impressed by this rally atm.
Main count now confirmed (short term) by price with the move above 2072. Only needs to reach 2085 to avoid a truncation.
You noticed too huh? As I mentioned, if it closes in the green today run like hell! 🙂
Two slightly lower lows so far today…
I am betting we get that today…
4th wave of this C wave up should be sharp (and poss deep), if it exhibits alternation.
Atm price has stalled at the upper base channel (of move up from 2026). A 3rd wave should blast through it.
I did not realize the number to avoid truncation was so close. I think it bolsters the view that this thing is going to end today.
Long lower wick on UVXY at 12.58. Looking for a spike below then reversal back above to possibly signal end of minuette three…
Just sold the rest of my calls for 1.60…
Hey BULLS…. All Aboard!
Take bullish sentiment from extreme to more extreme!
Yeah baby! I want me some berry berry cheap Unicorns! 😀
Probably just finishing sub-min one of minuette three. Content to let the rest of the calls ride with house money. The strongest part of the move really should still be just ahead…
I did a little dance with the devil and picked up some SPY 206 calls at the open for 0.87.
I am now trying to unload half of em for 1.50 and get me some Unicorns!
Hopefully Olga will give us a road map for this spring higher….
New Housing Sales are Excellent!
They are out selling that as great news for the economy. I think that is a one time blip enhanced by seasonal adjustments.
Does the FED believe that specific Data???
This Wave up may conclude today before reality sets in for the bulls! (III), 2, C circle per the Bear Main Hourly count!
You know what? Nothing would surprise me about this treacherous market. I know the wave count calls for a move much higher but as I indicated, the impulses have been completing intra-day with sneaky reversals to take away gains from anyone complacently sitting on them. I just unloaded 80% of my calls for that exact reason, although we really should continue higher toward 2099 per the main wave count. I do not trust this market!!
Ran smack into a Gann line 75% (2065.31). Let’s see how much resistance that provides.
If minuette 3 = minuette 1*1.618 and minuette 2 is over at yesterday’s close, then the target for minuette 3 is ~2099 roughly 50 points up. However, since this is the end of Minor 2 within intermediate 3 down of primary 3 down, one might expect this upwards correction to be stunted somewhat.
Lara’s target for completion of Minor 2 is 2099. I do not think we will complete minor 2 today or tomorrow. It may take to the end of the week or even Tuesday of next week. Thus it would print a green candle on the weekly and monthly charts.
Based on the current market conditions and expectations, I have decided to go to the mountains all next week. I am going to find that sleeping bear, wake him up, and pester him until he becomes extremely angry and aggressive. Then he will chase me all the way back to town and I will drop him off at the intersection of Wall Street and Main Street.
correction in 1st paragraph should read:
since this is the end of Minor 2 within intermediate 1 (not 3) down of primary 3 down,
UVXY is about to make its 6th new 52 week low in the last thirty days. I have never ever seen it do this, ever! Not even when we completed primary two up. This is the kind of complacency I would have expected at the top of intermediate two of primary three. I think it will crack 11 today but remain above 10. ‘Nuff said.
Just my luck to begin using the VIX derivatives and you see something never before seen. Oh well.
Rodney… that is a crazy vehicle.
2 or 3 X Short ETS’s make sense on SPX or DOW. Yes there is erosion of price also but for a 1 to 6 mo trade is acceptable in my view. Longer than that is the mistake as I have learned, especially on 3 X’s. No more than 3 mo on 3 X’s is probably best.
Well, I’m in at a couple of months right now. I still think I will exit at a profitable position but we have seen this elusive 3rd down evaporate several times over the past 8 or 9 months. What really hurt me is when we changed to the current bear count with Primary 2 morphing into a flat. That threw off the schedule. Then the MMs pushed UVXY and TVIX to extreme lows as noted by Vern.
Agreed… that messed me up as well. Had I exited 100% right after the decline in August & traded the moves up & down I would have made a huge sum by now. Never again… That’s why this P3 target of 1423 is key to the way I am now positioned.
I am with you. I am also originally from Chicago and was a season pass holder (18 seats) for their NFL team. I was there when they won the Superbowl in ’85. Go BEARS!
So you must be a big Ryan fan.
I am from NY & now live in NJ… a NY Jets season ticket holder until the year they fired Rex Ryan. Now a NY Jets fan and still a Rex Ryan fan rooting for Buffalo as well. Jets vs Bills games now very interesting for me.
Actually Rodney, if you are patient, I think you will discover that you choose the very best time to trade them. UVXY is a derivative for VIX futures, and therefore what these series of new 52 week lows is telling us is that we are in period of historic optimism about the market’s direction in the intermediate future. This historic optimism will necessarily be followed by historic pessimism, just as night follows day, nothing new under the sun…
Looking very much like we will get our third wave of minute C up today. I would not be at all surprised to see minor two complete tomorrow. The market has been completing impulses intra-day, reversing quickly and ambushing traders who do not take profits immediately and I think this will continue.
Bloomberg posted chart this morning showing trendlines in the manufacturing and service sectors going back to 2014.
I believe we are in a recession.
If you scalp this upside move, it might not be a bad idea to cash in by the close.
We may well be looking at the last rally in this market for many weeks to come.
I for one want to have all my short term powder dry by tomorrow’s close.
Happy Hunting! 🙂
We had a down up sequence of waves in the overnight ES! With the up part as 5 waves on a 10 min chart by my count.
Then now looks to be starting a down wave???. Not sure if what I see meets all the EW rules. OR now may be wave 4 with 5 to come if I extend 3 a bit more.
With more time… wave 4 is in progress ES 10min chart.
SO here is what I think… AT the open (1ST 2 to 5 MIN) if it occurred right now… SPX would be up ~11.500 to 2059.54 that would be an in progress wave III, 2, C circle per the main count.
Look for the conclusion of that wave at any point today. Then we hope P3 finally.
Correction… an in progress wave (III), 2, C circle per the main count.
Now in the next 15 min. ES could sell off by the early open and the alt count may still be alive. But as of right now ES 4 still in progress.
to open ~ up 11.54 in 1st 2 to 5 min.
EDIT: Right on Target by 9:32AM
So confidence in the main Bear EW Count an in progress wave (III), 2, C circle
ES wave 5 now in progress.
EDIT 9:40AM:
SPX… Now looking for end of in progress wave (III), 2, C circle per the Bear Main Hourly count!
Can end at any point NOW between here (2064.11)and 2099!
Not sure how that relates to SPX action today Joseph. I think it is pretty clear that we will be in an impulse up today and Lara’s target of around 2099 is probably right if we are going to avoid a C wave truncation.
I never cease to be amazed at her adroitness in modifying the wave count when needed to keep us on the right side of the market.
The overnight ES waves at least today predicted exactly where SPX would open in price for the 1st 2 to 5 min of SPX trading. It showed that ES wave 5 (my overnight ES S-T count) was in progress and it eliminated the alt before the market opened. That signaled (III) 2, C circle of Bear Main hourly was in progress.
Now look for END of (III) 2, C circle of Bear Main hour.
where is everyone?
“All by myself, don’t wanna be, all by my-self…anymore….” 🙂
https://www.youtube.com/watch?v=o22i_gqAf_o
Great song. Great voice. But nobody does it better than the Bee Gee’s.
Hey Rod; are you and me the only ones on the forum with exquisite musical tastes?! 🙂
Perhaps. Most are likely too young and have missed the greatest music making period in modern history, 1960’s – 1970’s.
No… I am in that camp! Sill listen to all that great music when I am driving.
first