
FTSE breached the channel confirming a trend change. Thereafter, it continued lower as expected.
Summary: FTSE may be beginning on a third wave down. The wisest approach to this market may be to wait for confirmation with a new low below 6,054.74 and a breach of the small pink channel on the daily chart. Prior to confirmation, risk remains at 6,427.32. The short term target is at 5,255. The long term target remains the same at 3,796.
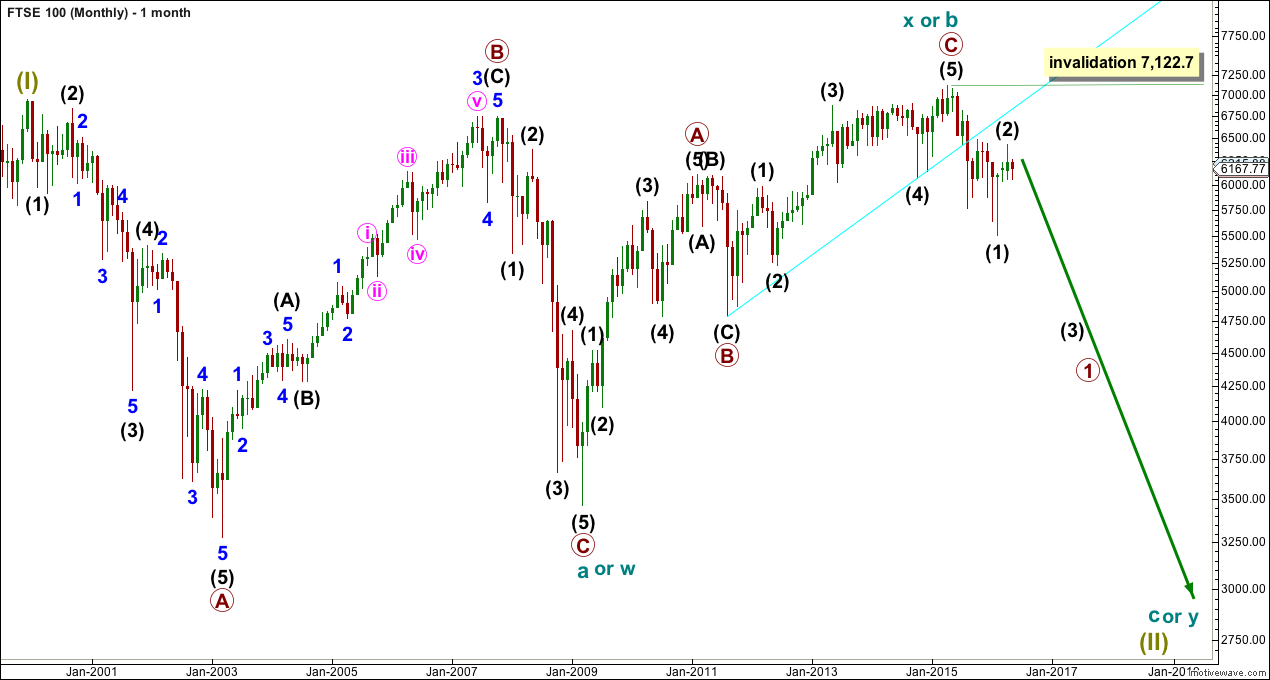
MONTHLY ELLIOTT WAVE COUNT
Click chart to enlarge.
At the monthly chart level, FTSE is the clearest bear market.
The cyan trend line is drawn across the two major swing lows in the bull market which began on March 2009. This bull market trend line has been breached by a close well over 3% of market value, indicating a trend change from bull to bear.
The 200 day moving average is now declining (shown on the technical analysis daily chart at the end of analysis). Price has made a series of lower lows and lower highs. FTSE is in a bear market until proven otherwise.
From an Elliott Wave perspective, the downwards movement labelled intermediate wave (1) to the low in February 2016 has well overlapped back into the high labelled primary wave A of February 2011. This downwards movement may not be a fourth wave correction within an impulse unfolding upwards. So the prior wave up labelled cycle wave X or b must be over and it must be a three wave structure.
The cyan bull market trend line has provided resistance.
Super Cycle wave (II) is seen as either a large flat correction, a double flat or a double combination.
If Super Cycle wave (II) is a large flat, then within it cycle wave a was a regular flat and cycle wave b was a zigzag and 1.05 the length of cycle wave a. The length of cycle wave b indicates the most common type of flat, an expanded flat, may be unfolding. Cycle wave c downwards must subdivide as a five wave structure. Cycle wave c would be expected to end substantially below the end of cycle wave a at 3,460. At 1,477 cycle wave c would reach 1.618 the length of cycle wave a.
If Super Cycle wave (II) is a double flat, then the first flat in the double was a regular flat labelled cycle wave w. The double is joined by a three in the opposite direction, a zigzag labelled cycle wave x. Now a second flat correction should unfold sideways for cycle wave y. Cycle wave y would look similar to cycle wave w, with two large market crashes within it. It should end about the same level as cycle wave w at 3,460, so that the whole movement is a sideways structure.
If Super Cycle wave (II) is a double combination, then the second structure in the double for cycle wave y may be either a zigzag or a triangle. Either of these should reach down only to about the same level as cycle wave w at 3,460, so that the whole structure has a sideways look to it.
Of all these three options the simple expanded flat labelled cycle waves a-b-c is the most likely because expanded flats are very common structures.
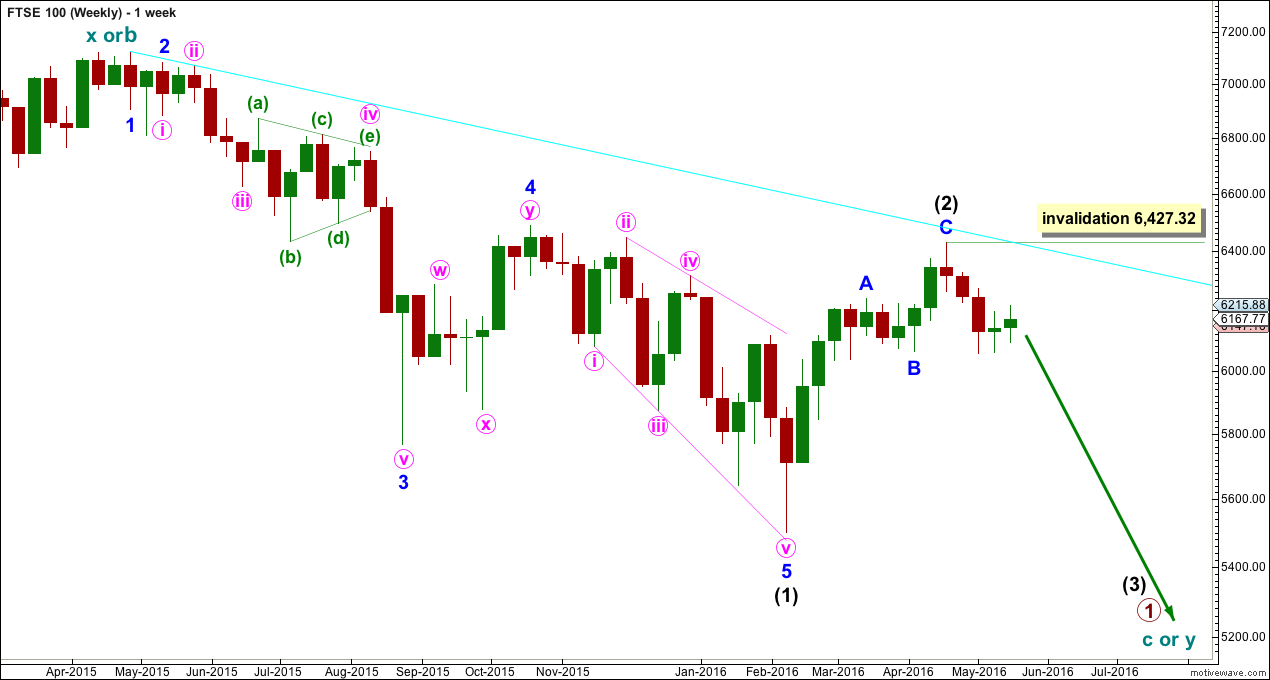
WEEKLY ELLIOTT WAVE COUNT
Click chart to enlarge.
Intermediate wave (1) subdivides as an impulse. Intermediate wave (2) is a complete zigzag.
Within intermediate wave (3), no second wave correction may move beyond its start above 6,427.32.
The cyan bear market trend line has been tested and so far is holding. The strength of this trend line is reinforced. Any more deep bounces on the way down may be expected to find strong resistance at that trend line, which should not be expected to be breached.
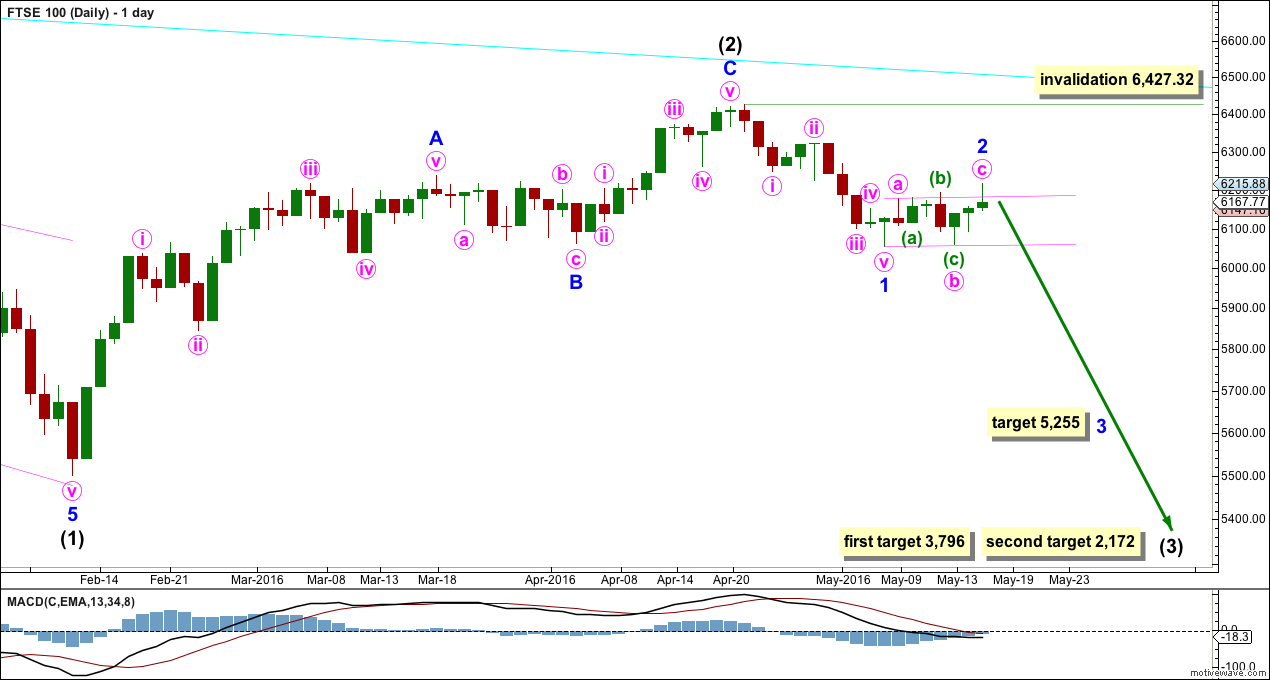
DAILY ELLIOTT WAVE COUNT
Click chart to enlarge.
Minor wave 1 fits perfectly as a five wave impulse. Minor wave 2 may now be a complete regular flat correction.
Minor wave 1 lasted 11 days. Minor wave 2 may be over in 7 days, 0.618 the duration of minor wave 1. Minor wave 2 is shallow at only 0.44 the depth of minor wave 1. Because the proportions look right, it is fairly likely that minor wave 2 is over here. Although second wave corrections are more commonly deep, they don’t have to be.
If minor wave 2 continues further, it may not move beyond the start of minor wave 1 above 6,427.32.
Minor wave 3 must make a new low below the end of minor wave 1 at 6,054.74. When this price point is passed and when price breaks below the small pink channel containing minor wave 2, that shall provide confirmation that minor wave 2 is over. At that stage, the invalidation point may be moved down to the end of minor wave 2, but for now it must remain at 6,427.32.
At 5,255 minor wave 3 would reach 2.618 the length of minor wave 1.
The first target for intermediate wave (3) is at 3,796 where it would reach 1.618 the length of intermediate wave (1). If price gets to the first target and the structure is incomplete, or if price keeps falling through the first target, then the second target would be used. At 2,172 intermediate wave (3) would reach 2.618 the length of intermediate wave (1).
Intermediate wave (3) must make a new low below the end of intermediate wave (1) at 5,499.51.
TECHNICAL ANALYSIS
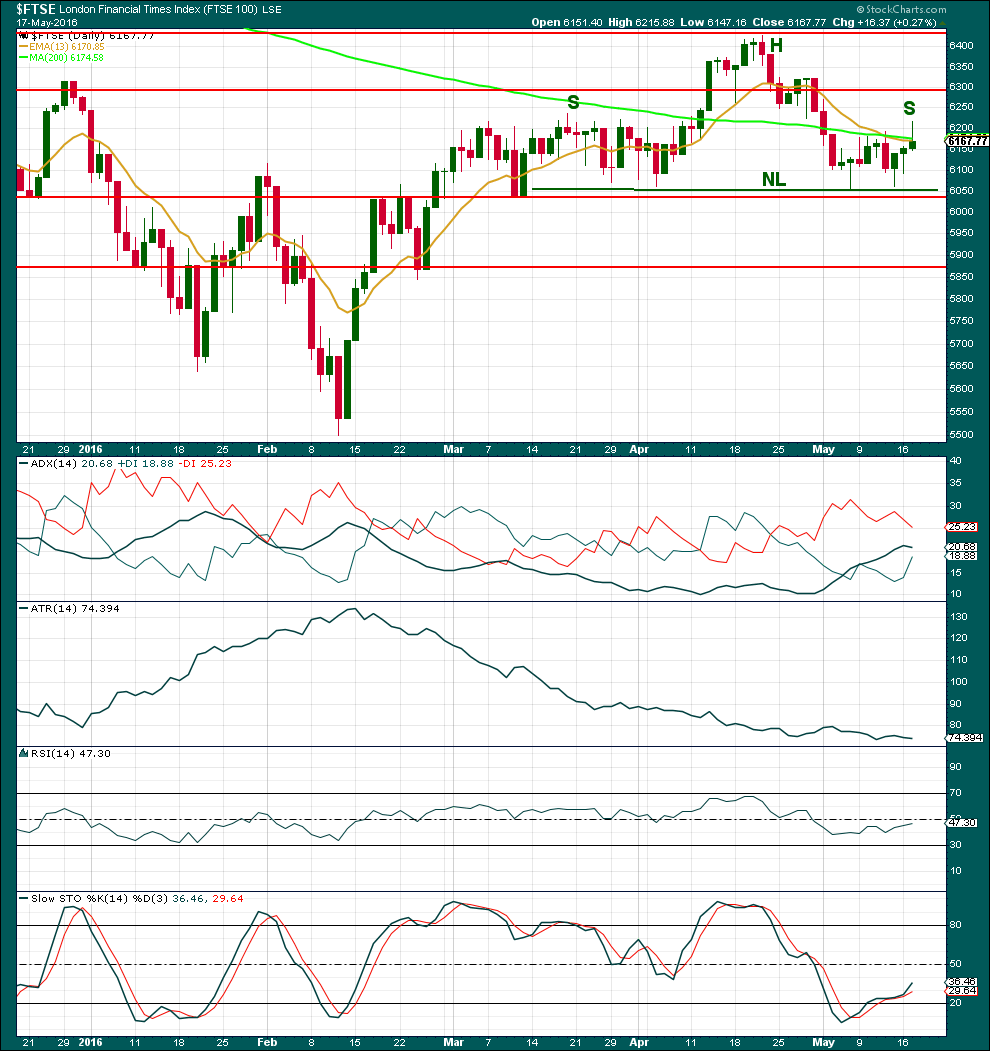
Click chart to enlarge. Chart courtesy of StockCharts.com.
Neither Google / Yahoo data feed nor StockCharts provide volume data for FTSE. Comments on volume are taken from Yahoo Finance data.
It looks like a head and shoulders pattern may be completing for FTSE. If price breaks below the dark green neckline, that shall confirm the pattern. The target for downwards movement, if that happens, would be at about 5,680.
Price has been range bound essentially since 26th February. The upper edge is about 6,430 and the lower edge is about 6,040. If price breaks below support at 6,040, then it should be expected to accelerate downwards. The next line of support is about 5,870.
Volume for downwards days during this consolidation is stronger than upwards days. Volume indicates a downwards breakout.
In the short term, for the last three upwards days the first two days came on declining volume but the last day comes with increased volume. This indicates possibly more upwards movement at least short term. The rise in price for the session of 17th May was supported by volume.
The candlestick for 17th of May is however bearish. The long upper shadow indicates that bulls pushed price higher during the session but they were unable to keep price close to the highs. The bears dominated the remainder of the session to push price back down close to the open. Because this spinning top candlestick pattern does not come at the end of a clear upwards movement from price, it should not be read as a reversal pattern; but, the upper shadow does still have a bearish implication.
Price is finding resistance currently about the 200 day moving average and the 13 day moving average. The shorter average is just crossing below the longer average. This may indicate a return of a downwards trend.
Up until today ADX was indicating a downwards trend is in place as the ADX line was increasing. It is slightly decreasing today. If it again turns up, then a downwards trend would be indicated.
ATR remains flat. ATR should be expected to again increase once price breaks out of the consolidation zone.
RSI is neutral. There is plenty of room for price to rise or fall. There is no divergence currently between price and RSI.
Stochastics has returned from oversold.
This analysis is published @ 03:48 a.m. EST on 18th May, 2016.
Today the FTSE closed at 6219, and traded as high as 6230 during RTH.
Can you please provide an updated count as I’m afraid none of the above is making much sense to me anymore… a new low below 6054.74 has been made, and so I suspect now seeing the index almost 200 points higher (and looking like it wants higher still) wasn’t anticipated as part of this count.
Thanks
Could be a mistype in “… At that stage, the invalidation point may be moved down to the end of minor wave 1, but for now it must remain at 6,427.32.” — moved down to the end of minor wave 2 (at 6217)?
Oops, sorry!
I’ve fixed it. It should read “at that stage the invalidation point may be moved down to the end of minor wave 2” not “minor wave 1”.
Thank you VK for pointing that out.
Is there a ETF (short) that we can play in the US?
I don’t know. I’m in New Zealand.
I’m trading this via CFD’s using a NZ broker.
Any members here trading FTSE with a US broker? What do you use?
also CFD’s.