
Downwards movement was expected from the main Elliott wave count yesterday and this is exactly what happened.
Summary: The main wave count expects to see downwards movement accelerate in the next week or so as a third wave unfolds. The first short term target is at 1,988. The long term target remains at 1,423. An alternate survives, so risk to short positions must remain mid term at 2,111.05.
To see last published monthly charts click here.
To see how each of the bull and bear wave counts fit within a larger time frame see the Grand Supercycle Analysis.
To see detail of the bull market from 2009 to the all time high on weekly charts, click here.
New updates to this analysis are in bold.
BEAR ELLIOTT WAVE COUNT
WEEKLY CHART
Click chart to enlarge.
This bear wave count fits better than the bull with the even larger picture, super cycle analysis found here. It is also well supported by regular technical analysis at the monthly chart level.
Importantly, there is no lower invalidation point for this wave count. That means there is no lower limit to this bear market.
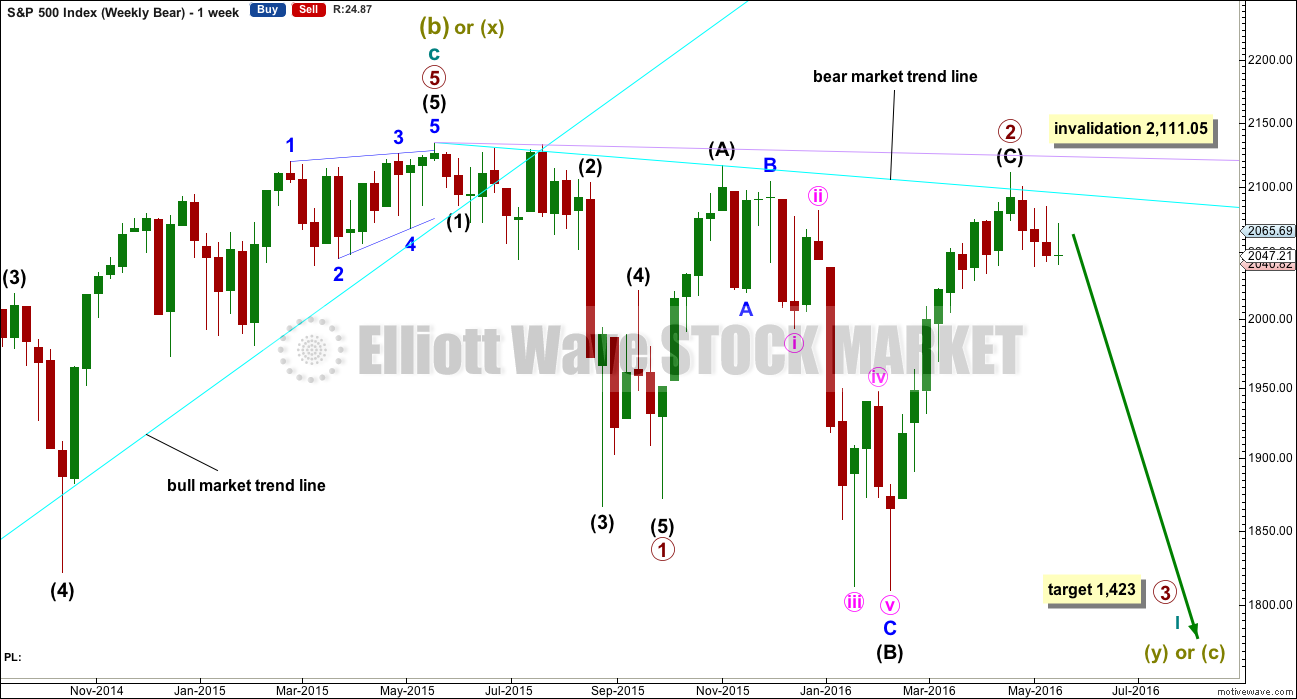
Primary wave 1 is complete and lasted 19 weeks. Primary wave 2 is over lasting 28 weeks.
An expectation for duration of primary wave 3 would be for it to be longer in duration than primary wave 1. If it lasts about 31 weeks, it would be 1.618 the duration of primary wave 1. It may last about a Fibonacci 34 weeks in total, depending on how time consuming the corrections within it are.
Primary wave 2 may be a rare running flat. Just prior to a strong primary degree third wave is the kind of situation in which a running flat may appear. Intermediate wave (B) fits perfectly as a zigzag and is a 1.21 length of intermediate wave (A). This is within the normal range for a B wave of a flat of 1 to 1.38.
Within primary wave 3, no second wave correction may move beyond its start above 2,111.05.
DAILY CHART
Click chart to enlarge.
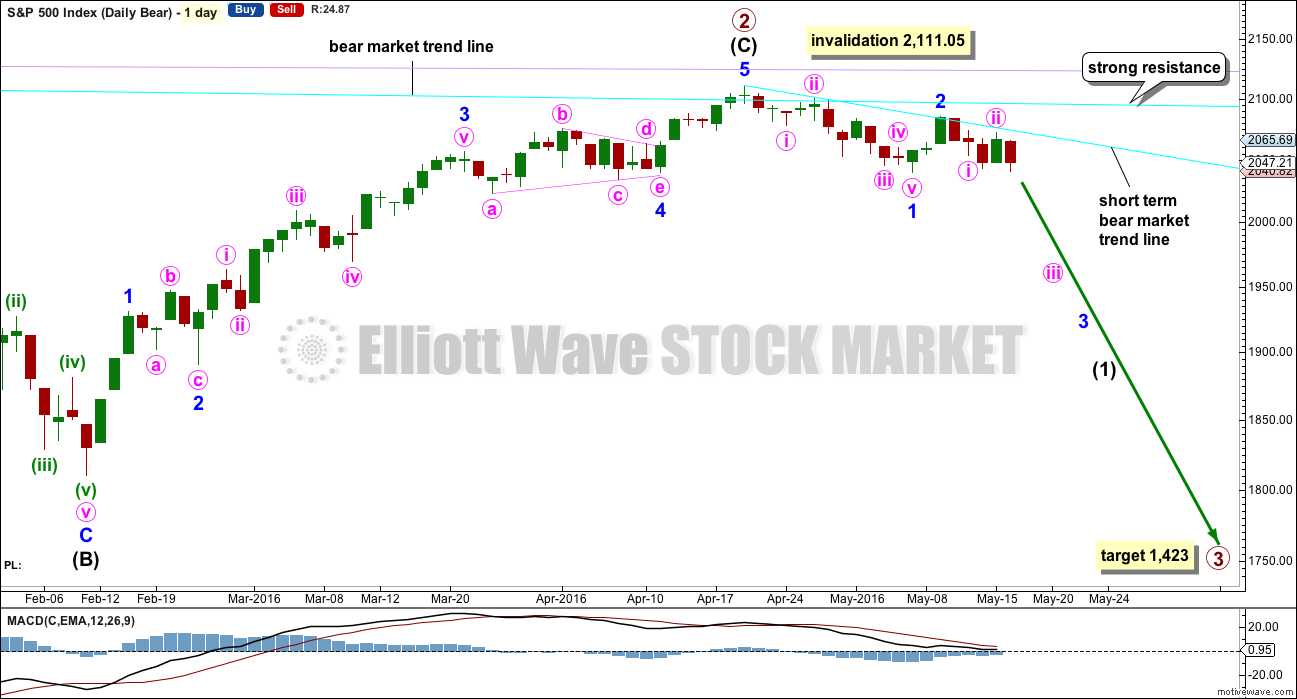
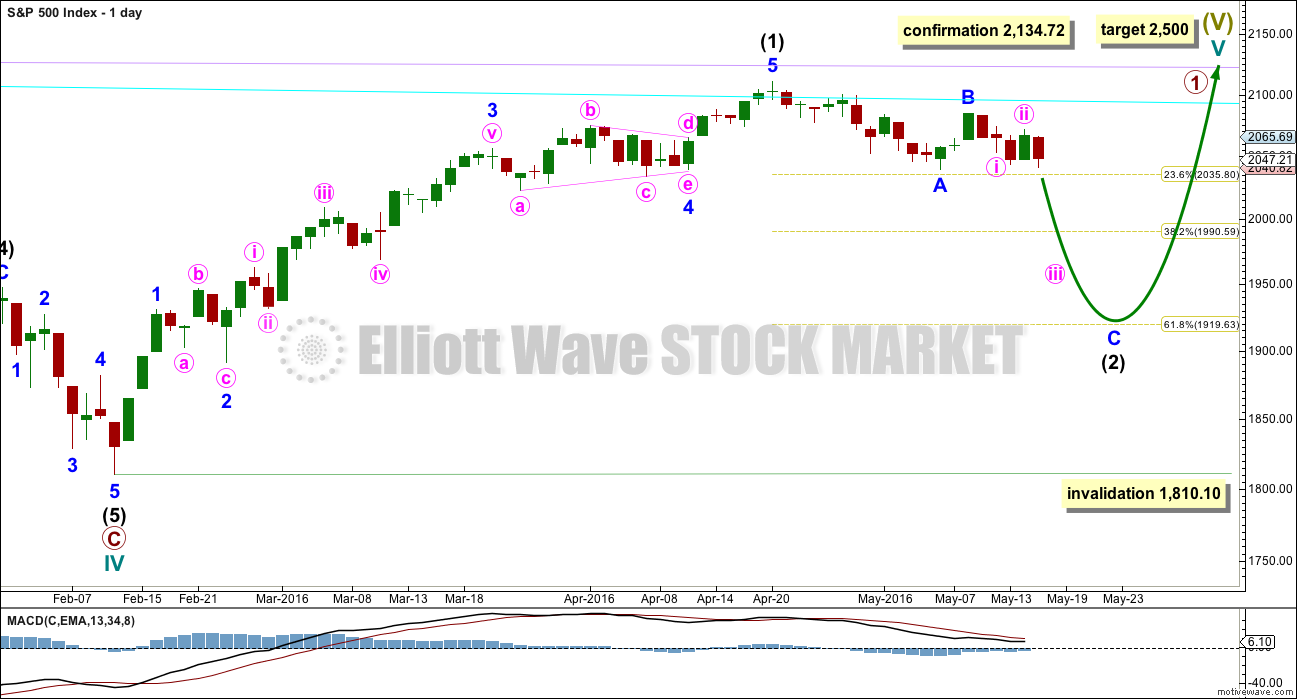
If intermediate wave (C) is over, then the truncation is small at only 5.43 points. This may occur right before a very strong third wave pulls the end of intermediate wave (C) downwards. At the end of last week, price has confirmed a trend change with a new low slightly below 2,039.74.
The next wave down for this wave count would be a strong third wave at primary wave degree. At 1,423 primary wave 3 would reach 2.618 the length of primary wave 1. This is the appropriate ratio for this target because primary wave 2 is very deep at 0.91 of primary wave 1. If this target is wrong, it may be too high. The next Fibonacci ratio in the sequence would be 4.236 which calculates to a target at 998. That looks too low, unless the degree of labelling is moved up one and this may be a third wave down at cycle degree just beginning. I know that possibility right now may seem absurd, but it is possible.
Alternatively, primary wave 3 may not exhibit a Fibonacci ratio to primary wave 1. When intermediate waves (1) through to (4) within the impulse of primary wave 3 are complete, then the target may be calculated at a second wave degree. At that stage, it may change or widen to a small zone.
At this stage, it looks slightly more likely that minor wave 3 is underway considering On Balance Volume at the weekly chart level, resistance at the short term cyan trend line, and structure at the hourly chart level. For these three reasons hourly charts are swapped over today. The main hourly chart below has a slightly higher probability than the alternate in my judgement today.
The equivalent minor wave 2 within the last big bear market was a 0.495 depth of minor wave 1 and lasted two days to minor wave 1’s five days.
The next possible equivalent minor wave 2 lasted one day longer than its minor wave 1 and was very deep at 0.81.
Overall, it is impossible to tell with certainty how deep and long lasting this minor wave 2 will be. Look out for possible surprises to the downside with a big third wave in its infancy.
Minor wave 1 lasted 12 days, one short of a Fibonacci 13. Minor wave 2 could be over at 0.63 the depth of minor wave 1 and lasting only two days as labelled, or it may be continuing to be deeper and longer lasting as per the hourly alternate wave count below.
Minor wave 2 may not move beyond the start of minor wave 1 above 2,111.05.
A short term bear market trend line is added from the high of primary wave 2 to the first small swing high of minute wave ii in cyan. This trend line is about where price is finding resistance. It is copied over to the first alternate hourly chart and the daily technical analysis chart.
I will publish two hourly wave counts in order of probability.
MAIN HOURLY CHART
Click chart to enlarge.
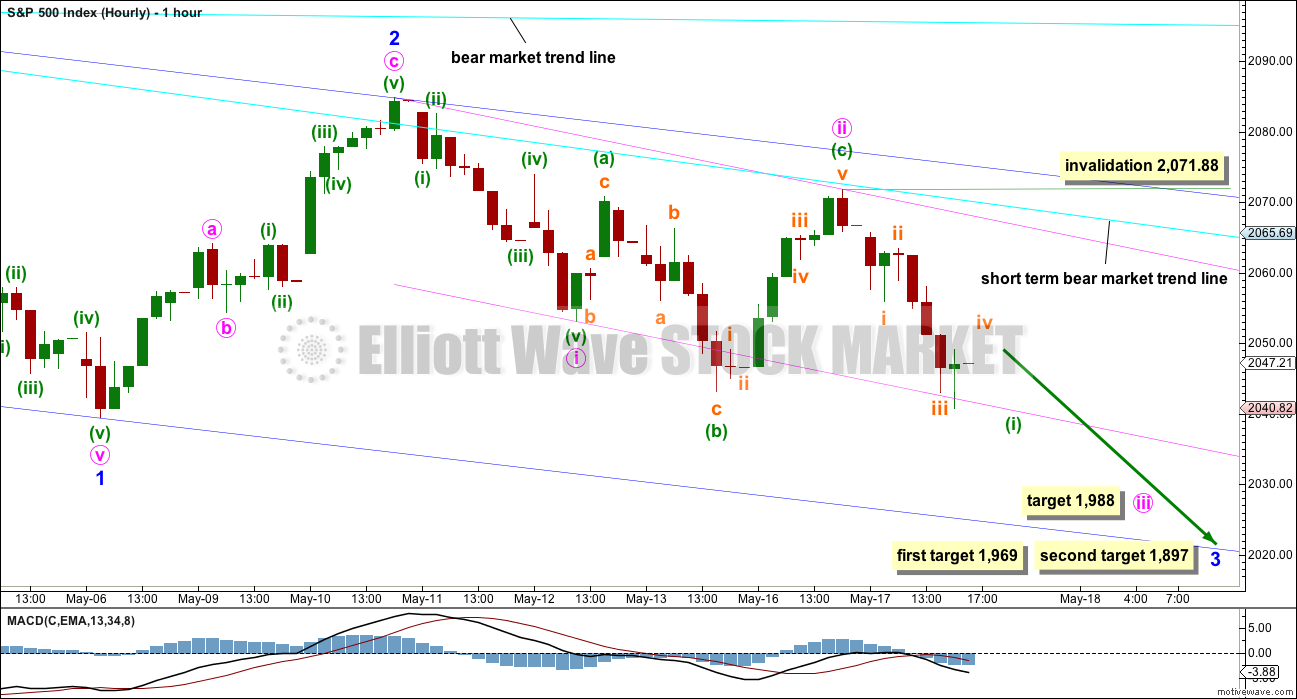
Minor wave 2 may be a complete zigzag, just a little deeper than 0.618 of minor wave 1.
Minor wave 3 may have begun and would reach 1.618 the length of minor wave 1 at 1,969. If price reaches the first target and the structure is incomplete, or if price keeps falling through the first target, then the next Fibonacci ratio in the sequence is 2.618 which gives a target calculation at 1,897.
Minor wave 3 may only subdivide as a simple impulse. Along the way down, lower degree corrections should find resistance at the upper edge of the dark blue base channel which is drawn about minor waves 1 and 2. Minor wave 3 should have the power to break through support at the lower edge of the base channel. Once that is done, the lower edge should then provide resistance.
Within minor wave 3, minute waves i and now ii are also complete.
Minute wave ii fits perfectly as an expanded flat correction (these are very common structures). It is a 0.59 depth of minute wave i. It has found resistance perfectly as the short term bear market trend line, copied over from the daily chart.
Minute wave ii is an expanded flat. Minuette wave (b) is a 1.57 length of minuette wave (a). This is a little longer than the common range of 1 to 1.38 but within the allowable convention of up to 2. Minuette wave (c) is just 0.19 points longer than 1.618 the length of minuette wave (a). All subdivisions fit perfectly, particularly minuette wave (b) as a zigzag.
At 1,988 minute wave iii would reach 2.618 the length of minute wave i. If this target is wrong, it may be too high.
Within minute wave iii, now the first impulse for minuette wave (i) is very close to completion. In the very short term, subminuette wave iv may not move into subminuette wave i price territory above 2,055.65. As soon as subminuette wave v makes a new low below the end of subminuette wave iii, it could be over. It may end at support from the lower pink trend line. A bounce tomorrow for minuette wave (ii) may be initiated from there.
Add another base channel this time about minute waves i and ii (drawn in pink). The upper edge of this pink channel should now provide resistance for corrections along the way down. If price breaches the upper pink line, then look for it to again find resistance at the short term bear market trend line.
The power of the middle of a third wave should be able to break below support at the lower edge of the pink channel. When price breaks below the lower pink trend line, then that line should provide resistance. If that is how price behaves, if it throws back up to the line, it would offer a good low risk entry opportunity to join the trend.
If price breaks below support of the lower dark blue line, then the alternate would be discarded. A breach of the lower blue line would be enough confirmation of a third wave down to discard the idea of minor wave 2 continuing in any form.
ALTERNATE HOURLY CHART

Click chart to enlarge.
It is essential to always consider “what if?”. What if the main wave count is wrong? Alternates are an essential part of correctly doing Elliott wave analysis. If the main wave count is wrong, then an alternate should be available to provide a road map for what should happen next.
It is still possible that minor wave 2 is an incomplete flat correction. So far minute wave b is 0.97 the depth of minute wave a, passing the minimum requirement of 0.9 but not yet long enough for an expanded flat at 1.05. If minute wave b reaches down to 2,037.18 or below, then minor wave 2 would be an expanded flat.
The common range for minute wave b within a flat is from 1 to 1.38 the length of minute wave a, giving a range of 2,039.45 to 2,022.19. There is no Elliott wave rule stating a maximum length for minute wave b, but there is an Elliott wave convention which states that when the potential B wave is twice the length of the potential A wave the idea of a flat should be discarded due to a very low probability. Here, that price point would be at 1,994.
Within the flat, minute wave a is a three, a zigzag. Minute wave b may also be a three, a zigzag, and very close to completion. A-B-C of a zigzag subdivides 5-3-5, exactly the same way as 1-2-3 of an impulse. The subdivisions of downwards movement for the last five days are seen in exactly the same way now for both wave counts. How each count subdivides cannot tell us at this stage which wave count has a higher probability, because there is no difference. This job is left to classic technical analysis.
The green channel here is a corrective channel about the zigzag of minute wave b. It is drawn in exactly the same way as a base channel.
The first indication that this wave count may be right and the main wave count may be wrong would be a clear breach of the upper edge of the green channel. Thereafter, a new high above 2,071.88 would invalidate the main hourly wave count and confirm this alternate. If that happens, then expect upwards movement to continue until it touches the bear market trend line.
BULL ELLIOTT WAVE COUNT
WEEKLY CHART
Click chart to enlarge.
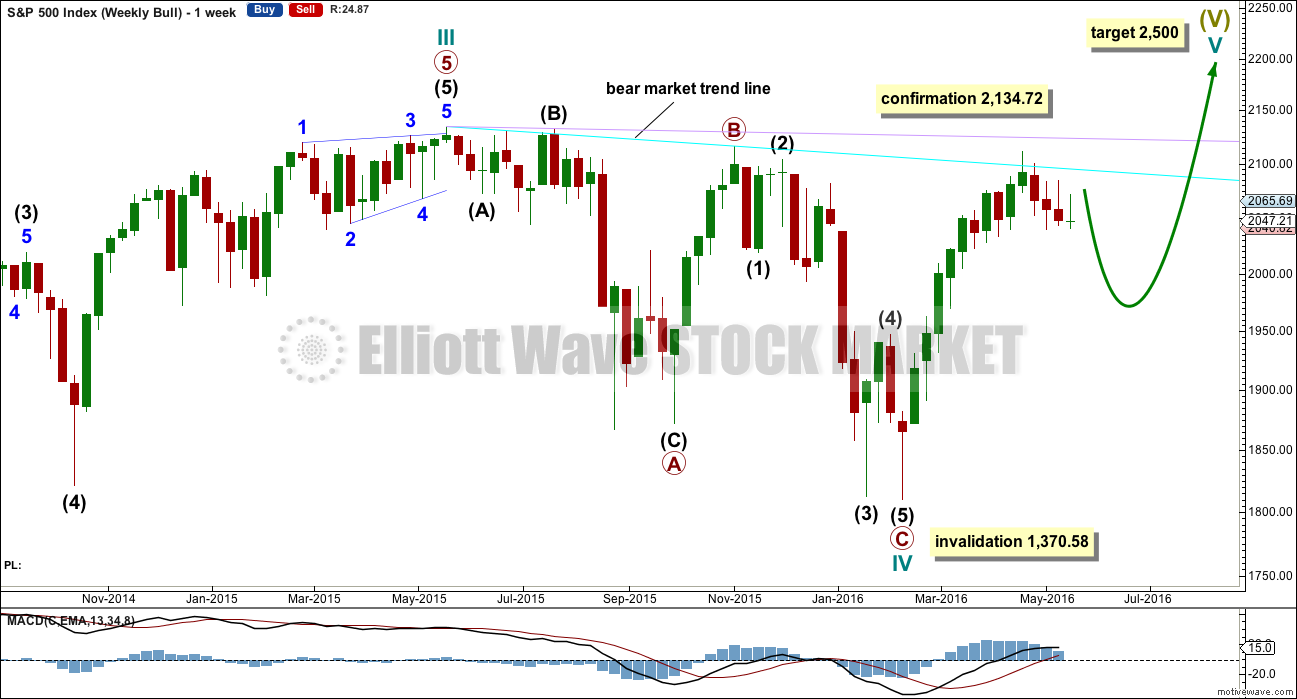
Cycle wave IV is seen as a complete flat correction. Within cycle wave IV, primary wave C is still seen as a five wave impulse.
Intermediate wave (3) has a strong three wave look to it on the weekly and daily charts. For the S&P, a large wave like this one at intermediate degree should look like an impulse at higher time frames. The three wave look substantially reduces the probability of this wave count. Subdivisions have been checked on the hourly chart, which will fit.
Cycle wave II was a shallow 0.41 zigzag lasting three months. Cycle wave IV may be a complete shallow 0.19 regular flat correction, exhibiting some alternation with cycle wave II.
At 2,500 cycle wave V would reach equality in length with cycle wave I.
Price remains below the final bear market trend line. This line is drawn from the all time high at 2,134.72 to the swing high labelled primary wave B at 2,116.48 on November 2015. This line is drawn using the approach outlined by Magee in the classic “Technical Analysis of Stock Trends”. To use it correctly we should assume that a bear market remains intact until this line is breached by a close of 3% or more of market value. In practice, that price point would be a new all time high which would invalidate any bear wave count.
This wave count requires price confirmation with a new all time high above 2,134.72.
While price has not made a new high, while it remains below the final bear market trend line and while technical indicators point to weakness in upwards movement, this very bullish wave count comes with a strong caveat. I still do not have confidence in it.
The invalidation point will remain on the weekly chart at 1,370.58. Cycle wave IV may not move into cycle wave I price territory.
This invalidation point allows for the possibility that cycle wave IV may not be complete and may continue sideways for another one to two years as a double flat or double combination. Because both double flats and double combinations are both sideways movements, a new low substantially below the end of primary wave C at 1,810.10 should see this wave count discarded on the basis of a very low probability long before price makes a new low below 1,370.58.
DAILY CHART
Click chart to enlarge.
If the bull market has resumed, it must begin with a five wave structure upwards at the daily and weekly chart level. That may today be complete. The possible trend change at intermediate degree still requires confirmation in the same way as the alternate hourly bear wave count outlines before any confidence may be had in it.
If intermediate wave (2) begins here, then a reasonable target for it to end would be the 0.618 Fibonacci ratio of intermediate wave (1) about 1,920. Intermediate wave (2) must subdivide as a corrective structure. It may not move beyond the start of intermediate wave (1) below 1,810.10.
In the long term, this wave count absolutely requires a new high above 2,134.72 for confirmation. This would be the only wave count in the unlikely event of a new all time high. All bear wave counts would be fully and finally invalidated.
TECHNICAL ANALYSIS
WEEKLY CHART
Click chart to enlarge. Chart courtesy of StockCharts.com.
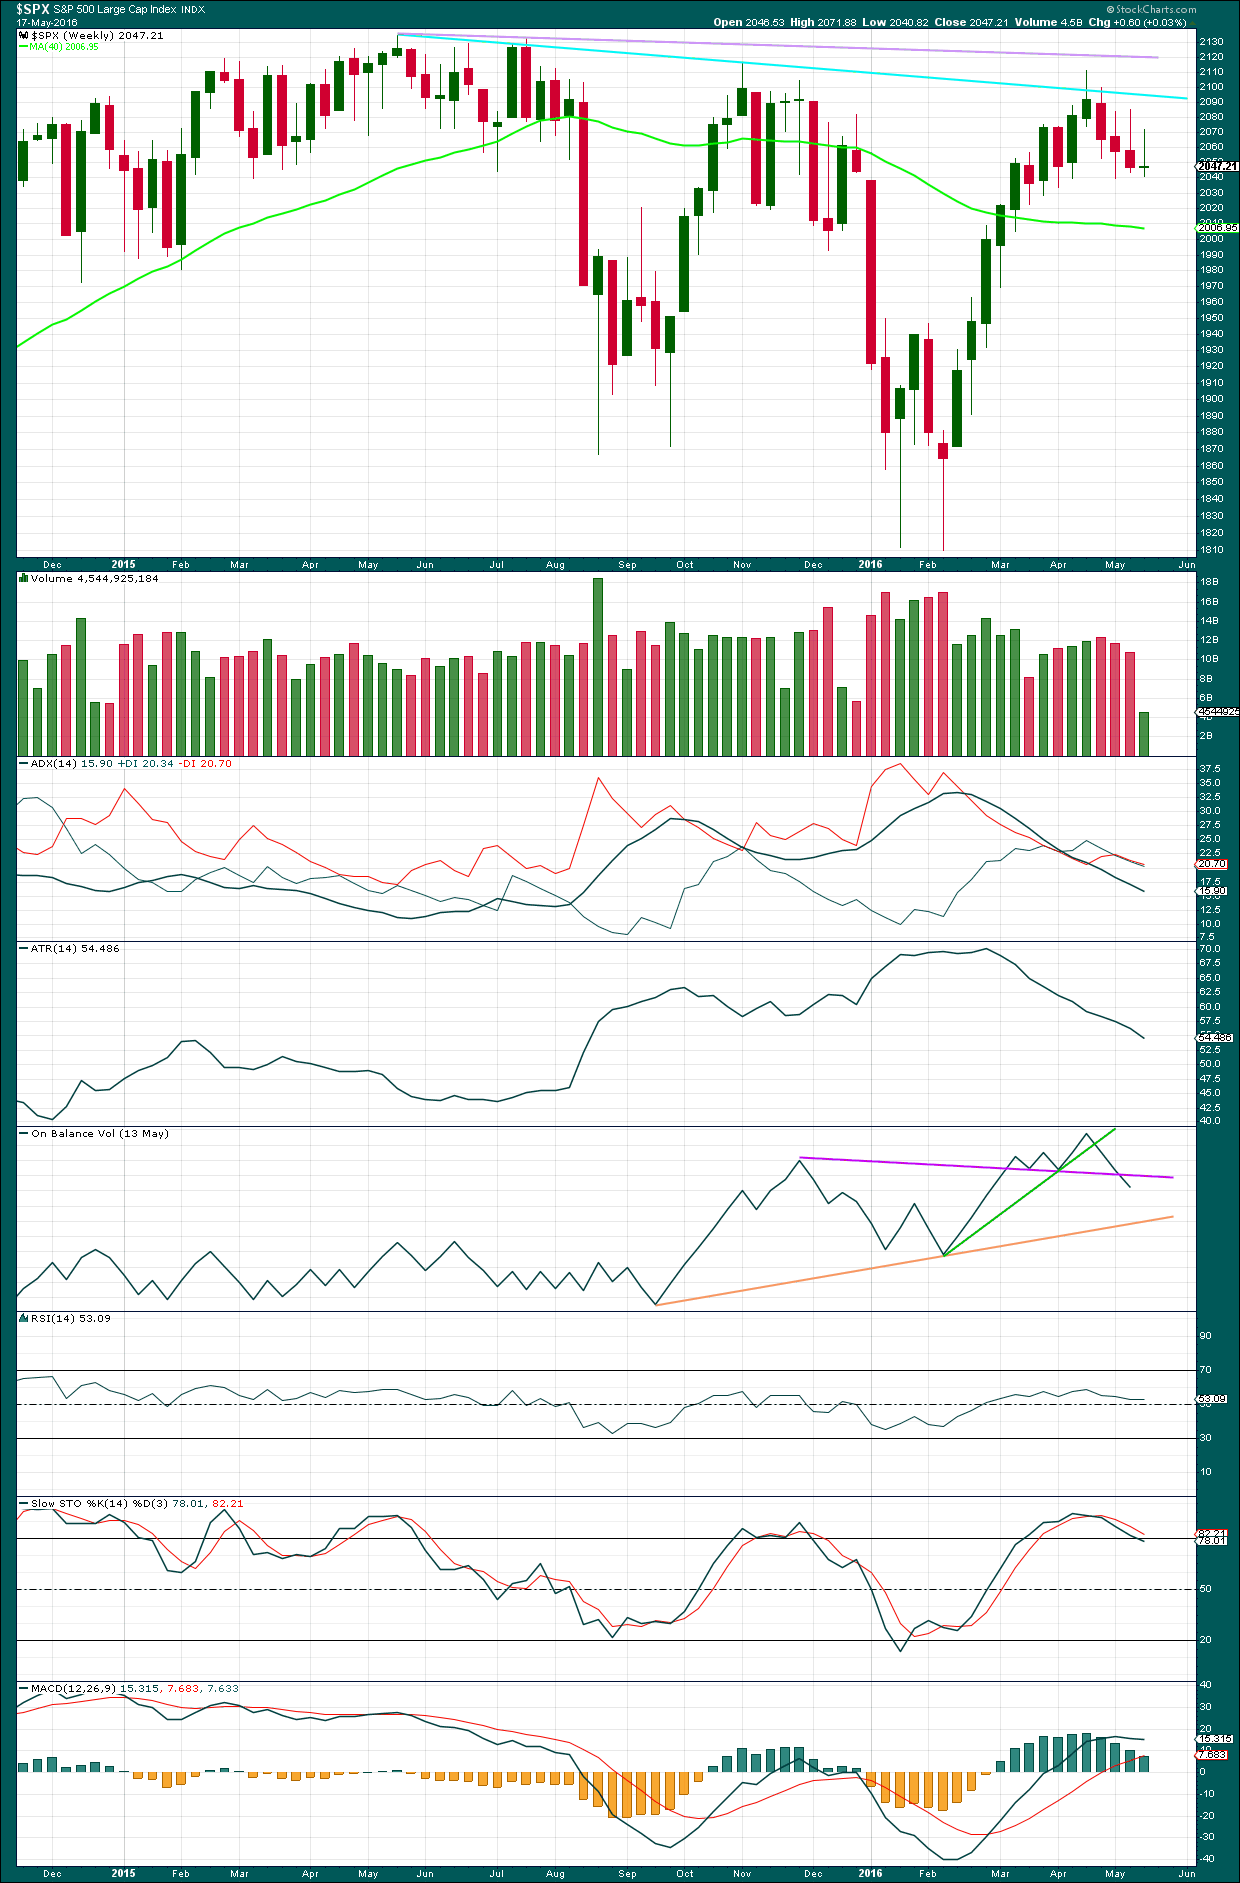
There is a bearish engulfing candlestick pattern at the last high. This has occurred at the round number of 2,100 which increases the significance. Volume on the second candlestick is higher than volume on the first candlestick, which further increases the significance. That it is at the weekly chart level is further significance.
Engulfing patterns are the strongest reversal patterns.
Now this pattern is followed by another red weekly candlestick. The reversal implications of the pattern are confirmed.
This is a very strong bearish signal. It adds significant weight to the expectation of a trend change. It does not tell us how low the following movement must go, only that it is likely to be at least of a few weeks duration.
Last week’s candlestick has a long upper shadow and is again red which is bearish.
There is another bearish signal from On Balance Volume this week with a break below the purple line. This does not indicate which hourly wave count is correct, but it does add weight to a downwards trend.
There is hidden bearish divergence between Stochastics and price at the last high and the high of November 2015. Stochastics has moved further into overbought territory, but this has failed to translate into a corresponding new high in price. Price is weak. MACD exhibits the same hidden bearish divergence.
After a period of declining ATR, it should be expected to turn and begin to increase.
DAILY CHART
Click chart to enlarge. Chart courtesy of StockCharts.com.
Volume data on StockCharts is different to that given from NYSE, the home of this index. Comments on volume will be based on NYSE volume data when it differs from StockCharts.
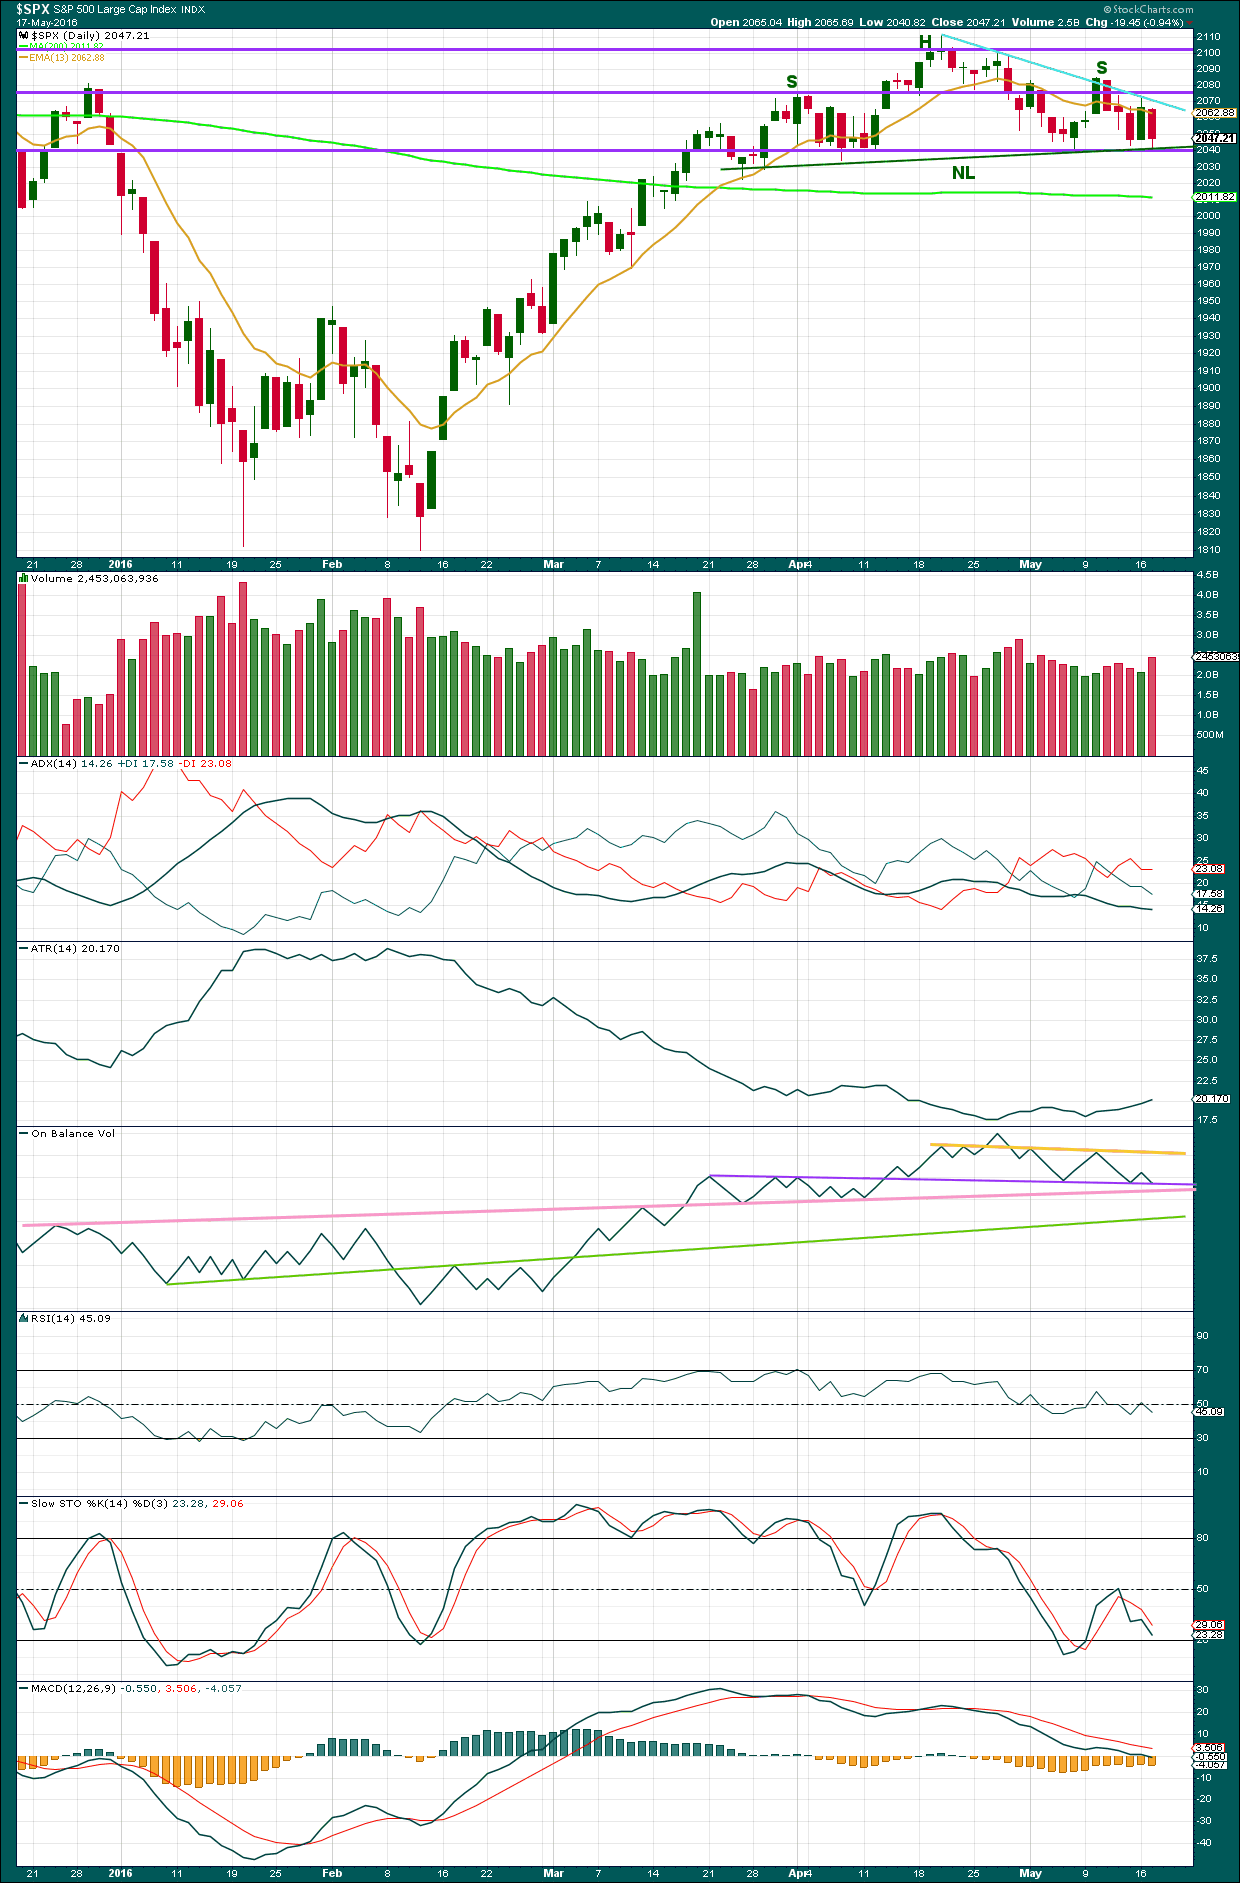
Downwards movement for Tuesday’s session comes with stronger volume. The fall in price was supported by volume. This supports the main hourly Elliott wave count over the alternate.
Price is finding resistance at the cyan trend line (this is the short term bear market trend line on the main daily Elliott wave chart) and support at the horizontal line about 2,040. Price is range bound between about 2,080 and 2,040. During this range bound movement, lasting now about 11 days, it is two downwards days which have stronger volume. This indicates that a downwards breakout is more likely than upwards.
A head and shoulders pattern may be completing as labelled (green). The neckline is providing support for today’s downwards movement. If the neckline is breached, then the pattern would be confirmed. The target would be about 1,964.
Overall, the volume profile continues to be bearish.
ADX is still declining and may be beginning to flatten off. This indicates the market is not currently trending. The -DX line remains above the +DX line, so no trend change is indicated. If a trend returns here, then it would be downwards.
ATR disagrees now as it is increasing. This indicates a trend may be returning. Some disagreement with these two trend indicators may be expected in the early stages of a new trend.
On Balance Volume has come down to again find support at the purple line. This line is repeatedly tested, essentially horizontal and reasonably long held. It has strong technical significance. A break below this line would be interpreted as a strong bearish signal.
A break below the pink and green lines by OBV would also be strong bearish signals.
The break and test of the yellow line was a weak bearish signal. This line should provide resistance if OBV turns upwards. This line should help to hold any rise in price here and stop it moving too far.
RSI is neutral. There is plenty of room for price to fall or rise.
Stochastics is close to neutral.
MACD is flattening off as would be expected during a counter trend movement.
VOLATILITY – INVERTED VIX DAILY CHART
Click chart to enlarge. Chart courtesy of StockCharts.com.
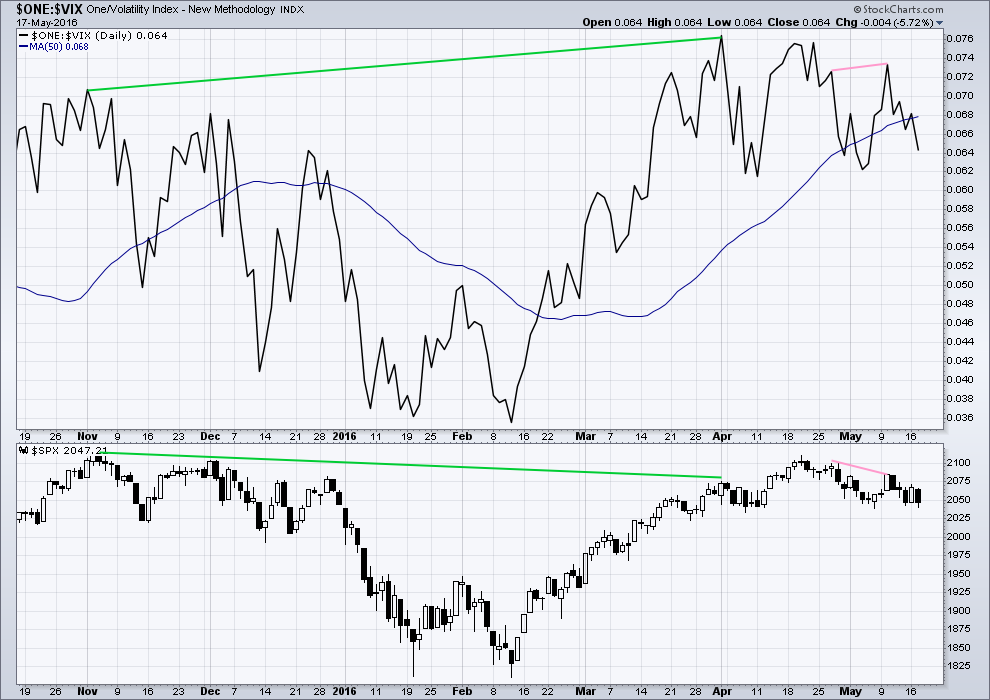
Volatility declines as inverted VIX climbs. This is normal for an upwards trend.
What is not normal here is the divergence over a reasonable time period between price and inverted VIX (green lines). The decline in volatility did not translate to a corresponding increase in price. Price is weak. This divergence is bearish.
Unfortunately, there is still no divergence between price and VIX for most recent movement to indicate which of the two hourly wave counts may be correct.
BREADTH – ADVANCE DECLINE LINE
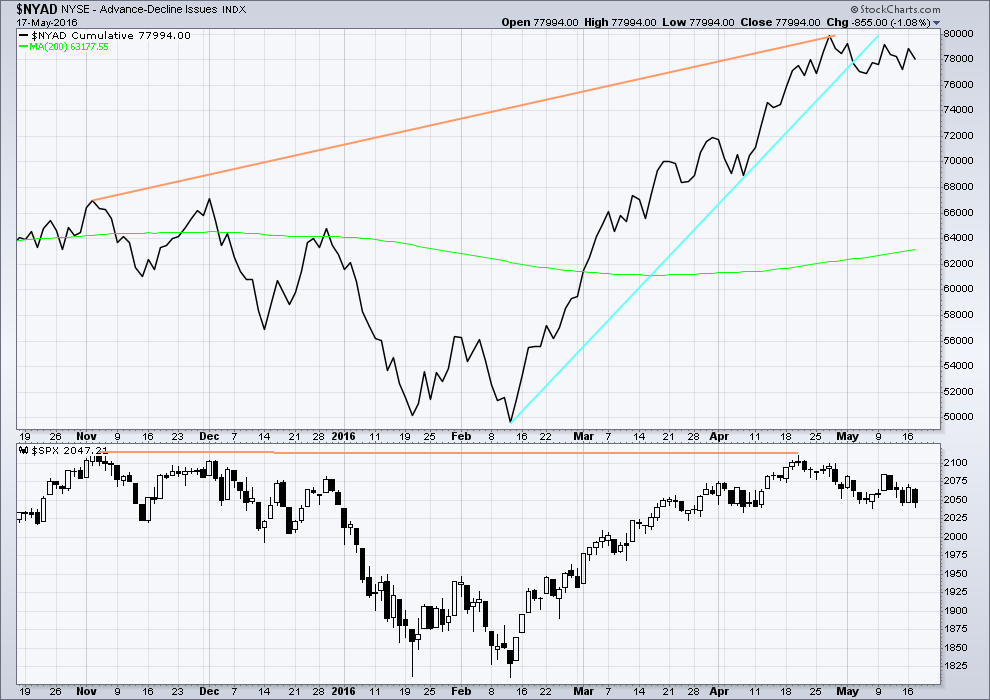
Click chart to enlarge. Chart courtesy of StockCharts.com.
With the AD line increasing, this indicates the number of advancing stocks exceeds the number of declining stocks. This indicates that there is breadth to prior upwards movement.
From November 2015 to 20th April, the AD line made new highs while price far failed to make a corresponding new high. This indicates weakness in price; the increase in market breadth is unable to be translated to increase in price (orange lines).
The 200 day moving average for the AD line is now increasing. This alone is not enough to indicate a new bull market. During November 2015 the 200 day MA for the AD line turned upwards and yet price still made subsequent new lows.
The AD line is now declining and has breached a support line (cyan). There is breadth to downwards movement; more stocks are declining than advancing which supports the fall in price.
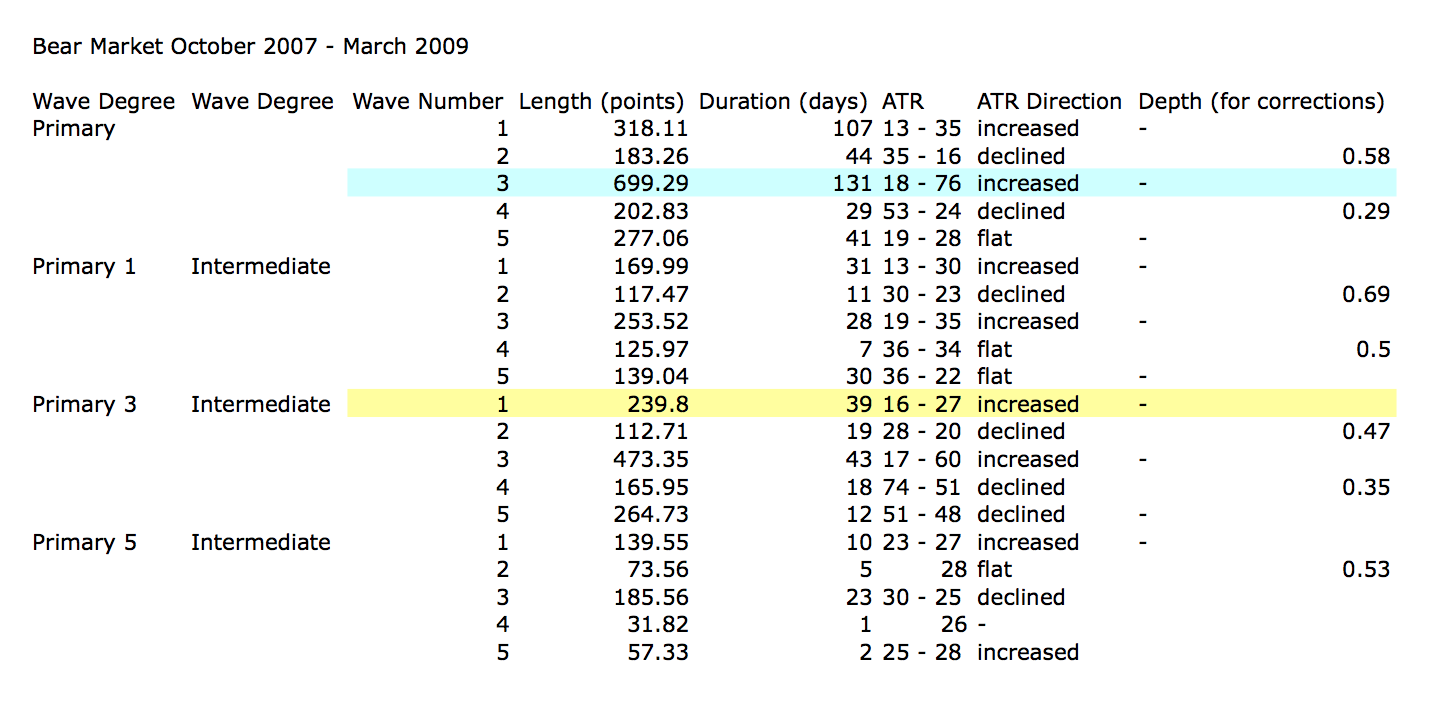
ANALYSIS OF LAST MAJOR BEAR MARKET OCTOBER 2007 – MARCH 2009
Click to enlarge.
In looking back to see how a primary degree third wave should behave in a bear market, the last example may be useful.
Currently, the start of primary wave 3 now may be underway for this current bear market. Currently, ATR sits about 19. With the last primary degree third wave (blue highlighted) having an ATR range of about 18 to 76, so far this one looks about right.
The current wave count sees price in an intermediate degree first wave within a primary degree third wave. The equivalent in the last bear market (yellow highlighted) lasted 39 days and had a range of ATR from 16 – 27.
Click chart to enlarge.
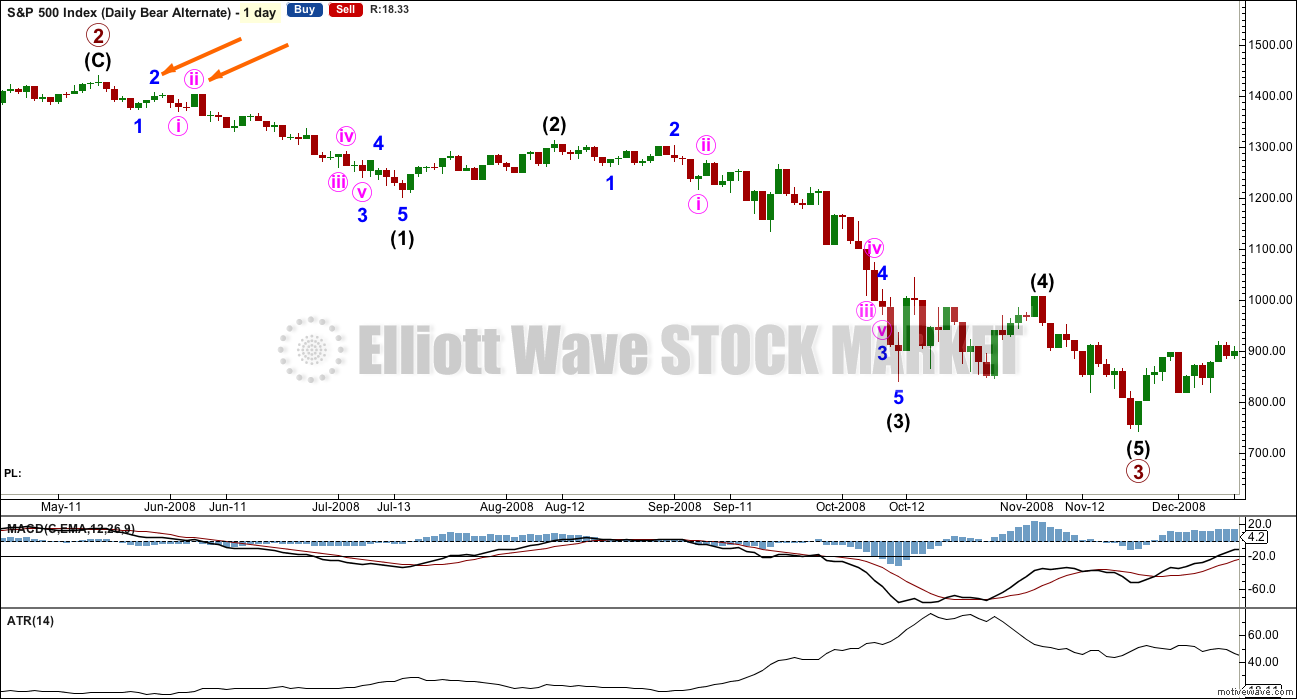
This chart is shown on an arithmetic scale, so that the differences in daily range travelled from the start of primary wave 3 to the end of primary wave 3 is clear.
Primary wave 3 within the last bear market from October 2007 to March 2009 is shown here. It started out somewhat slowly with relatively small range days. I am confident of the labelling at primary degree, reasonably confident of labelling at intermediate degree, and uncertain of labelling at minor degree. It is the larger degrees with which we are concerned at this stage.
During intermediate wave (1), there were a fair few small daily doji and ATR only increased slowly. The strongest movements within primary wave 3 came at its end.
It appears that the S&P behaves somewhat like a commodity during its bear markets. That tendency should be considered again here.
Looking more closely at early corrections within primary wave 3 to see where we are, please note the two identified with orange arrows. Minor wave 1 lasted a Fibonacci 5 days and minor wave 2 was quick at only 2 days and shallow at only 0.495 the depth of minor wave 1.
Minute wave ii, the next second wave correction, was deeper. Minute wave i lasted 3 days and minute wave ii was quick at 2 days but deep at 0.94 the depth of minute wave i.
What this illustrates clearly is there is no certainty about second wave corrections. They do not have to be brief and shallow at this early stage; they can be deep.
This chart will be republished daily for reference. The current primary degree third wave which this analysis expects does not have to unfold in the same way, but it is likely that there may be similarities.
DOW THEORY
I am choosing to use the S&P500, Dow Industrials, Dow Transportation, Nasdaq and the Russell 2000 index. Major swing lows are noted below. So far the Industrials, Transportation and Russell 2000 have made new major swing lows. None of these indices have made new highs.
I am aware that this approach is extremely conservative. Original Dow Theory has already confirmed a major trend change as both the industrials and transportation indexes have made new major lows.
At this stage, if the S&P500 and Nasdaq also make new major swing lows, then my modified Dow Theory would confirm a major new bear market. At that stage, my only wave count would be the bear wave count.
The lows below are from October 2014. These lows were the last secondary correction within the primary trend which was the bull market from 2009.
These lows must be breached by a daily close below each point.
S&P500: 1,821.61
Nasdaq: 4,117.84
DJIA: 15,855.12 – close below on 25th August 2015.
DJT: 7,700.49 – close below on 24th August 2015.
Russell 2000: 1,343.51 – close below on 25th August 2015.
To the upside, DJIA has made a new major swing high above its prior major high of 3rd November, 2015, at 17,977.85. But DJT has so far failed to confirm because it has not yet made a new major swing high above its prior swing high of 20th November, 2015, at 8,358.20. Dow Theory has therefore not yet confirmed a new bull market. Neither the S&P500, Russell 2000 nor Nasdaq have made new major swing highs.
This analysis is published @ 10:32 p.m. EST.
[Note: Analysis is public today for promotional purposes. Member comments and discussion will remain private.]
DJIA today breaks a neckline of a H&S pattern.
throwback to the neckline
a very nice entry point for a short here possibly. risk would be at 17,934.61, the high of the RH shoulder
Yep. SPX has bounced a number of times of this neckline so it has so far provided good support. It also happens to be right in the area of the 50 dma. I am sure it will ultimately follow DJI’s lead…
The other guys are saying this second wave correction could trace out a flat which would mean a bit of upwards movement tomorrow before the decline gets going in earnest. I am sure that would spook a few more bears who are not expecting such a possibility. Holding some dry powder JIC…. 🙂
What’s this? The other guys have also finally discarded their wave minor four designation for the current decline as being “too large” compared to the corresponding wave two. Whew! Boy I sure am relieved! 😀
On April 8 SPX closed at 2047.60 and UVXY closed at 20.93. Today SPX closed at 2047.63 and UVXY closed at 14.38.
There are an awful lot of folk short this animal(or a few brave individuals).
Not only are they short. They are apparently quite convinced near and midterm downside in SPX is quite limited. I suspect they will remain in relative comfort with their hineys exposed so long as the index does not take out its 200 dma.
I think we will see the first twitches, as it were, of discomfort with the initial take out of the 2000 pivot, which should come this week. They will no doubt be emboldened to “sit tight” if we get an initial bounce there for a probable minute four. By the end of minor three down, those twitches should by then have morphed into some very serious “quivering”. 🙂
Good morning every body. The main wave count is looking very good in terms of structure, so much so that I want to discard the alternate hourly today. The structure doesn’t make much sense.
With a new low below 2,039.45 minor 3 has now met the rule it must move beyond the end of minor 1.
We have fives to the downside and threes to the upside.
I’m keeping my shorts on for the ride. First target, 1,988.
Lara,
As per your main hourly chart, 2034.49 is minuette i, and 1988 is target of Minute iii, correct? So, what do you mean “With a new low below 2,039.45 minor 3 has now met the rule it must move beyond the end of minor 1”? Did you change your main hourly wave count?
The low of minor 1 is 2,039.45 back on 5th May.
Today minor 3 made a slight new low below that point. So far the low today is at 2,034.49.
The rule that the third wave must move beyond the end of the first wave is thus met. This is still only the beginning of minor 3, but with this important rule met it adds confidence to the main wave count.
The end of minuette wave (i) I have at the start of this session at 2,039.99, in the first hourly candlestick for today.
Lara,
So are we expecting a 3, of 3, of 3, of 3 on multiple degrees on deck for tomorrow’s trading?
Yep.
All still within intermediate (1)
Awesome. That would be a site to behold and I sure would love to see a “red” waterfall pattern tomorrow on my charts. 🙂
He he – ended down 0.01% – what a joke indeed 🙂 🙂
Nothing to see people – move along 🙂
EDIT – Google has it as 0.02% up – whatever it was, it was clear desperation.
TOS showed up .03% for SPY…
I am glad it finish higher because volume is lower today vs yesterday.
NOW… Fall One … Fall ALL on higher volume!
It doesn’t matter if we are up or down 0.02%. We have a clear green candle with a long upper wick. Price closed 3 points higher than it opened: green candle!
Small degree second wave still unfolding it appears…
Yep. PMs have become an awfully crowded trade.
PM’s taken to the woodshed today.
another long definitive red candle down would make me feel a whole lot better.
C’mon Mr M – let’s see a ‘crash close’ instead of the usual ramp job 🙂
Bear Market Rulez!!
Final push up so the tape doesn’t set off alarms that there could be “something wrong” 🙂
All the indexes have the same exact pattern today on the 5 min.
Fall one… Fall ALL!
Mission accomplished: final tape shows up .03% for the day.
It is really interesting. A few data feeds are actually showing a slightly down day with Investing.com printing a final red candle and SPX down 1.46 or 0.08%.
.03 up on TOS is SPY…
Olga,
Not going to happen as the market makers want majority of trading retailer etc. out of the game. The drop in futures will have limited participation and if opening has a big drop likely participation will be less from retail side. I hope that I am wrong and the markets crashes in the final minutes. 🙂
They are burning an incredible amount of capital in extending this small degree second wave and for the exact reason you stated. They really don’t want everybody and his grandmother jumping on the short side so close to options expirations.
Agree but to them it means printing more money as no one is keeping any tab on how much and where it is going… 🙂
Hopefully a green candle on unicorn 🙂
The FED Reserve Board Con Job # 666 started today for the next several weeks.
The shoveling of the Bull S _ _ T in full force! PLEASE… Shoot me now!
When are these banksters going to lie down and die?
Walking dead! 🙂
LOL!
Final GASP of a dead bull.
Hey Olga; we did the right thing this morning in exercising good risk management but don’t you feel a bit of bitter-sweet on days like today?
I am looking at some of the positions I closed this morning and going.. WOW! 🙂
There’s gonna be a whole lot of gappin’ tomorrow I think!
I bought back @ 13.59, 13.78, 13.55 & 14.14 (in that order looking at my order book). Doesn’t officially count as I didn’t declare in real time (happened too fast) but I’m happy in any case.
A dollar here and there shouldn’t make alot of difference in the scheme of things – time to make some money 🙂
Olga, Verne,
I’m still thinking there is a chance the alternate is in play here… Alternate will not really get invalidated until we go sub 2000. Is it because of the size an magnitude of this impulse that makes this a 3rd wave down vs. the finishing of minute b of the alternate?
This move being part of Minor 2 is starting to have the wrong look now imho – I think it is much more likely that the main count is correct provided price remains below todays high.
We currently have lower highs and lower lows – and moves down are impulsive. Whilst nothing is ever 100% I think the probability that Minor 2 is over is very high.
Risk is at todays high for that view – that’s where my short term stop is.
That said, I want to see a serious increase in momentum – I’m not 100% happy that UVXY is still going negative whilst the market is negative. It needs to start taking off pretty soon.
Got it 🙂
Thanks…
thats a relief… 🙂
thanks
To add to that – I just noticed that one of the waves down if Minute B was now a double zig zag would be an obvious three wave structure – should be a five (Wave C of the first Zig Zag) and what would be the X wave looks like a clear impulse (5 wave move) not a 3 wave move.
That significantly decreases the odds of us still being in Minor 2 imho so by default the odds of us being in Minor 3 are very high.
IMO it’s so bad I’m discarding the alternate idea that minor 2 is continuing.
The structure just does not fit.
Olga has pretty much stated what I also think. I think the 2000 pivot is important but not as a question of whether we are in minor three, but rather primary three….
Looks like we are now seeing a small degree second wave zig-zag….
Indeed!
Does this wave look corrective to you???
lol
Would like to see 2033.80 in the rear view mirror.
I’d like to see 2000 in the rear view mirror…way back in the rear view mirror…. 🙂
Farewell and adeiu,
Unto you Spanish Ladies… 🙂
Looks like we could finally be there
Looking forward to riding the wave with everyone here!! Thanks for all the input so far 🙂
The banksters are trying to wrestle the Grizzly. Get ready for some blood-sport….
Sound of crunching bankster bones….. 🙂
I think that move down just about qualifies as an impulse lol.
New low under 2039 and I’m a happy chappy.
We should see moves down like this all day every day before long if the wave count is correct.
This train is leaving the station folk. All aboard…! 🙂
Now that’s a (still small degree) 3rd. Been so long I forgot what they look like! 🙂
FOMC kicked it off…
When I first read this I thought you were cussin’ lol 🙂
Looking like the Unicorn has turned. Looking for a green print…
I don’t have a chart to support this, but UVXY seems to be ‘holding its head up’ rather well with this S&P upmove
Yep. Falling wedge with a low so far at 13.46. I thought we had a hammer at 13.52 but it move a bit lower. Looking for an impulsive move up prior to the close to get positioned. A green print would be definitive.
On the hourly chart, I’m seeing some positive divergences develop here in the SP. Trend on the hourly still down, but could be possibly setting up for a trend reversal soon. Just something to keep an eye on.
Move up since low of today possibly looks corrective with W-X-Y pattern completing now on 5 min chart.
Yep. Now looking alike a double zig-zag for a possible minuette two.
Hammer on one minute UVXY chart at 13.52
Double Zig-zag should be over here which is also the 61.8 retracement off 2039.99 low from 2071.88 high. If powers much higher be worried about alternative expanded flat. We will know within the hour. Here is hoping for the downside and break below 2039.
Price didn’t go low enough for alternate to be an expanded flat – so upside should be (fairly) limited even in alternate case.
(c) = (a) about 2062 for main count. 2055.16 might be first confirmation it’s over.
Good point. That gives a bit of added confidence we may turn down soon.
Very leisurely five down off this morning’s highs I think…need to break 2050.06
Think everyone’s just sitting tight waiting on the FOMC minutes in about an hour ten minutes!
We’re probably seeing a leak in the FOMC minutes with this surge up…
The news driven moves are generally false flags which are quickly reversed. It will be interesting to see how the market reacts to any news…
We need a strong impulse candle down ( or two) to decisively take out 2039.99 before I bite….
price just moved outside wedge, may move back up to test underside…
Check out the major bear volume bar on SPX just a while ago. Unless it is a broker glitch (Fidelity) somebody just dumped a major pile of SPX…daily volume as a result is greater than all of yesterday
Interesting!
here is the volume bar
HFT’s got bored? ;-
Interested to know if any members on other platforms see the same?
nope.
Not on TOS…
Yes, I see it on my chart
Does not look impulsive…bearish rising wedge I think….not the “right look” for a fourth wave…
Unless this market is playing a remarkable game of “Possum”, I think a third wave to the downside is on deck….scaling back into my Bermuda…. 🙂
We should now be in a C wave or 3rd Wave up depending on alt or main count. This is not currently acting like either. I’m getting suspicious.
It’s just made a higher high so has done enough to be a 2nd wave for the main count. If we start impulsing lower I’m scaling back into my shorts.
Below 2047.78 this whole move up is proven corrective by price.
Uh Huh!
A green print on UVXY and I am backing up the wagons, forget the cute spread trades…
If that is Minuette 2 finished, then sub min C was 2 point short of 0.618*A. No truncation so it’s done what it needs to do.
Maybe this current small move down is W2 of sub min C with a blast higher still to go. If so it should be a 3 wave structure down.
But it’s looking fairly tired to me atm. It’s also fallen out of the lower trendline of todays move up.
There are still a few ALT’s atm. Sub min B might still be in progress as an expanded flat, the count might be done, or it might only be Wave 1 of C up.
I got an extra pair if you need ’em!…Bermudas! 😀 😀
Anticipation…an-ti-ci-pa-a-a tion,
Is making me late…
its keeping me waiting… 🙂
UVXY 15 calls down to 0.80 ask…
Carly Simon if I recall properly. She had some great tunes.
Note to new members, occasional musical references are a free value added bonus to this site. Enjoy!
You got it!
And you are NOT so vain….. 🙂
Got a lot of play with the songs use in the ketchup commercial 🙂
Another BORING day developing… Out of here! Maybe back after 2:30.
I’m leaving in the next 30-45 minutes and will not return till after the close. Have fun all you EW counters (not quite the same as bean counters but engineer types for sure). I noticed at IB I can get 30 second charts. Anyone interested in analysis those?
I keep returning to my hourly charts.
You can even get 15 sec charts on IB 🙂 I have referred to it once or twice 😉
Looking for a higher low in UVXY in what could be the C wave of an abc….
Looks to me like a Zig-Zag up for minuette two unfolding. I could be wrong but this does not look like a C wave up in any way shape or form….I know the moves up have been a bit slowing to get going but this is really molasses!
A move of UVXY back in the green and I think the main count is on… 🙂
Noting again the Dow Jones (INDU) yesterday closed below the daily head and shoulders neck line. I mention this index because remember it is the only index which made a new high of the longer term April 20th, 2016 top. The SP500, the Nasdaq, the DJ Utilities 600, the Russell 2000 indexes all did not make a new high. As you can see price is below the neckline this morning.
It made the bounce back above the neckline the other day, however as we know volume was down.
One hour chart sporting a long upper wick….bearish…
A move below 2039.99 could not be a second wave so the best short term bullish case would be a fifth wave down in sub-min five of minuette one…or maybe expanded flat for minuette two?
UVXY 15 calls already down to 0.85 ask. If this is a C up I think they are going to get a lot cheaper. In that case I will try to pick up the 14.00 strike calls for the same pesos…maybe even the 13.00 strikes…! 🙂
Sure looking to me like an ABC correction underway. This is not the way face-ripping upside moves unfold. UVXY also arguing gainst a fourth and fifth wave secnario.
This could get interesting and real soon…
Opened stink bid to re-buy UVXY next week’s expiration 15.00 calls at 0.50. If filled, will re-sell 10.00/12.50 bullish credit spread for limit of 0.50 to get positions filled, once again at Mr. Market’s kind indulgence….this time a bit larger position if C up confirmed. First trade was a trial run…not too bad….donwside risk again 250.00 per contract if UVXY below 10.00 at the end of next week. Contingency order will be in place to close trade with a UVXY CLOSE below 12.50
A move in SPX to around 1969 should see UVXY trade to at the very lowest 20.00. 15.00 strike calls should go for at least 5.00. Once spread is closed, maximum risk is 0.50 (or lower), reasonable reward is 5.00 per contract or roughly 10:1
If spread allowed to expire wortless, which it probably would with a minute three down, cost basis is zero. How do you figure your return in that blissful case??!! 🙂 🙂
Are we hoping for a 2 wave correction here to go short! I get the hint that it’s not quite time to head south from some of the uncertainty in the comments of UVXY.
Much of the comment regarding UVXY is focussed on very short term movements.
Overall the downwards trend here is not in doubt, the only question is how high will the bounces be and where exactly will they end.
Each bounce presents another opportunity to enter short and to hold if you’re a trend follower.
We have many different trading approaches in this membership. From my simple position trading strategy (pick an entry during an established trend and hold it for weeks or months) to extremely complicated short term trades and hedges on volatile instruments like UVXY.
I’m tailoring my analysis and advice to a more simple trend following strategy for a position trader, because that’s what I understand best.
Thanks for clarifying that Lara, I am more happy following a trend than trying to catch swings! Mainly because I am usually at work and can’t follow what is going on.
Watching the channels like a polar bear eyeing salmon… 🙂
This morning’s gap already filled, as expected.
(another sign the biggie not here yet imo)
Just gone above base channel down from 2071.78 – so the impulse down from there likely over.
Above 2055.93 this current move up cannot be a 4th wave – it’s still in proportion with the 2nd wave (atm) so this could still be a 4th wave imo(meaning we will still get one more lower low) unless price confirms otherwise above 2055.93
If the impulse down from 2071 is over, this current move would be Wave A of an ABC up for the main count or Wave 1 of Minute C up for the alternate count.
Chart – if price breaks out above the upper purple trendline then the alternate is very likely playing out imho. 61.8fib @ approx 2059
Thanks for the hard numbers Olga. I gotta get the fib points on my chart activated. I like to keep thing Real Simple on my chart so your detailed comments very much appreciated!
I am labeling today’s 2054+ as the possible top of 4 as marked on your chart below with 5 yet to come. 4 could go higher but not much without penetrating 1 causing invalidation of this count.
I gave it lower probability as it went outside the base channel and now it is looking a bit long in the tooth, but it’s certainly still valid atm.
Also, the move down from 2054 looks corrective to me so I’m currently swaying toward that move being a B wave for the main count or Wave 2 for alternate (that move down might not be over yet).
I still expect higher movement eventually for both counts – how high and whether we get Waves 4 and 5 upward will determine which one.
That final low this morning was incredibly fast / short which certainly makes it worth seriously considering your count unless invalidated imo.
Target getting smashed. Anybody short? The next relief bounce should present a good opportunity. I think they (and quite a few others) are toast.
There goes the Unicorn heading South. Aaaaaaaand Now! The bounce….how high the moon? 🙂
Starting with fill of mini-gap open this morning, of course…watching the channel…
We have a new low so now let’s see what Mr. Mr Market has up his sleeve. Took short term profits on the move down and ready to reload.
Was a very short 5th wave – maybe still a bit more downside required? Above 2047.53 poss first clue this move down is over.
UVXY (and RSI) signalling the market intends to go higher sometime soon.
Yep. I noticed the moves higher have been a bit slow to get going lately, and then they take off like a bat out of you-know-where. Even when anticipated based on the expected wave count, the move hesitation can be a bit of a distraction initially. Trying to place more confidence in the expected count, until proven otherwise, of course! Higher it is….
The brevity is a bit of a curiosity. I was looking for UVXY to make a little mini double top and the end of micro three and five down but it just turned tail and headed for the basement….hmmmnn…..
Deep apologies to everyone here pertaining to the sentiment number I provided each morning for the last week. The numbers provided were accurate and true. But after looking at the link someone provided yesterday – Dailyfx.com – I called my (so called) friend this morning and confronted him on it. It got quite heated. He is getting the number from scanning the trading book and that part is true….but what he didn’t tell me is the figure is publicly available on the website above. I am mortified I misrepresented to you all otherwise. Not to mention angry, embarrassed along with a heavy dose of guillibility. Again, my deepest apologies.
No apology necessary to me. Please do not let it bother you anymore. These things happen and there was no harm or even false data. As has been said before, we are glad you are here with us Peter. Have a great day.
No harm no foul….you’re good.
I’m glad you’re here too.
No worries, still valid info…
No worries Peter. I seriously doubt any harm done on that score my friend.
It’s all okay, I certainly don’t feel misled.
We’re all open minded here, and we all from time to time make mistakes. I’ve made a few doozies!
Don’t beat yourself up for it, no one here feels wronged.
I’m still finding time to look at daily market stats from CBOE, chart it in excel and update daily. I’ll be using the put / call ratio for sentiment data.
Anyone know anything about Martin Armstrong and his track record? I hear lots of people mentioning his work, is he a legitimate analyst or a nut? His latest blog post says there can’t be a significant market decline/crash, he bases his model heavily on capital flows and confidence in government vs private sector. Thoughts welcomed and appreciated .
https://www.armstrongeconomics.com/markets-by-sector/stock-indicies/dow-jones/up-down-sideways-what-is-going-on/
My visceral response to any one categorically stating that some market event can or cannot happen is that they are either a propagandist or truly uninformed. If he is claiming that the market cannot crash, whatever his reason, I suspect his is both. I will take a look at the link and let you know what else I think… 🙂
O.K. I read the link and while I don’t share his optimism, the man sounds entirely reasonable to me. As I understand it, he is not so much stating what can or cannot happen, as he is challenging the reasons, prognosticators are giving for their predictions as to what will take place, and specifically that the FED raising rates will result in a market crash. It’s all about causation. He is right on the money about this market repeatedly taking both bull and bears to the woodshed. We will probably see a repeat of that habit for the unwary this morning! 🙂
I don’t know the guy but anyone who puts (TM) next to ‘Golden Rule of 3 Attempts’ and gives the impression that is market analysis (with a few trendlines on a chart) stretches credulity imo.
Maybe stating the obvious, but I haven’t found any other analyst as consistent and unbiased as Lara or other method of TA which is better than EW at predicting price (not saying it does not exists – but I’ve not found it).
jbarnet11, Thanks for the link. I know nothing about Martin Armstrong. But having read the linked article, I have some thoughts. He sees DJIA as having completed a Golden Rule of 3 Attempts most recently, mid 2015 to April 2016. I think it will prove wrong to assume we will break to the upside.
The Elliott Wave count for this 3 attempts is a Primary 1 down followed by a Primary 2 flat correction. The purpose of a second wave in a bear market is to convince the majority that the market correction is over. Think of it, the B wave in Primary 2 made a higher high. This convinced Mr. Armstrong and many others that 2016 will continue the bull market which began in March of 2009. Primary 2 did its job and did it well.
Thanks again for the post and link. We must always be open to hear arguments opposed to our thinking.
He does not seem to have much use for one of the most basic T.A. tools, like trendlines! 🙂
CORRECTION: In my above comment, I wrote the b wave made a higher high. I think it was the c wave of intermediate 2. For sure the DJIA made a higher high. Regardless of higher highs, Intermediate 2 convinced masses of people the bull market still reigns.
I just read about a rumour that Soros is massively short the market via SPY puts and recently doubled his position. This man is really hated by central banksters after what he did to the pound a few years back. The last thing retail traders need is a protracted fight between a hedge fund whale and the banskters. Let’s hope the strength of the current decline makes for smooth clear waves…if Soros is short, you can bet he has a few of his billionaire friends on stand by to help out if the going gets tough…
Also significantly long gold (via an unallocated ETF?? What the heck!??) and a gold miner (Barrick I think?). I’m with him on that one (albeit never unallocated).
In any case, I imagine he’d get the heads up well before everyone else if the ETF was about to go belly up due to lack of physical.
Here is a link to WSJ
“Soros Increases Bet Against the S&P 500”
http://blogs.wsj.com/moneybeat/2016/05/16/soros0516/
19 million shares Barrick
1 million shares GLD
2.1 million puts SPY. Wonder what the expiration of these are…
Futures again non-commital. Despite quiet openings we saw big moves the last two days. Out of respect for a possible minute C up, I will be lightening short term positions at the end of the impulse down today, which should be a sub-min five for both wave counts. The strength of the next move up should quickly differentiate the main and alternate counts. I would expect , for the main count, minuette two would complete intra-day and quickly take out the morning’s lows. On the other hand, a sharp minute C up would be very much in keeping with Mr. Market’s wily attempts to keep the crowd off balance, and keep the market in sideways mode in an options expiration week. The channels today are going to be very important.
I also intend to bail on some of my short on the expected sub-min 5 move down and see what the bounce brings – if it’s a clear 3 waves then I’ll jump back in. I made a mistake yesterday jumping straight back in when confirmation was met – I didn’t see the alternate until I was forced to look for one due to price mucking around in the base channel – lesson learned – in future I’ll look for ‘what if’s’ *before* the market forces me to!!
If sub-min 5 goes down below 2037 then there is a real risk that Minute C would shoot alot higher – usual target range is 1.618 the length Minute B. I don’t want to be on the wrong side of that if I can help it.
That said, Lara has it as an alternate so she must think odds of it playing out are less than the main count. Volume certainly seemed to favour the main count yesterday.
Futures now suggesting sub-min four already done and the final fifth wave down will unfold at the open. Ahead of a strong C up UVXY should really tank. I may also close out my spread trade as it is nicely in the money and there’s no point in giving back those gains, a quick double if closed at yesterday’s prices. I can buy the spread back for 0.25 giving me a cost basis for the calls of 0.45. Calls were bid at 1.15 at the close yesterday. Price should be a bit better at the end of the impluse down this morning.
Yeah – to manage risk- I’ve just sold to 50% of my short @ 14.72 pre-market.
We should be heading higher soon (for both counts) UVXY might not get back up to this level for a while.
I’m fairly confident I should be able to buy back in at a slightly better price and get confirmation from price of what Mr M has in mind for us.
As expected UVXY is acting like a sick old dog now.
Reduced short to 40% @ 14.60 (at last low – major UVXY div atm).
EDIT: It’s already gone negative! Selling in 14.70’s seems like it might have been a good move (atm!)
we might still see more downwards movement
I sure would like to see another move below 13, which I am sure we will get if a C up is indeed on deck…
Man, in this tricksy market you just gotta be quick on your fingers… 🙂
Thanks for the alternate. I was already casting around in my own mind what to do about potential wrangling around the pesky pivots- that can be a real party pooper. That alternate may provide critical guidance if we get a strong reversal there, a real possibility, and as likely a place as any if we see one sooner than expected.
Yep – that is the exact alternate I was concerned about yesterday. We need to drop out of the base channel ASAP – if we go above the upper channel line or start going upwards in 5 wave moves, then that count is very likely playing out imo.
It would certainly mess up the bulls and bear alike and doesn’t look out of proportion if a final C wave up is very swift.
I’ll certainly be staying nimble 🙂
Make that two! 🙂
I am thinking the alternate, while technically viable, would begin to be out of proportion with the 1st wave, Minor 1. I think that substantially reduces its probability.
I am concerned however, t hat we are beginning to see some bullish indicators and divergences. Counter trend rallies in the bear market will be powerful and can be very deep. They can seemingly creep out of nowhere. On the other hand, we saw last January that extreme oversold conditions can stay extreme as the market keeps falling. For instance, the SPX can ride the lower Bolinger Band for days in a downward direction whereas it would normally bounce upwards.
Prosperity and joy to all.
That is my concern – to stay looking right the C wave (if it plays out) would likely be fierce – maybe over in 1.5 sessions. So I’m keeping an eye on it. It would be ideal to get rid of alot of bears.
But Mr Market is very good at making me guess and second guess myself. I often make references to aviation and this reminds me of another thing that is beaten into you during training that helps me enourmously when trading – trust your instruments. If disoriented in cloud, your body can tell you are the hard banked one way when you are actually upright (spatial disorientation). Listen to your emotions you die, trust your instruments you live.
Needless to say, never listen to emotion – trust only price.
Word! 🙂
Vern,
You got the pole position today. Interesting week shaping up so far. No fear yet in the markets so we see how futures behave tonight and tomorrow morning.
Futures have not been too reliable lately. They certainly did not signal today’s big decline. I think the market is falling under its own weight so far. That will change as the bear takes hold I suspect…and you are quite right about the lack of fear. All the talk about how bearish folk are is meaningless with the VIX at 15…show me the money! 🙂
Hi 🙂