
Upwards movement was expected from the main hourly Elliott wave count, which is what happened.
Summary: The hourly wave counts are swapped over today. The new main count expects downwards movement to accelerate this week, with a short term target at 1,988 and a long term target still at 1,423. The new alternate allows for another one to three days of upwards movement first to 2,089. Invalidation and risk must remain at 2,111.05. In the short term, it looks slightly more likely that price will move strongly lower in the next few days.
To see last published monthly charts click here.
To see how each of the bull and bear wave counts fit within a larger time frame see the Grand Supercycle Analysis.
To see detail of the bull market from 2009 to the all time high on weekly charts, click here.
New updates to this analysis are in bold.
BEAR ELLIOTT WAVE COUNT
WEEKLY CHART
Click chart to enlarge.
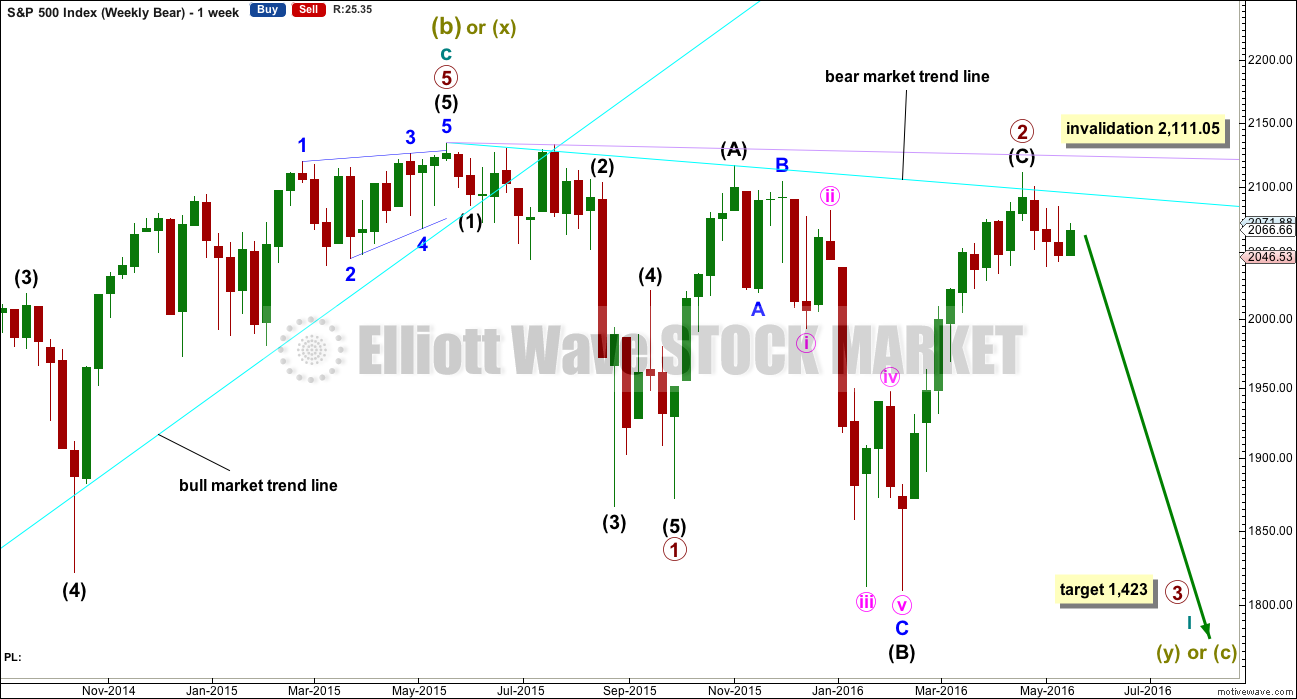
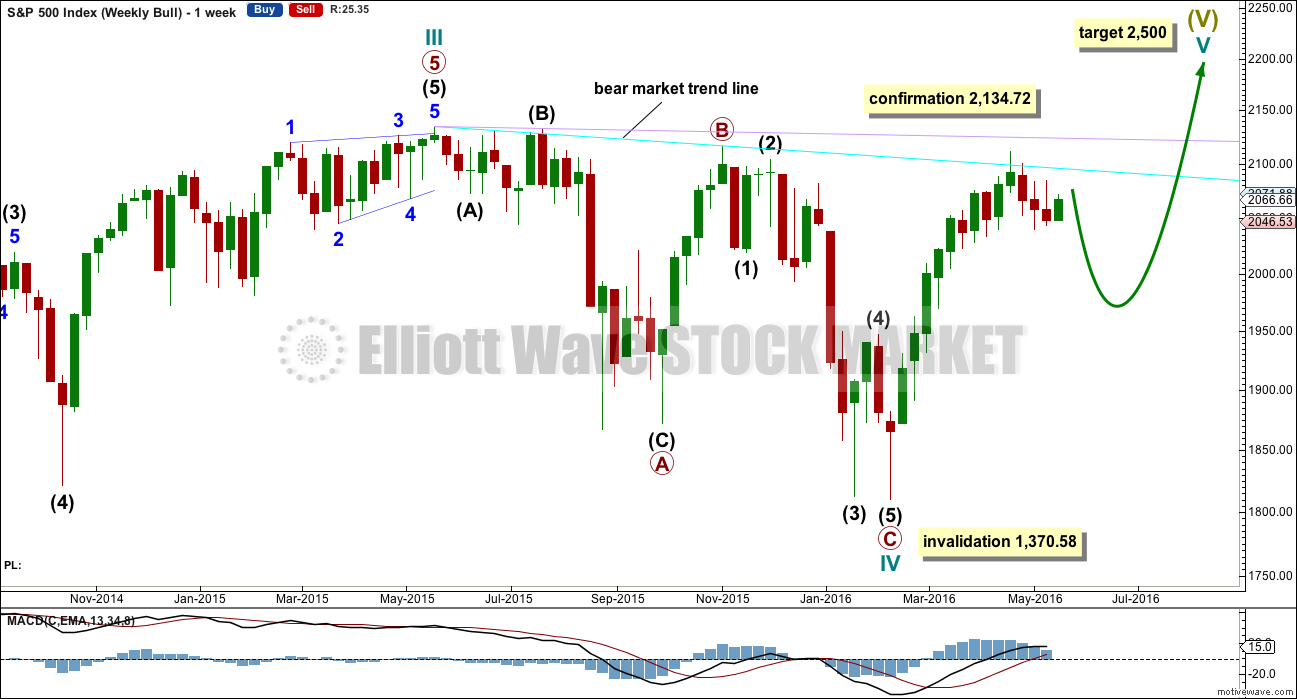
This bear wave count fits better than the bull with the even larger picture, super cycle analysis found here. It is also well supported by regular technical analysis at the monthly chart level.
Importantly, there is no lower invalidation point for this wave count. That means there is no lower limit to this bear market.
Primary wave 1 is complete and lasted 19 weeks. Primary wave 2 is over lasting 28 weeks.
An expectation for duration of primary wave 3 would be for it to be longer in duration than primary wave 1. If it lasts about 31 weeks, it would be 1.618 the duration of primary wave 1. It may last about a Fibonacci 34 weeks in total, depending on how time consuming the corrections within it are.
Primary wave 2 may be a rare running flat. Just prior to a strong primary degree third wave is the kind of situation in which a running flat may appear. Intermediate wave (B) fits perfectly as a zigzag and is a 1.21 length of intermediate wave (A). This is within the normal range for a B wave of a flat of 1 to 1.38.
Within primary wave 3, no second wave correction may move beyond its start above 2,111.05.
DAILY CHART
Click chart to enlarge.
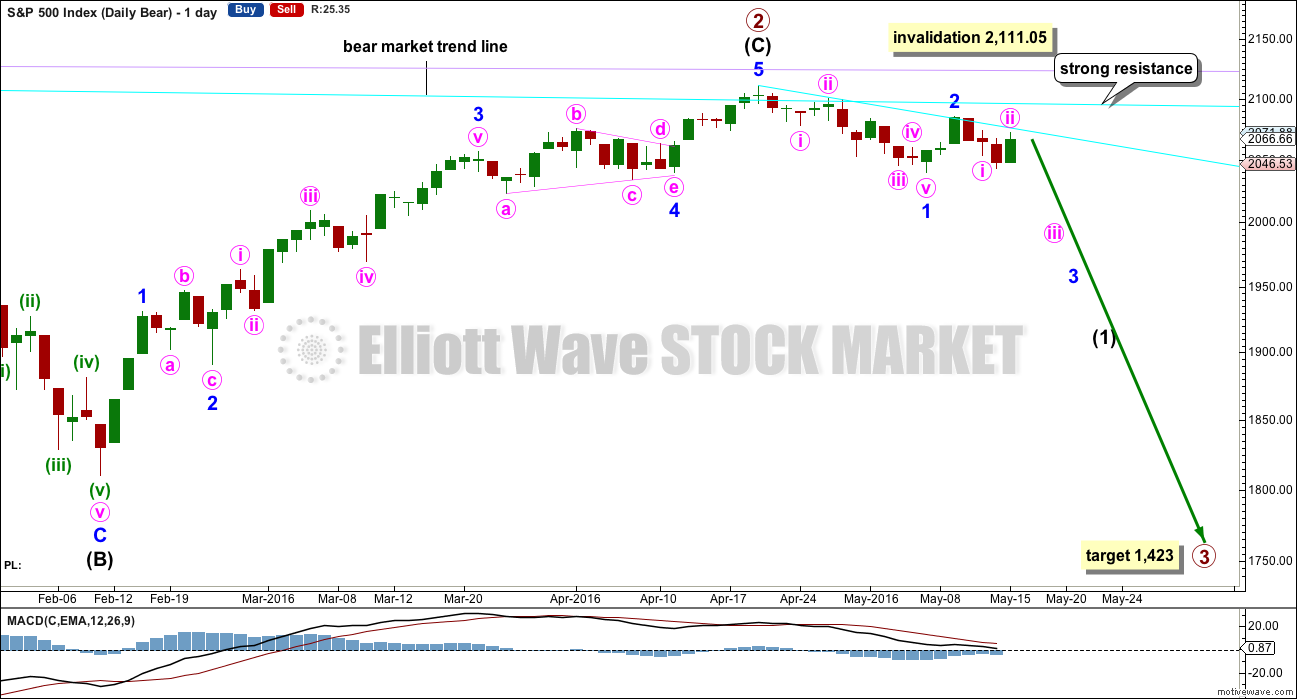
If intermediate wave (C) is over, then the truncation is small at only 5.43 points. This may occur right before a very strong third wave pulls the end of intermediate wave (C) downwards. At the end of last week, price has confirmed a trend change with a new low slightly below 2,039.74.
The next wave down for this wave count would be a strong third wave at primary wave degree. At 1,423 primary wave 3 would reach 2.618 the length of primary wave 1. This is the appropriate ratio for this target because primary wave 2 is very deep at 0.91 of primary wave 1. If this target is wrong, it may be too high. The next Fibonacci ratio in the sequence would be 4.236 which calculates to a target at 998. That looks too low, unless the degree of labelling is moved up one and this may be a third wave down at cycle degree just beginning. I know that possibility right now may seem absurd, but it is possible.
Alternatively, primary wave 3 may not exhibit a Fibonacci ratio to primary wave 1. When intermediate waves (1) through to (4) within the impulse of primary wave 3 are complete, then the target may be calculated at a second wave degree. At that stage, it may change or widen to a small zone.
At this stage, it looks slightly more likely that minor wave 3 is underway considering On Balance Volume at the weekly chart level, resistance at the short term cyan trend line, and structure at the hourly chart level. For these three reasons hourly charts are swapped over today. The main hourly chart below has a slightly higher probability than the alternate in my judgement today.
The equivalent minor wave 2 within the last big bear market was a 0.495 depth of minor wave 1 and lasted two days to minor wave 1’s five days.
The next possible equivalent minor wave 2 lasted one day longer than its minor wave 1 and was very deep at 0.81.
Overall, it is impossible to tell with certainty how deep and long lasting this minor wave 2 will be. Look out for possible surprises to the downside with a big third wave in its infancy.
Minor wave 1 lasted 12 days, one short of a Fibonacci 13. Minor wave 2 could be over at 0.63 the depth of minor wave 1 and lasting only two days as labelled, or it may be continuing to be deeper and longer lasting as per the hourly alternate wave count below.
Minor wave 2 may not move beyond the start of minor wave 1 above 2,111.05.
A short term bear market trend line is added from the high of primary wave 2 to the first small swing high of minute wave ii in cyan. This trend line is about where price is finding resistance. It is copied over to the first alternate hourly chart and the daily technical analysis chart.
I will publish two hourly wave counts in order of probability.
MAIN HOURLY CHART
Click chart to enlarge.
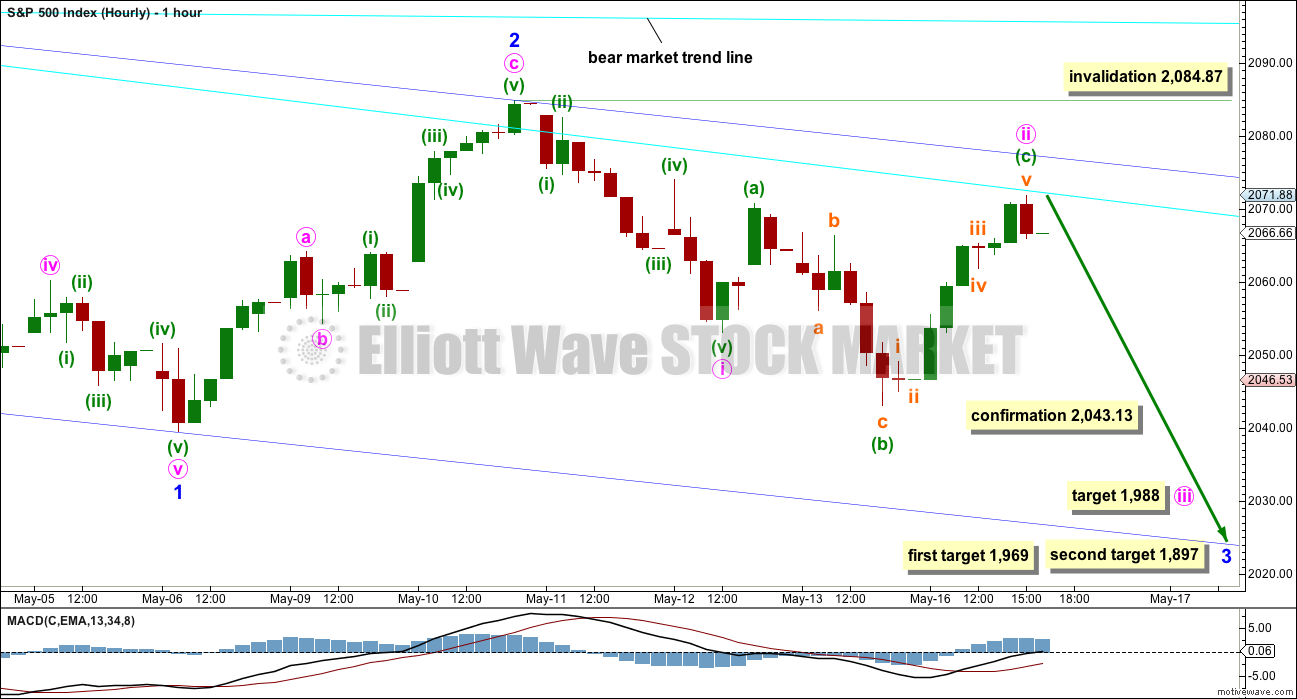
Minor wave 2 may be a complete zigzag, just a little deeper than 0.618 of minor wave 1.
Minor wave 3 may have begun and would reach 1.618 the length of minor wave 1 at 1,969. If price reaches the first target and the structure is incomplete, or if price keeps falling through the first target, then the next Fibonacci ratio in the sequence is 2.618 which gives a target calculation at 1,897.
Minor wave 3 may only subdivide as a simple impulse. Along the way down, lower degree corrections should find resistance at the upper edge of the dark blue base channel which is drawn about minor waves 1 and 2. Minor wave 3 should have the power to break through support at the lower edge of the base channel. Once that is done, the lower edge should then provide resistance.
Within minor wave 3, minute waves i and now ii may also be complete.
Minute wave ii fits perfectly as an expanded flat correction (these are very common structures). It is a 0.59 depth of minute wave i. It has found resistance perfectly as the short term bear market trend line, copied over from the daily chart.
Minute wave ii is an expanded flat. Minuette wave (b) is a 1.57 length of minuette wave (a). This is a little longer than the common range of 1 to 1.38 but within the allowable convention of up to 2. Minuette wave (c) is just 0.19 points longer than 1.618 the length of minuette wave (a). All subdivisions fit perfectly, particularly minuette wave (b) as a zigzag.
At 1,988 minute wave iii would reach 2.618 the length of minute wave i. If this target is wrong, it may be too high.
It would be extremely likely that minute wave ii is over at today’s high. A new high short term above 2,071.88 would reduce the probability of this wave count.
If minute wave ii continues higher, it may not move beyond the start of minute wave i above 2,084.87.
A new low below 2,043.13 would provide price confirmation of this main wave count. The alternate would be invalidated at that stage.
ALTERNATE HOURLY CHART
Click chart to enlarge.
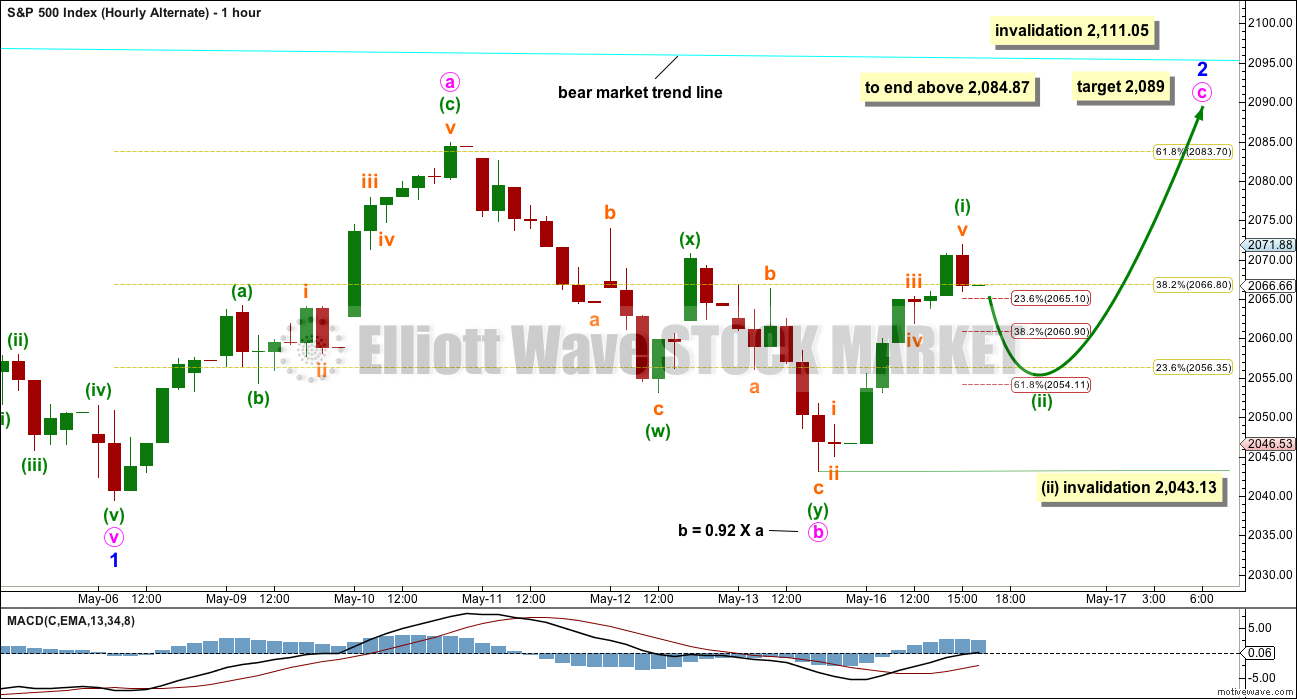
This was the main wave count up to the end of last week. Minor wave 2 may still continue higher, but today this wave count does not have as neat a fit in terms of subdivisions on the hourly chart.
Both hourly wave counts are identical up to the low labelled minor wave 1.
This alternate considers minor wave 2 continuing further as a regular flat correction.
Within the flat, minute wave a is a three, a zigzag. Minute wave b will fit as a three which is a 0.92 length of minute wave a, meeting the minimum 0.9 length required for a flat. At 2,089 minute wave c would reach equality in length with minute wave a.
The problem today is the subdivisions within minute wave b. For this wave count, a slight new low was expected to unfold at the start of Monday’s session, but this did not happen. Minute wave b will fit as a double zigzag on the five minute chart, but on the hourly chart this means seeing minuette wave (w) down as a three, and it has a better look as a five.
If minute wave c is underway, then it would be extremely unlikely to be over at today’s high because the truncation would be huge. That possibility should not be seriously considered. Only minuette wave (i) may be over.
Minute wave c is likely to move at least slightly above 2,084.87 to avoid a truncation. If minute wave c is truncated, that would not make minor wave 2 a running flat though. A running flat requires the B wave to move beyond the start of the A wave and this one does not.
Minuette wave (ii) may not move beyond the start of minuette wave (i) below 2,043.13. Invalidation of this alternate would add confidence to the main wave count.
In the short term, a new high during the New York session tomorrow (not during futures) above 2,071.88 would increase the probability of this alternate and decrease the probability of the main wave count.
BULL ELLIOTT WAVE COUNT
WEEKLY CHART
Click chart to enlarge.
Cycle wave IV is seen as a complete flat correction. Within cycle wave IV, primary wave C is still seen as a five wave impulse.
Intermediate wave (3) has a strong three wave look to it on the weekly and daily charts. For the S&P, a large wave like this one at intermediate degree should look like an impulse at higher time frames. The three wave look substantially reduces the probability of this wave count. Subdivisions have been checked on the hourly chart, which will fit.
Cycle wave II was a shallow 0.41 zigzag lasting three months. Cycle wave IV may be a complete shallow 0.19 regular flat correction, exhibiting some alternation with cycle wave II.
At 2,500 cycle wave V would reach equality in length with cycle wave I.
Price remains below the final bear market trend line. This line is drawn from the all time high at 2,134.72 to the swing high labelled primary wave B at 2,116.48 on November 2015. This line is drawn using the approach outlined by Magee in the classic “Technical Analysis of Stock Trends”. To use it correctly we should assume that a bear market remains intact until this line is breached by a close of 3% or more of market value. In practice, that price point would be a new all time high which would invalidate any bear wave count.
This wave count requires price confirmation with a new all time high above 2,134.72.
While price has not made a new high, while it remains below the final bear market trend line and while technical indicators point to weakness in upwards movement, this very bullish wave count comes with a strong caveat. I still do not have confidence in it.
The invalidation point will remain on the weekly chart at 1,370.58. Cycle wave IV may not move into cycle wave I price territory.
This invalidation point allows for the possibility that cycle wave IV may not be complete and may continue sideways for another one to two years as a double flat or double combination. Because both double flats and double combinations are both sideways movements, a new low substantially below the end of primary wave C at 1,810.10 should see this wave count discarded on the basis of a very low probability long before price makes a new low below 1,370.58.
DAILY CHART
Click chart to enlarge.
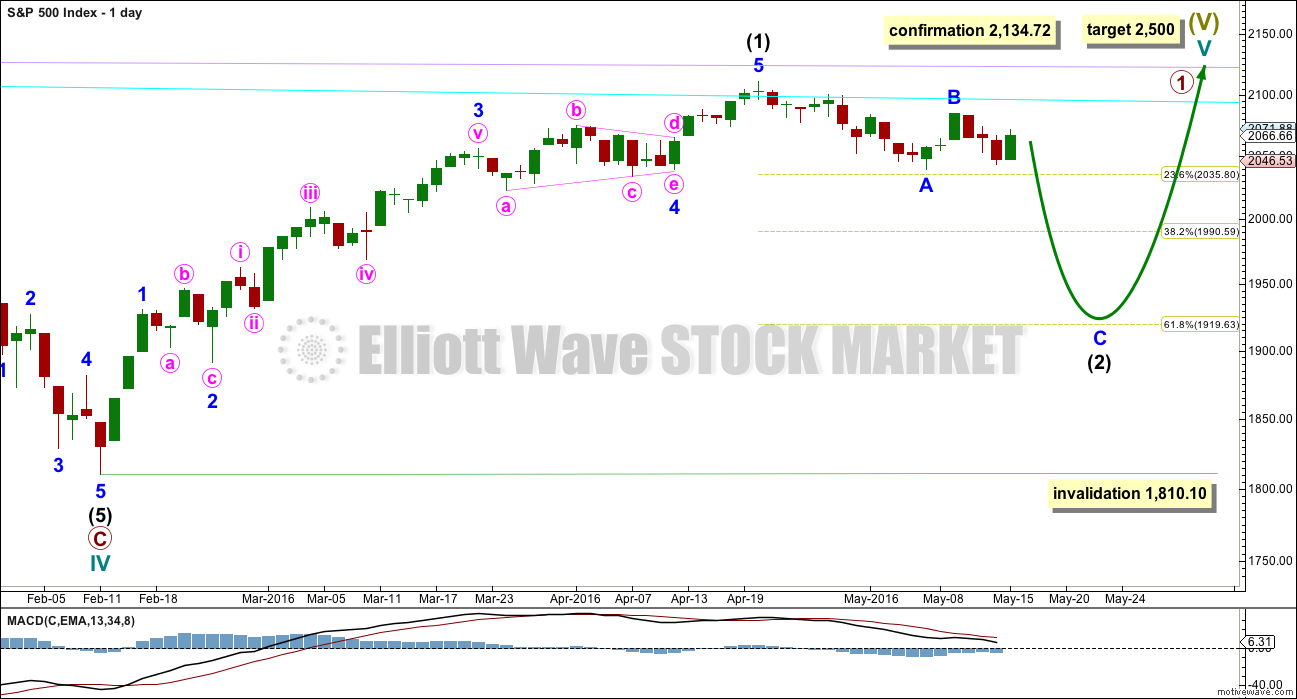
If the bull market has resumed, it must begin with a five wave structure upwards at the daily and weekly chart level. That may today be complete. The possible trend change at intermediate degree still requires confirmation in the same way as the alternate hourly bear wave count outlines before any confidence may be had in it.
If intermediate wave (2) begins here, then a reasonable target for it to end would be the 0.618 Fibonacci ratio of intermediate wave (1) about 1,920. Intermediate wave (2) must subdivide as a corrective structure. It may not move beyond the start of intermediate wave (1) below 1,810.10.
In the long term, this wave count absolutely requires a new high above 2,134.72 for confirmation. This would be the only wave count in the unlikely event of a new all time high. All bear wave counts would be fully and finally invalidated.
TECHNICAL ANALYSIS
WEEKLY CHART
Click chart to enlarge. Chart courtesy of StockCharts.com.
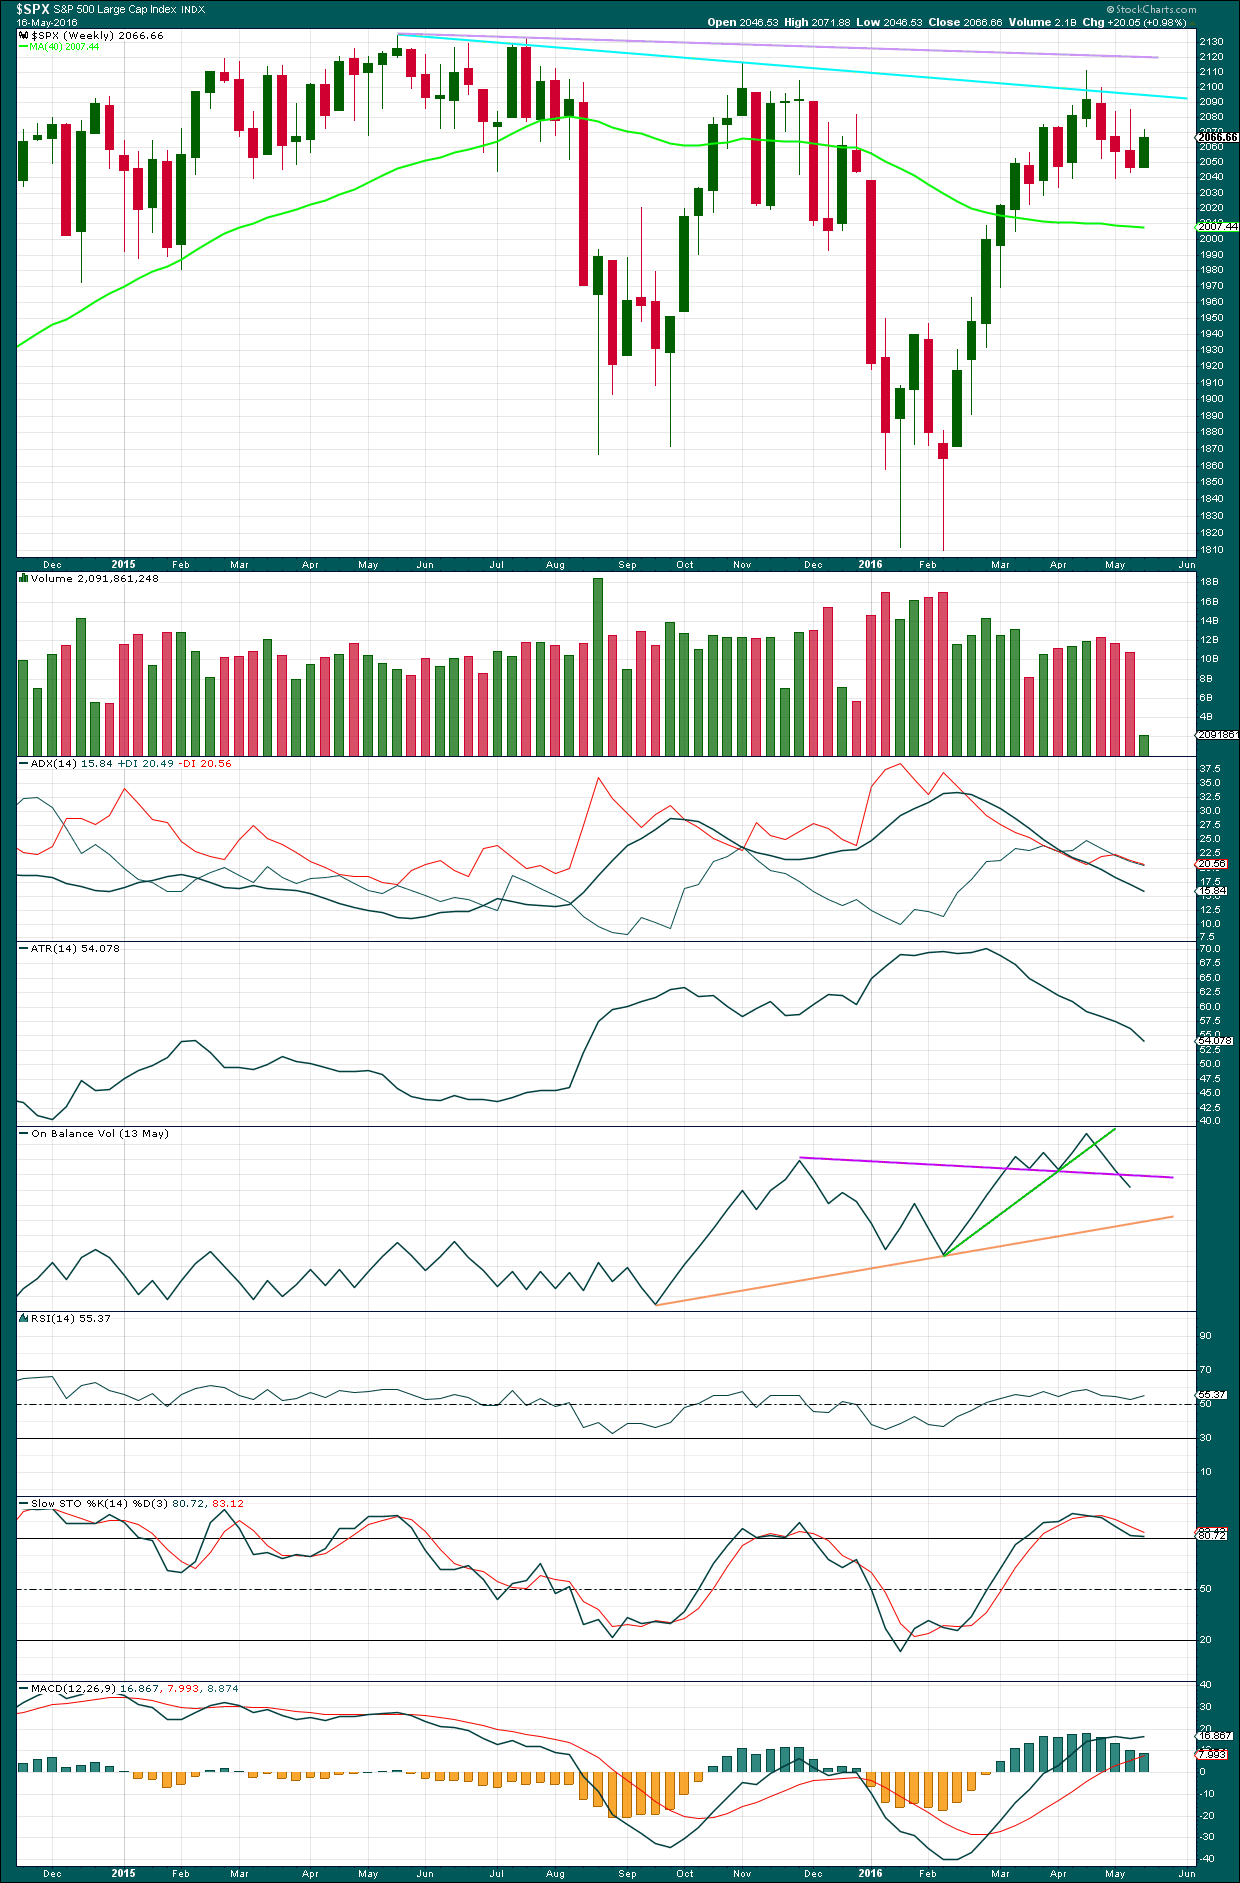
There is a bearish engulfing candlestick pattern at the last high. This has occurred at the round number of 2,100 which increases the significance. Volume on the second candlestick is higher than volume on the first candlestick, which further increases the significance. That it is at the weekly chart level is further significance.
Engulfing patterns are the strongest reversal patterns.
Now this pattern is followed by another red weekly candlestick. The reversal implications of the pattern are confirmed.
This is a very strong bearish signal. It adds significant weight to the expectation of a trend change. It does not tell us how low the following movement must go, only that it is likely to be at least of a few weeks duration.
Last week’s candlestick has a long upper shadow and is again red which is bearish.
There is another bearish signal from On Balance Volume this week with a break below the purple line. This does not indicate which hourly wave count is correct, but it does add weight to a downwards trend.
There is hidden bearish divergence between Stochastics and price at the last high and the high of November 2015. Stochastics has moved further into overbought territory, but this has failed to translate into a corresponding new high in price. Price is weak. MACD exhibits the same hidden bearish divergence.
After a period of declining ATR, it should be expected to turn and begin to increase.
DAILY CHART
Click chart to enlarge. Chart courtesy of StockCharts.com.
Volume data on StockCharts is different to that given from NYSE, the home of this index. Comments on volume will be based on NYSE volume data when it differs from StockCharts.
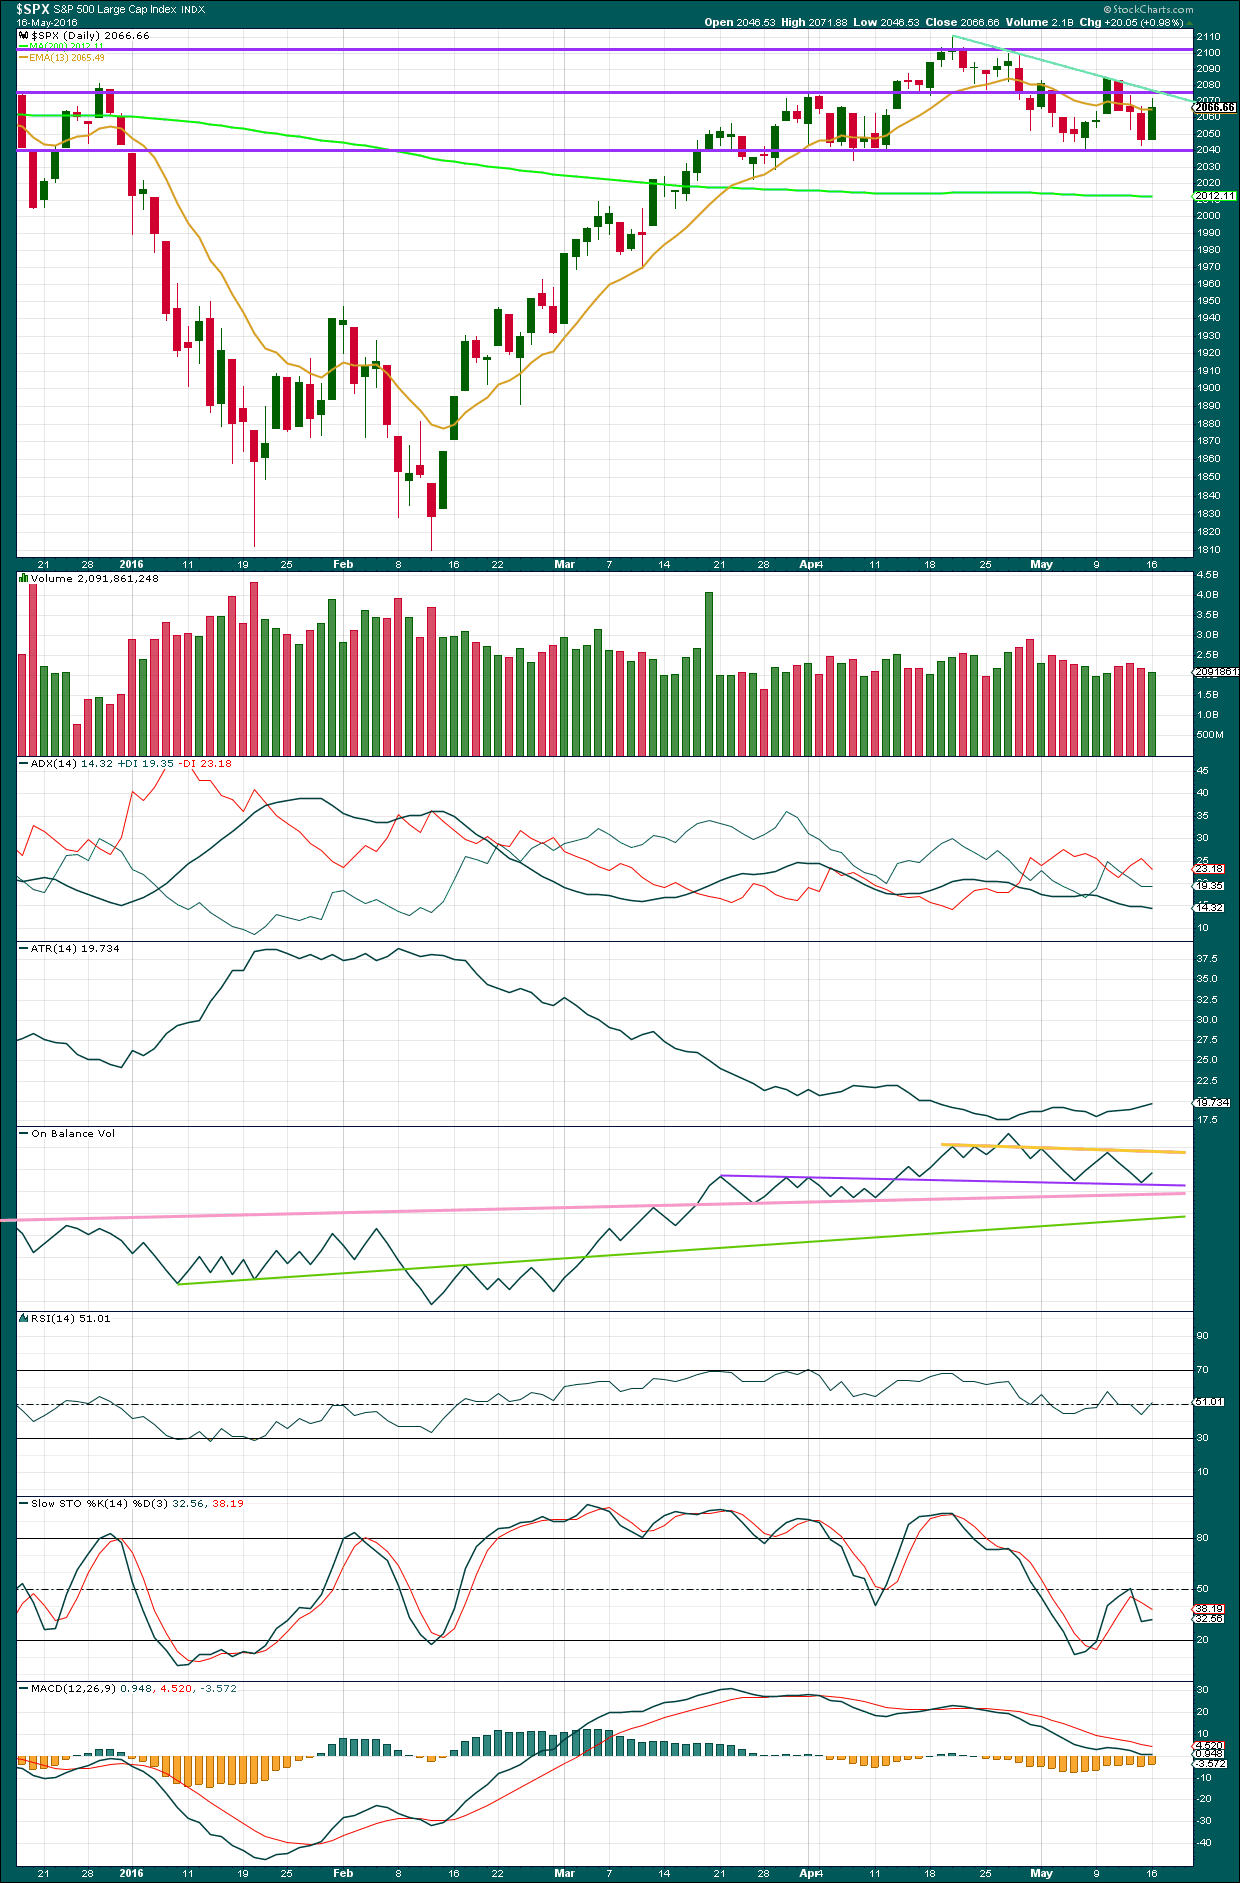
Price moved higher today on slightly lower volume. Today’s candlestick completes a bullish engulfing pattern. It could be argued that this comes after a small decline, or at the end of a small consolidation. If it is at the end of a decline, it would have a reversal implication. If at the end of a small consolidation, it would not have a reversal implication. With price moving sideways for about 10 days now, I would judge it to have more likely come at the end of a small consolidation, which may even be interpreted as a small pennant pattern. It is my judgement that this pattern does not have a reversal implication in this instance.
Price is finding resistance again at the short term sloping blue trend line. This line has been tested five times now, so it has some technical significance. It should be expected to most likely hold.
Price is finding support at the horizontal line about 2,040. Price needs to break through support here before acceleration may be expected.
ADX is declining indicating no clear trend. If a trend returns at this stage, it would be downwards.
ATR is beginning to show some increase indicating a trend may be returning. Some disagreement with these two indicators in the early stages of a new trend is to be expected.
On Balance Volume found support at the purple line and has moved up from there. If OBV moves higher, it should find resistance at the yellow line. A break below the purple, pink or green lines by OBV would be a strong bearish signal. The break below and retest of the yellow line was a weak bearish signal.
RSI is neutral. There is plenty of room for price to fall or rise.
Stochastics is close to neutral.
MACD is flattening off as would be expected during a counter trend movement.
VOLATILITY – INVERTED VIX DAILY CHART
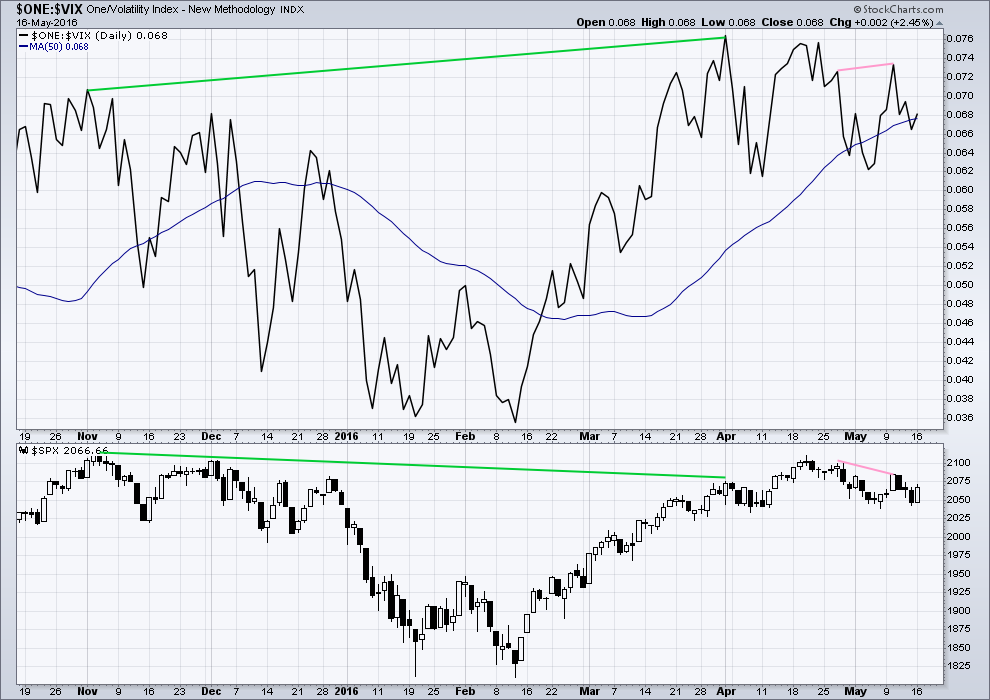
Click chart to enlarge. Chart courtesy of StockCharts.com.
Volatility declines as inverted VIX climbs. This is normal for an upwards trend.
What is not normal here is the divergence over a reasonable time period between price and inverted VIX (green lines). The decline in volatility did not translate to a corresponding increase in price. Price is weak. This divergence is bearish.
Unfortunately, there is no divergence between price and VIX for most recent movement to indicate which of the two hourly wave counts may be correct.
BREADTH – ADVANCE DECLINE LINE
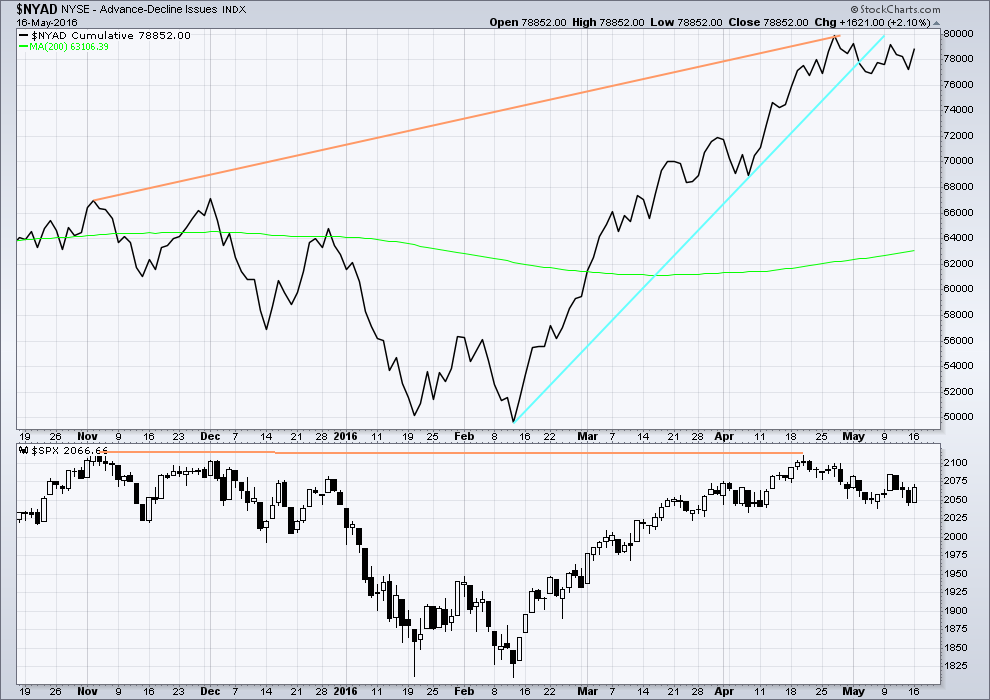
Click chart to enlarge. Chart courtesy of StockCharts.com.
With the AD line increasing, this indicates the number of advancing stocks exceeds the number of declining stocks. This indicates that there is breadth to prior upwards movement.
From November 2015 to 20th April, the AD line made new highs while price far failed to make a corresponding new high. This indicates weakness in price; the increase in market breadth is unable to be translated to increase in price (orange lines).
The 200 day moving average for the AD line is now increasing. This alone is not enough to indicate a new bull market. During November 2015 the 200 day MA for the AD line turned upwards and yet price still made subsequent new lows.
The AD line is now declining and has breached a support line (cyan). There is breadth to downwards movement; more stocks are declining than advancing which supports the fall in price.
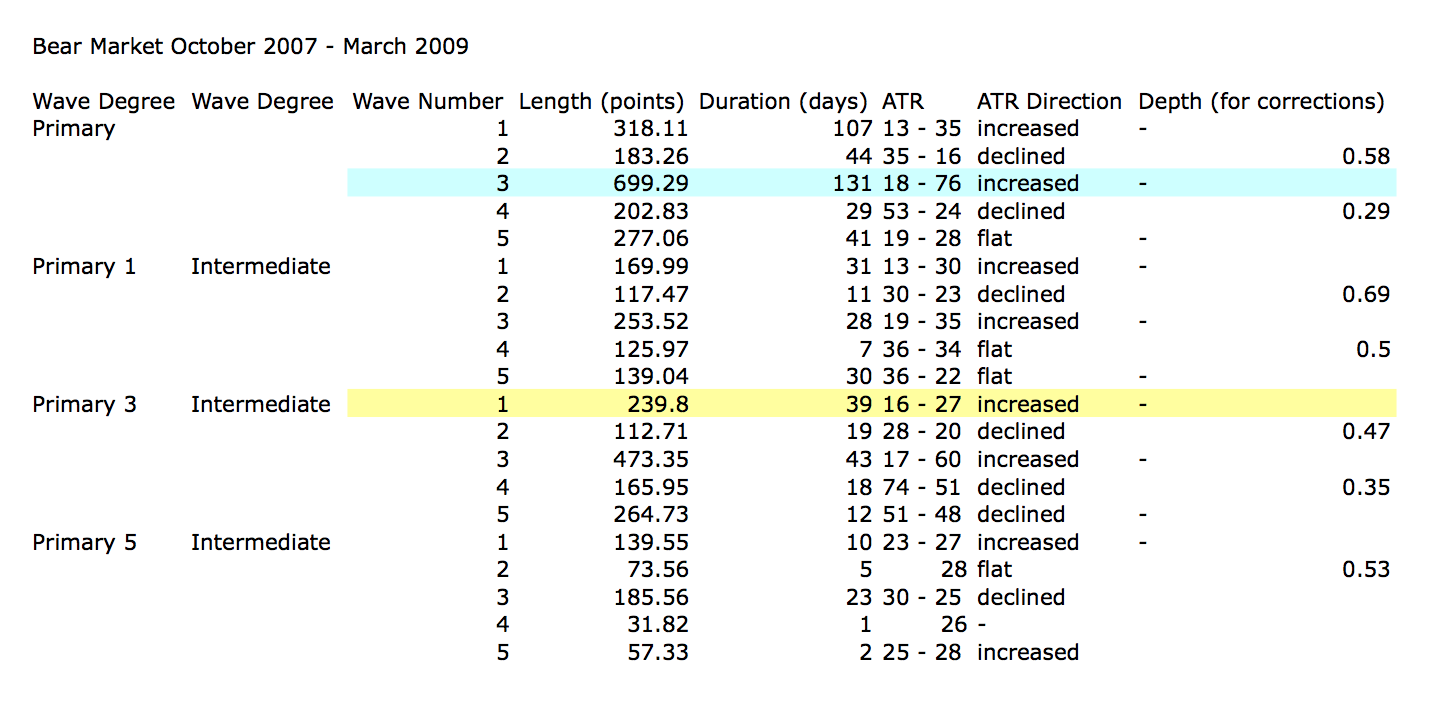
ANALYSIS OF LAST MAJOR BEAR MARKET OCTOBER 2007 – MARCH 2009
Click to enlarge.
In looking back to see how a primary degree third wave should behave in a bear market, the last example may be useful.
Currently, the start of primary wave 3 now may be underway for this current bear market. Currently, ATR sits about 19. With the last primary degree third wave (blue highlighted) having an ATR range of about 18 to 76, so far this one looks about right.
The current wave count sees price in an intermediate degree first wave within a primary degree third wave. The equivalent in the last bear market (yellow highlighted) lasted 39 days and had a range of ATR from 16 – 27.
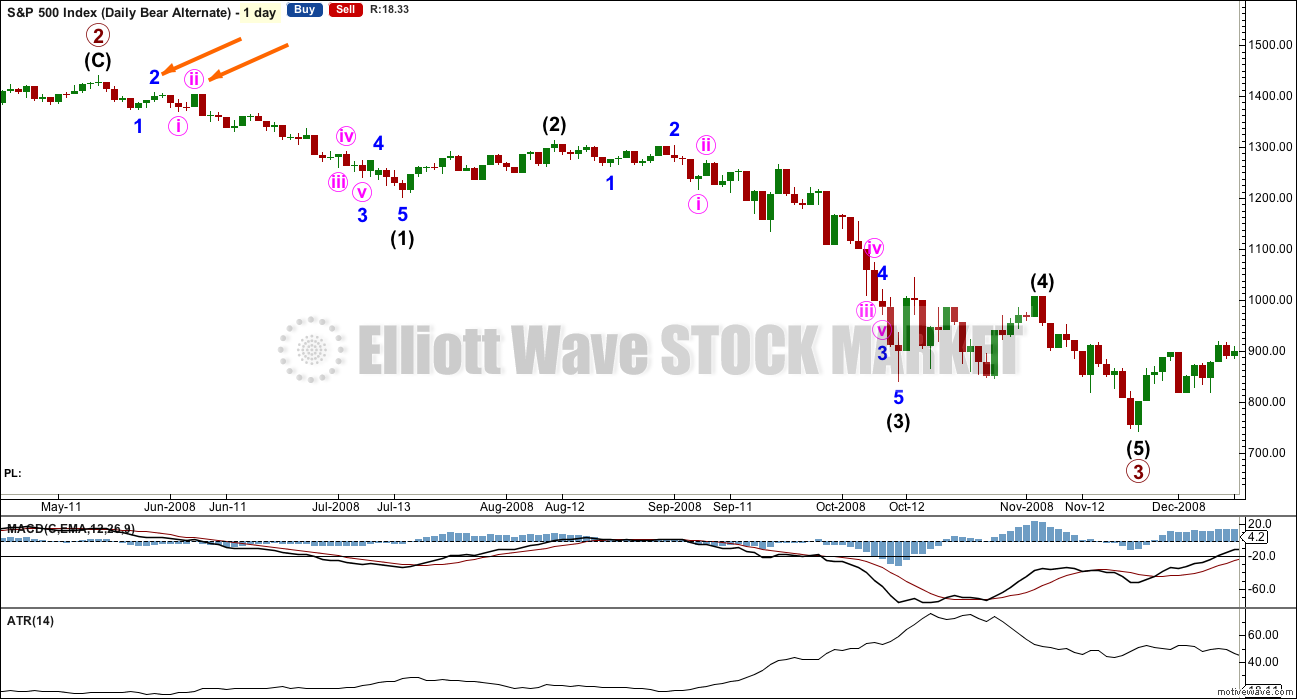
Click chart to enlarge.
This chart is shown on an arithmetic scale, so that the differences in daily range travelled from the start of primary wave 3 to the end of primary wave 3 is clear.
Primary wave 3 within the last bear market from October 2007 to March 2009 is shown here. It started out somewhat slowly with relatively small range days. I am confident of the labelling at primary degree, reasonably confident of labelling at intermediate degree, and uncertain of labelling at minor degree. It is the larger degrees with which we are concerned at this stage.
During intermediate wave (1), there were a fair few small daily doji and ATR only increased slowly. The strongest movements within primary wave 3 came at its end.
It appears that the S&P behaves somewhat like a commodity during its bear markets. That tendency should be considered again here.
Looking more closely at early corrections within primary wave 3 to see where we are, please note the two identified with orange arrows. Minor wave 1 lasted a Fibonacci 5 days and minor wave 2 was quick at only 2 days and shallow at only 0.495 the depth of minor wave 1.
Minute wave ii, the next second wave correction, was deeper. Minute wave i lasted 3 days and minute wave ii was quick at 2 days but deep at 0.94 the depth of minute wave i.
What this illustrates clearly is there is no certainty about second wave corrections. They do not have to be brief and shallow at this early stage; they can be deep.
This chart will be republished daily for reference. The current primary degree third wave which this analysis expects does not have to unfold in the same way, but it is likely that there may be similarities.
DOW THEORY
I am choosing to use the S&P500, Dow Industrials, Dow Transportation, Nasdaq and the Russell 2000 index. Major swing lows are noted below. So far the Industrials, Transportation and Russell 2000 have made new major swing lows. None of these indices have made new highs.
I am aware that this approach is extremely conservative. Original Dow Theory has already confirmed a major trend change as both the industrials and transportation indexes have made new major lows.
At this stage, if the S&P500 and Nasdaq also make new major swing lows, then my modified Dow Theory would confirm a major new bear market. At that stage, my only wave count would be the bear wave count.
The lows below are from October 2014. These lows were the last secondary correction within the primary trend which was the bull market from 2009.
These lows must be breached by a daily close below each point.
S&P500: 1,821.61
Nasdaq: 4,117.84
DJIA: 15,855.12 – close below on 25th August 2015.
DJT: 7,700.49 – close below on 24th August 2015.
Russell 2000: 1,343.51 – close below on 25th August 2015.
To the upside, DJIA has made a new major swing high above its prior major high of 3rd November, 2015, at 17,977.85. But DJT has so far failed to confirm because it has not yet made a new major swing high above its prior swing high of 20th November, 2015, at 8,358.20. Dow Theory has therefore not yet confirmed a new bull market. Neither the S&P500, Russell 2000 nor Nasdaq have made new major swing highs.
This analysis is published @ 12:07 a.m. EST on 17th May, 2016.
Vern,
As you mentioned options expiration this week, if the selling pressure gets going it will get real bad due to options influence. Interesting times. . 🙂
The selling pressure really still has not kicked in. The market just seems to be experiencing the kind of fall that indicates an absence of buyers. This may be the reason futures have not been too reliable of late of showing where the market is headed at the open. The big hedge funds, many of whom are market makers, still have a vested interested in trying to force sideways action so the next day or two will be interesting indeed. The may not want to risk a lot of capital trying to prop the market up if we are on the threshold of a third down and may just have to bite the bullet on near date expiry options they are on the hook for…
I’m throwing a wee spanner in the works.
An alternate survives.
This isn’t to confuse anyone or create indecision, it’s another “what if?”
What if the main count is wrong?
Can’t wait to hear your thoughts! EWT is dynamic until confirmed, so alternatives are always a possibility. 🙂
I just wanted to take a moment and say…
I freakin LOVE this place. Being a new member (in my first month still), I can’t believe how great this site is. Lara, you’re incredible! The work that you do is second to none. However, there’s so much more here then just your analysis, this community of traders with all their different insights and opinions is invaluable. Thank you all, I feel like this is such a great team here!
Can you believe I happened across this place by accident?! …fortunate I am.
Have a wonderful night all!
glad you are here , where you from ? we are from all over the world here. except for me.
Hi all, sorry. I left right after market close and just now getting back to the site. I live in the US and you can just call me Quang or Q for short.
I have 4 kids under the age of 10, so after market close, i am usually slammed with kid events (baseball, ballet, karate, and guitar lessons).
My sentiments exactly Quang Vo. I do believe I am fortunate as well.
I live close to doc. We live nowhere.
BTW, how shall we address you?
my quess is we scared him away, two aliens from nowhere can be a bit intimidating.
ROFL
You guys really are incorrigible.
Stop scaring the new members away!
Aliens indeed.
Quang Vo, we have members all over the world here. The US members are about 1/3 of our membership. We have members on all continents and time zones.
We have a couple of CMT’s and many members with decades of experience.
I would say that we have hundreds of years experience within this membership. There are a fair few who are kind enough to share their knowledge and experience, some regularly and others drop in from time to time.
Yes, it really has grown into a wonderfully supportive place to make money.
I have a strict comments policy which may be distilled as “be nice”. Which almost everyone is almost all the time, I rarely need to enforce it.
I encourage all new members to read the comments policy if you haven’t already.
Humour is always appreciated 🙂
humor too ?
Yeah, both versions appreciated
You know Lara, ‘incorrigible’ is what my teachers used to say about me. Like the one who told me to turn around. I asked her, “All the way?” She said, “Yes.” So I got up and turned in a 360 circle and sat back in my desk in the exact same position.
6 month sentiment
Here are more… 70% Bull
http://www.barrons.com/public/page/9_0210-investorsentimentreadings.html
Excellent…
Barrons has the AAII index, should have thought to look for that. One of the most solid sentiment gauges.
I have looked at AAII index for the last few years, every week. I find it useless! Everyone stuck in Neutral +- 10
iviewmarkets.com
FWIW – Just another data point.
One month change in sentiment.
iviewmarkets.com
Lots of good info on this site.
Due to the critical point we are at right now (DJIA did close below the daily head and shoulders neckline; SP500 did not), I called my buddy and the sentiment number is right now, as of 3:12pmCST (USA) – 77% SP500 traders are short.
That’s the same as the sentiment from dailyfx, not sure if theirs is just from the fxcm platform or not?
https://www.dailyfx.com/sentiment#pairsSPX500
small caps are breaking down with volume,, however the spy has not , close but no cigar, we can still bounce into option ex, so I am with Olga, hope is for that gap and go, but deviant this market is.
The market makers are NOT happy. They would have preferred sideways action into options expiration, so this decline is taking place without their permission (which is what bad-ass third waves are s’posed to do!). If we get a gap and go tomorrow, a lot of very savvy traders are going to inflict an awful lot of pain on them by scooping up tons of options expiring this week. They are going to try an protect themselves with ridiculous spreads but this third wave down is still going to burn ’em coming at this juncture.
The next conviction event for me is the round number pivots. This is the area of the 200 dma for both SPX and DJI and even for this minor wave three, the primary bear ought to absolutely demolish both the 200 dma and those pivots. A bounce there would cause me a bit of concern, but a smash through and return to kiss later would not. If fact that would be another really sweet set-up. Evening all! 🙂
SPX Volume much HIGHER Today! Highest since April 29th
682.175 Million Today
599.311 Million Yesterday
DJIA has a Bearish engulfing pattern on the daily chart.
That number may not be valid to the market as a whole as it’s only one firm… without knowing the name of that firm it’s hard to make a determination. It may be a firm that e-mini traders use to max leverage.
FYI:
SPX Volume Today materially HIGHER than Yesterday at this some time 3:35PM!
No Talking Heads are concerned about this move lower today. NONE!
Excellent! 🙂
Considering Lara’s target, we are probably in just the first impulse down of minute three…
I want to see the bears begin to charge and rip em into pieces of flesh. Steaks for the BBQ!
I don’t want to rain on the parade, but really want to see us drop out of this base channel and started blasting lower ASAP.
Whilst we remain in it, this move down from 2084 could still be corrective (Minute B of Minor 2) imho albeit the longer it takes the more odd it will start to look. Atm I don’t think it would look that odd with a swift C wave up to 2085 (albeit I’m not sure what the odds are – that’s where I totally rely on Lara’s judgement / experience).
But… whilst we remain below 2071 I’ll remain happy 🙂
We should get our gap ‘n go tomorrow….
Yeah – hope so.
Think maybe I’m still concerned by the high bearish percentage Peter is reporting. Price will reveal all!! 🙂 🙂
I posted a reply in the wrong place see above.
As I said before, just because you are paranoid, does not mean someone’s not out to get ya!
Nonetheless I am frankly just not seeing the fear…. 🙂
I like this thought process Verne…lol. I’m with you on it.
at least let’s get below the neckline of the SP’s H&S pattern!
Maybe tomorrow we’ll get a 3 of 3 of 3 down…???
Or is that just wishful thinking?
I do think the third of a third is still ahead. We have not had a gap down open so far and to not get at least one would be most unusual fora third wave. Remember this should be the strongest third down of the year so far..
I am with you, Olga. I will not celebrate till we approach the Minor 3 target of 1988. Then it will be time to liquidate. In fact, I already have my umbrella open. I would love to see us just stream right through 2039 and then the 200 day ema at 2012.
Volume certainly supportive it seems.
Anyway – I’m now 100% short for richer or for poorer.
If we start breaking above any base channels I’ll start gettin twitchy!
Yep. That’s exactly what it looks like.
So another second wave correction should offer a nice opportunity to load up more wagons (as Rodney says).
Very nice indeed.
Time to update FTSE today I think.
Another Super Happy Morning Dance day today 🙂
It would be even happier if there was surf, but the Pacific Ocean is having an identity crisis, it thinks it’s a lake 🙁
The only change today for the analysis really will be elimination of the alternate. Which is nice as it gives us all some clarity.
My shorts are a good fit!
For new members who may not have their shorts on, entry anywhere here should become profitable quickly. If the wave count is right price is approaching the middle of a third wave, it should accelerate downwards. There will be corrections along the way, markets don’t move in a straight line.
The invalidation point / risk today moves short term to 2,071.88. Within minute iii no second wave correction may move beyond the start of it’s first wave.
Manage risk to positions carefully. Do not invest more than 3-5% of equity on any one trade, always use a stop loss to close the position if the market goes against you.
plenty of wave here,, in fact here comes anutter one,,paddle hard
that was a dud,, wait for a good one
It’s a 4ft barrel! Coming straight at me!
The drop in looks steep
LOL
tubular !!
Price bounced perfectly off the lower Minute degree base channel (purple) – want to see that taken out now. Once below there we should see some acceleration.
Yep. That trendline should be broken with authority. I am looking at one a bit more short term that should be demolished shortly.
now them are some tasty candles,, this may be what we have been waiting for my friends, looks like some juice behind it too, volume up over the last hr.
boom…..there goes the alternate
Was there ever any doubt? 🙂
Not really in my mind. Of course I held out the possibility for the hourly alternate. But that just pushed things off a day or two.
I had one of those moments yesterday when Lara finally explained what Olga’s count called for. I felt it was a second wave but did not quite know how to label it.
Several analysts calling for 1969 before the first good bounce. UVXY should trade to at leat 20 by then and hoplefully I can unload my calls for 5 bucks or better.
UVXY did not gap this morning but move up seems to have conviction.
Calls with cost basis of 0.15 now at 1.28 bid. I doubt the Unicorn will be going back below 12.50 much less 10.00 in the near future. I will let spread expire hopefully worthless.
Reduced short position – now at 40% – just in case the move down from yesterdays high morphs into a double zig zag (so we don’t get another lower low).
Been robbed of a final move down twice before in recent days – not allowing Mr M a third go!
We’re close to invalidating alternate count…correct? If this was w2 down of wC up of …it’s getting pretty deep, well past 61.8% now?
Approx. 2049 is 76.4 fib – which is very suspicious (if a Wave 2 goes beyond there), but ALT invalidation remains @ 2043.
This market has shown extreme swings beyond the 76.4 fib quite a few times.
EDIT – price has now dropped beyond the 76.4 fib, and this wave down doesn’t look complete.
Odds starting to go in favour of main count – lower base channel break needed next
I’m out – awaiting a move below 2043 to get back in.
And.. back in again 100% short – Minor 3 confirmed 🙂 🙂
Never had any doubts lol!
Nice moves! Care to dance? 🙂 🙂 🙂
🙂 🙂
Is this the backtest of yesterday’s hourly channel break…pretty much right on the top edge of that downtrend line
DJIA is breaking down through the daily head and shoulders neckline
If the alternate hourly is in play we could rip higher from here!
I’m edging toward that scenario but we need price confirmation at 2063.37.
Maybe one more pop lower.
Above 2056.64 might be the first clue this wave down is done. Looks like a complete (or almost complete) 5 down from 2063.37 to me.
Still keeping an open mind atm.
It’s possible the wave down from 2063.37 was only wave 1 (of C), so this move down will be alot deeper (maybe wave 2 of C in progress now).
Above 2063.37 invalidates that idea.
Price is still contained within its base channel from 2071 – which base channel line is breached first might provide the initial clue as to where price is heading.
yes it would…..that’s why I have 1 foot out the door in case I need to cover…lol.
Must be nimble….however I am hoping for a nice long candle to the downside going below 2050 on the ES.
Daily SPX.
Weekly SPX is showing a pennant, bullish, see chart. But when looking at the daily SPX it looks like a desceding triangle, bearish. Go figure.
Daily head and shoulders is still in play too of course.
LOL…I was just thinking to myself, this market is clear as mud.
I counted 5 waves down from yesterday’s high, and this move off the lows today seems to be corrective. However, I am horrible with wave degrees. This is on a 5 minute chart on the ES. Here’s the confusion…classic TA is starting to look kind of bullish…go figure. Hoping market will show it’s hand sometime soon this afternoon.
I know, on the daily one can say it is a contracting or symmetrical triangle (p.37 of Elliott book) which is bullish. (from converging trendlines on the weekly chart I posted. Or a bearish wedge. Time to take profits and then I’ll enter on a breakdown or breakout.
5 down from todays high then this correction should be a second wave correction but on the other hand 5 up from yesterday this could be a b wave of an abc? does that mean we will go lower short term either way in either a C wave or 3rd of 3?
Yes – that is how I am playing it. But the correction is not necessarily over yet. On the next move down I’ll be unloading more shorts.
The move up from todays lows looks corrective to me but it wasn’t very deep for a 2nd wave (less than 50% but not far off)
If wave B (if that’s what it is) finished at approx 2063.37 then C = 0.618 A @ 2053 which is also the 61.8 retrace fib.
Below 2049 I start getting suspicious 🙂
Olga,
I think I understand what you are describing . . . Do you have a chart you could share, if it’s not too inconvenient? Then I know I’d get it. Thanks.
If price goes above 2063 in the near future then this move is def a 3 wave structure so Lara’s alternate count is very likely playing out imho. Going below 2043 confirms the main count.
At the moment I’m still edging towards the alternate count (so this move down today being fully retraced), but we need to await price confirmation.
Yes…but I just got short on the recent break down. I’ll wait for a turn before deciding to cover…on the 5 minute ES chart. hourly and daily confirming this move down.
Passing on a trading strategy: you can’t control the market, so control what is possible. Others have used this, as do I, but may help some here. Works either way if you’re looking to short or go long. I’ll use a short sell as an example here. It can be used for the day or for a couple of days or a couple of weeks depending on your personal risk tolerance.
1. You intend to go short in a market and it is at 965.10 right now.
2. Identify 2 resistance levels. We’ll say 970.55 and 973.40.
3. Establish the market is overbought (however you can best do that, fast stochastics is one; maybe
also wait to see a divergence) for the time period you’re planning to trade.
4. Market moves up into the 970.55 1st resistance area.
5. You sell short ten June S&P500 E-mini’s, entry price let’s say at 970.30.
6. At the same time buy into five September E-mini’s. Assume fill at 970.25 for our purposes here.
7. Scenario A: market goes down you close out all positions. Take your 100% profits of the ten June
contracts and then subtract your 50% (five Sept. contracts) loss = net profit. Trade is done.
8. Scenario B: market goes up
Option 1: market goes past first resistance of 970.55 – hold all positions until you get up into second
973.40 resistance. At that 2nd resistance’s point, or just before it, close out your five long Sept.
positions taking a profit on those contracts. You still have your ten June shorts yet. Put a stop loss above the 2nd resistance of 973.40 for those ten shorts. Choose a stop loss level you feel comfortable with depending on your own risk tolerance. Either: that resistance holds, market drops, you make money on the ten shorts. You made money on the five longs, and the ten shorts. (I’ll call that an “Olga trade”).
OR: market goes through 2nd resistance and you get stopped out. But note your loss is not that bad because you have your profits from the five longs to “take the edge off” the ten contract loss, as your overall average entry price for the net short position was higher.
Option 2: you have ten shorts and five longs, market went up through 1st resistance, is heading up into 2nd resistance point of 970.55. At or near the 2nd resistance target close out the five longs and take your profits. Also, close out five of the ten shorts and take your loss = but those two transactions gets you basically a breakeven. Now, you still have 5 short E-minis (from the 10 original). What you’ve done is just established a short position at a higher entry level and it cost you very little, if anything. Now, the market drops and the remaining five shorts are pure profit. If market continues going up through the 2nd resistance you’re stopped out, but with a smaller total loss.
The variations of this go on forever: use 3 resistance points instead of two; change around the number of contracts; change the ratio of short to long contracts, etc.. Noting as always there are risks in this game, a gap up or down can get you but that would be the same just having a one sided short (or long) position too. If anyone sees an error in these writings please let me know, thanks.
Peter May 17, 2016
Hedging in a nutshell.
Thank you very much Peter for the detailed explanation!
I am sure this comment will be read and re read by many members here.
For those who don’t know, Peter has decades of experience. He knows what he’s doing.
Thanks for sharing Peter!
I am starting to scale out of my short position – intend to be at 0% the nearer we get to 2043, then buy back in 100% if we go below there. Might now work out quite that way but given (what should be) limited upside by the alternate I’m not too worried – just want a bit of dry powder for if we’re going higher.
This wave down not the easiest to count but looks like an almost complete 5?? – poss wave A of and ABC zig zag? The structure of any bounce should be telling.
RSI div so perhaps nearing a bounce.
83% are short the S&P500 per the scan of the trading book at the brokerage. Open interest declined 8.8%.
Thanks Peter. Let me clarify. This is for one brokerage house albeit a major house. This is for traders only. This measures their positions, long and short, and assigns an on-balance label for each as long or short in total.
This is a large brokerage in the USA. They lean towards futures more than stocks overall. Each night they scan their trade book of all S&P500 positions: big contracts and mini’s. They then simply calculate the percentage of those long, those short. I get the email or call in the mornings before the market opens. They have some house traders, a couple of hedge funds, some hedging houses (investment banks), but overall lean more towards retail traders. They can scan the trade book any time they want even during market times (they probably do for their own use), and I can call and get it, but just thankful I get the number once per day for free. They have clients worldwide, so it should be a good statistical sample and thus the total short/long marketwide is not needed, or I should say is represented.
Thanks Peter
I am now able to post charts with labels. Yea for me. My account with IB is open and ready to be funded. Will be doing soon. Until then I am trying to learn their trading platform and charting tools etc.
What I need help with is how do I print / edit text on these posts so it appears after or below the image / chart I uploaded. I can get it to appear above but not below.
Sorry Rodney, it’s before or nothing.
You could upload a chart with a one word, or one letter comment. Then reply and make your longer comment in that.
Got it. I hate learning the new charting platform. But I need to change brokers as well. I have several accounts and I can access them all from one screen right now. Getting everything set up and linked etc is a pain.
You may have already discovered it – but the biggest thing that bugged me with IB platform (for a long time) was the chart(s) changing when you highlight / trade different products.
It seems when you open a new chart it automatically links it with the main trading window. To remove that you have to click the ‘chain link’ type symbol on the top right hand side of the chart and select ‘No Group’.
Drove me absolutely nuts for ages that did!
I came from their old trading platform (mosaic) – this newer platform is alot more complex so I had to almost start over when it was first released.
Thanks Olga. It is kind of you to give me these heads up.
So, I have two trading platforms running, three charting sites, two tabs with indicators I like to check throughout the day, Lara’s site and one other, and I manage my short, intermediate, and long term accounts plus two accounts for family members. Crazy! Not what I call keeping it simple.
I have one chart with only RSI on it (and trendlines) 🙂
Maybe I keep it far too simple! lol
I’m always pleased to hear about volume / sentiment etc from other members – otherwise I wouldn’t have a clue.
No, that is probably why you are able to focus so well on it.
Hey. I did not expect that the count with Minor 3 underway was going to be switched to the main count. I certainly am pleased as I am hoping to get back in the money quickly once it gets going. I suppose it will extend as well.
Thanks Lara.
I’m judging the new main count to only have a slightly better probability.
I don’t think the difference is very great.
I’ve got my shorts on 🙂
Well then, lets take a dive with the market. It will be either tomorrow or in a couple of days. We will be ready.
first and worst,, love the new count
Yeah we should thank Olga for the new count…
Thanks Olga!!!
I’ll second that. Thanks Olga!
Always helpful to have more eyes looking out for other alternates.