
Downwards movement for Wednesday’s session fits what was expected as most likely for the hourly Elliott wave count in last analysis.
Summary: A five down on the daily chart is complete. The following upwards correction is more likely incomplete, so it is more likely price will move higher for one or two days. This outlook would have confidence if price can make a new high tomorrow above 2,074.79. The target for the upwards correction to end is at 2,094. The bear market trend line should offer very strong resistance and risk is at 2,111.05. A less likely possibility (but one which has important implications and so must be kept in mind) is that the correction was over at yesterday’s high and a third wave down may increase momentum tomorrow.
To see last published monthly charts click here.
To see how each of the bull and bear wave counts fit within a larger time frame see the Grand Supercycle Analysis.
To see detail of the bull market from 2009 to the all time high on weekly charts, click here.
New updates to this analysis are in bold.
BEAR ELLIOTT WAVE COUNT
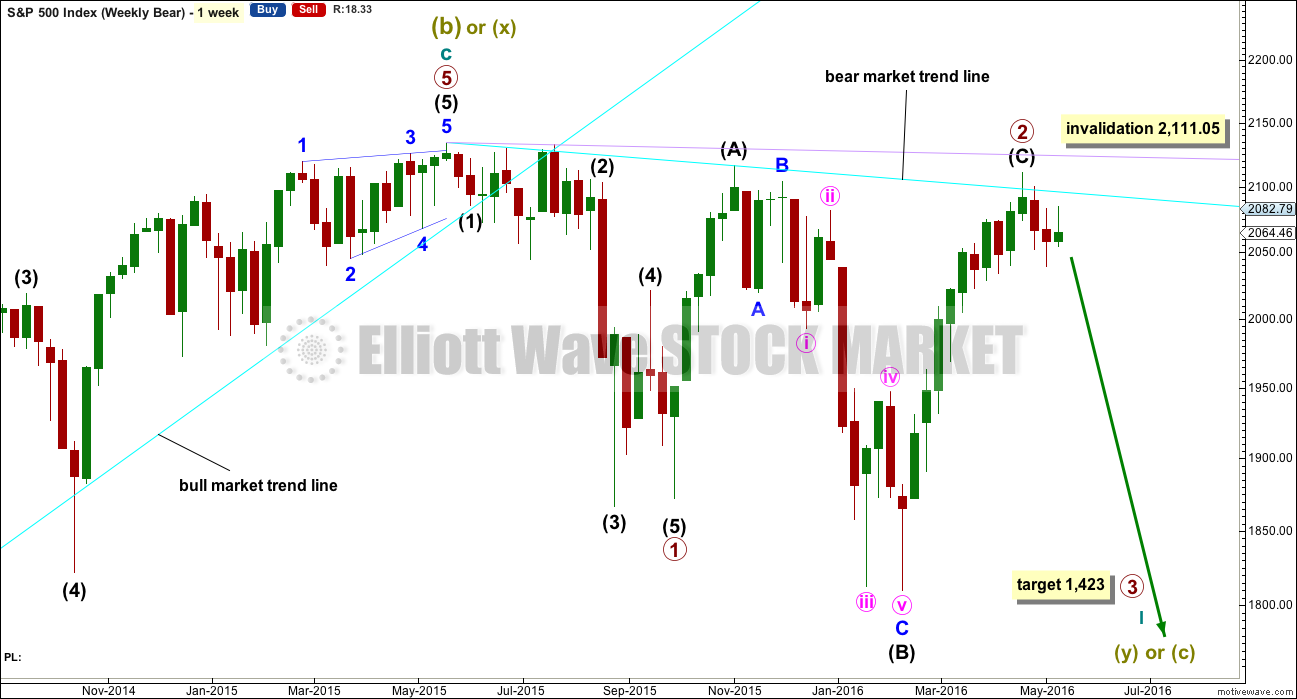
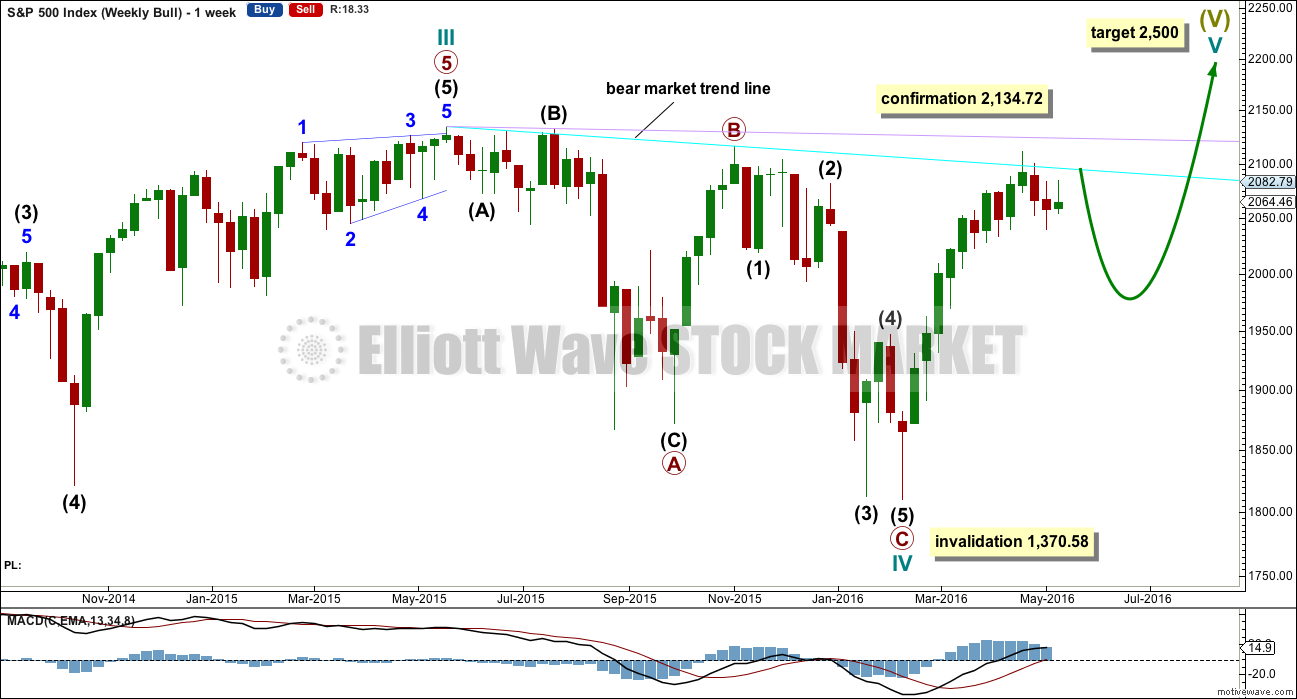
WEEKLY CHART
Click chart to enlarge.
This bear wave count fits better than the bull with the even larger picture, super cycle analysis found here. It is also well supported by regular technical analysis at the monthly chart level.
Importantly, there is no lower invalidation point for this wave count. That means there is no lower limit to this bear market.
Primary wave 1 is complete and lasted 19 weeks. Primary wave 2 is either over lasting 28 weeks, or it may continue for another one or two weeks.
An expectation for duration of primary wave 3 would be for it to be longer in duration than primary wave 1. If it lasts about 31 weeks, it would be 1.618 the duration of primary wave 1. It may last about a Fibonacci 34 weeks in total, depending on how time consuming the corrections within it are.
At the last high in April, the weekly candlestick has a long upper shadow which is bearish. The next candlestick completes a bearish engulfing pattern. That pattern is now followed by another downwards week, so it is reinforced.
Primary wave 2 may be complete as a rare running flat. Just prior to a strong primary degree third wave is the kind of situation in which a running flat may appear. Intermediate wave (B) fits perfectly as a zigzag and is a 1.21 length of intermediate wave (A). This is within the normal range for a B wave of a flat of 1 to 1.38.
Within primary wave 3, no second wave correction may move beyond its start above 2,111.05.
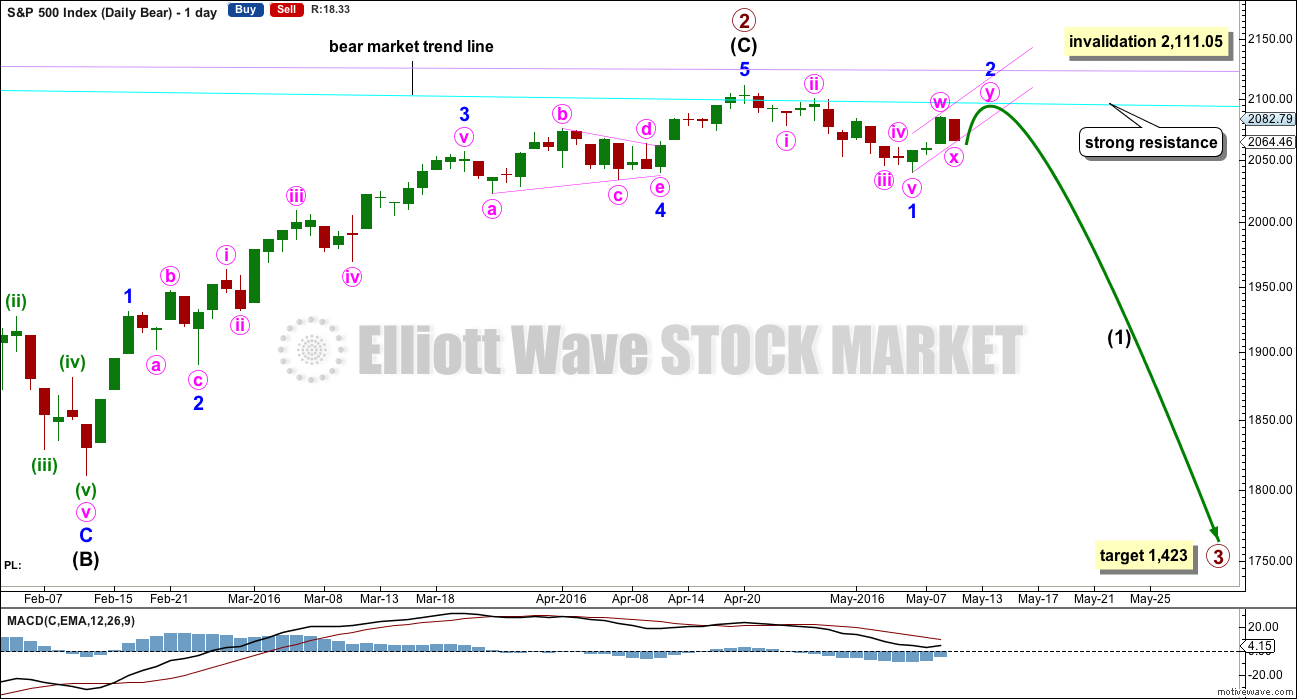
DAILY CHART
Click chart to enlarge.
If intermediate wave (C) is over, then the truncation is small at only 5.43 points. This may occur right before a very strong third wave pulls the end of intermediate wave (C) downwards. At the end of last week, price has confirmed a trend change with a new low slightly below 2,039.74.
The next wave down for this wave count would be a strong third wave at primary wave degree. At 1,423 primary wave 3 would reach 2.618 the length of primary wave 1. This is the appropriate ratio for this target because primary wave 2 is very deep at 0.91 of primary wave 1. If this target is wrong, it may be too high. The next Fibonacci ratio in the sequence would be 4.236 which calculates to a target at 998. That looks too low, unless the degree of labelling is moved up one and this may be a third wave down at cycle degree just beginning. I know that possibility right now may seem absurd, but it is possible.
Alternatively, primary wave 3 may not exhibit a Fibonacci ratio to primary wave 1. When intermediate waves (1) through to (4) within the impulse of primary wave 3 are complete, then the target may be calculated at a second wave degree. At that stage, it may change or widen to a small zone.
Draw a small channel about minor wave 2 upwards now and copy it over to the hourly chart. After some upwards movement, a subsequent breach to the downside of this small channel would confirm a trend change and a resumption of the new downwards trend for primary wave 3.
At this stage, if minor wave 2 has one or two more days of upwards movement to print one or two green daily candlesticks, then it would have a clear three wave counter trend look at the daily chart level. It does not have to do this, but this would give the most typical look. Another test of the bear market trend line, if that happens, should be taken as a gift from the market to enter low risk high probability short positions with an exceptionally good risk / reward ratio.
The equivalent minor wave 2 within the last big bear market was a 0.495 depth of minor wave 1 and lasted two days to minor wave 1’s five days.
The next possible equivalent minor wave 2 lasted one day longer than its minor wave 1 and was very deep at 0.81.
Overall, it is impossible to tell with certainty how deep and long lasting this minor wave 2 will be. Look out for possible surprises to the downside with a big third wave in its infancy.
Minor wave 1 lasted 12 days, one short of a Fibonacci 13. So far minor wave 2 has lasted only three days. The risk today is still that it could be over yesterday.
Minor wave 2 may not move beyond the start of minor wave 1 above 2,111.05.
Today I will publish three hourly wave counts in order of probability.
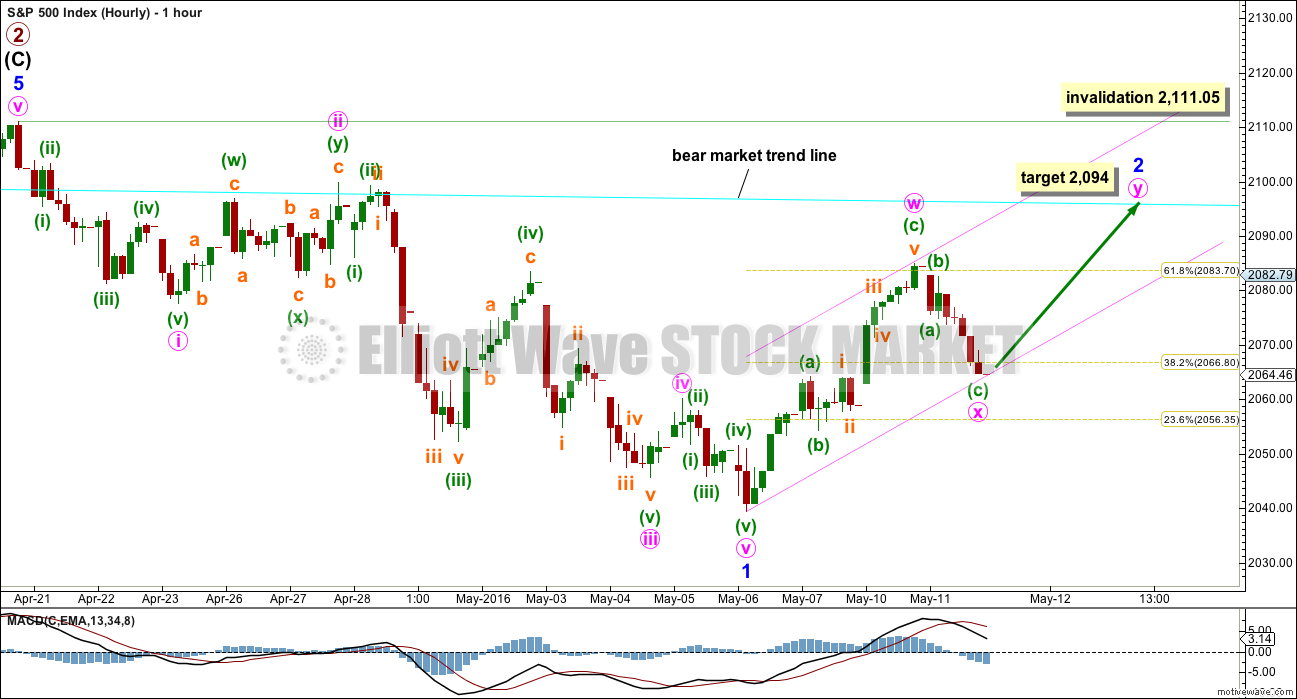
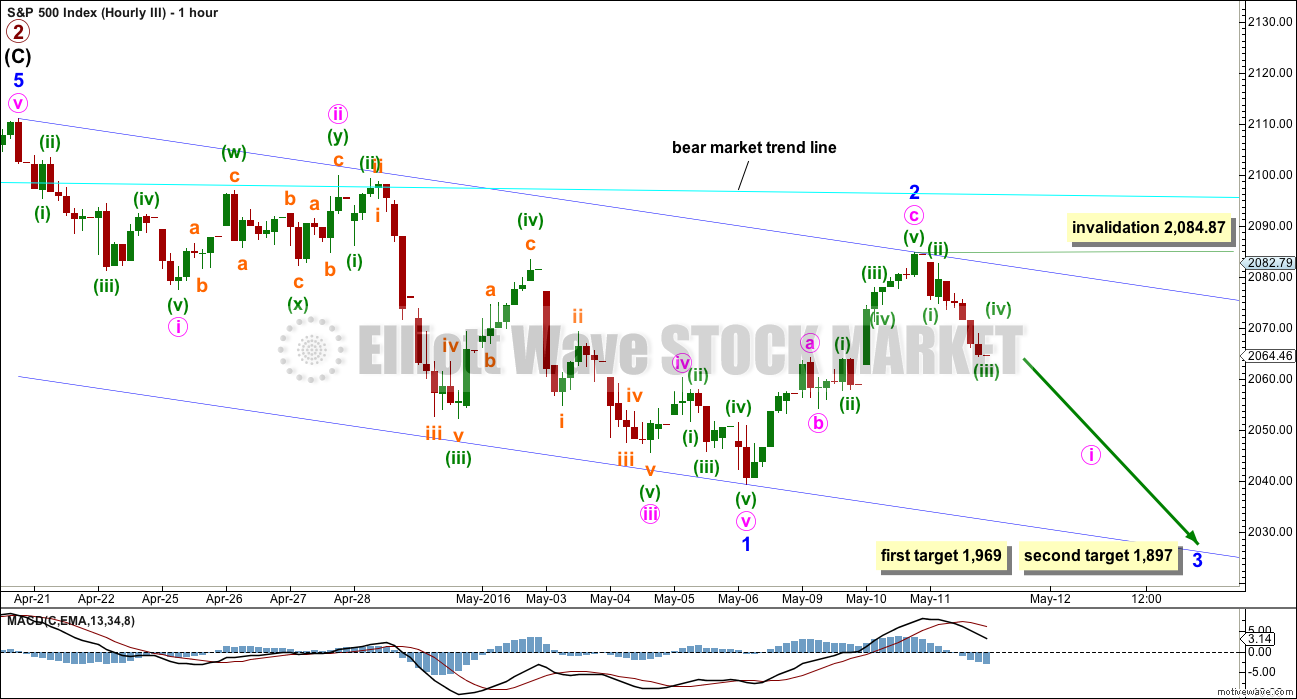
FIRST HOURLY CHART
Click chart to enlarge.
At this stage, it looks most likely that minor wave 2 is not over and may continue higher as a double zigzag.
This wave count is slightly more likely than the other two because it expects minor wave 2 to be longer lasting and a clear three wave structure at the daily chart level. This wave count would have better proportion.
Early second wave corrections, even within a primary degree third wave, can be very deep. They don’t have to be, but they can certainly be. Another test of the bear market trend line would be typical behaviour.
At 2,094 minute wave y would reach 0.618 the length of minute wave w.
Double zigzags are very common structures. They should have a clear slope against the prior trend. To achieve this look the X waves within double zigzags are normally relatively quick and shallow.
Minor wave 2 may not move beyond the start of minor wave 1 above 2,111.05.
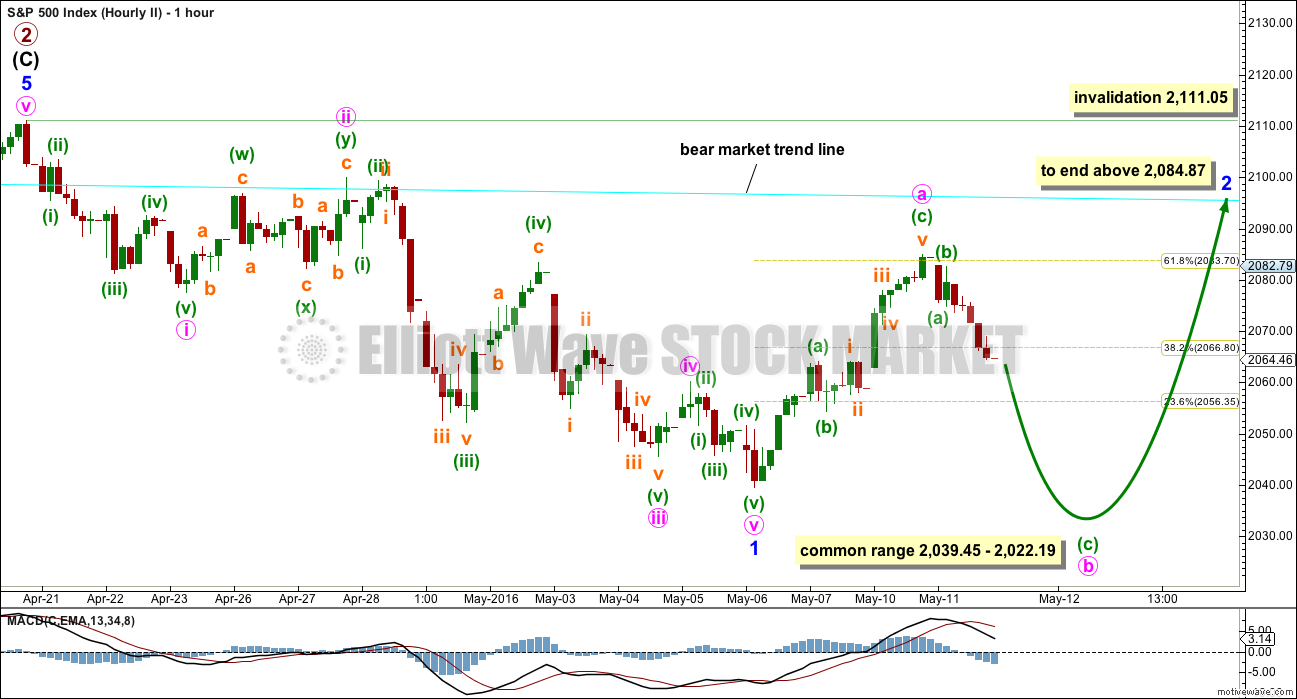
SECOND HOURLY CHART
Click chart to enlarge.
Minor wave 2 may continue as a flat correction. There is no lower invalidation point for this wave count because within a flat minute wave b may move below the start of minute wave a. The most common type of flat is an expanded flat where minute wave b would reach 1.05 the length of minute wave a at 2,037.18 or below.
Most unfortunately this wave count is valid and expects a very common structure. This means there is no lower price point which will confirm that minor wave 2 is over and minor wave 3 is underway.
If minor wave 2 continues further as a flat correction, then it would be labelled minute waves a-b-c. Minute wave b would have a common range of 1 to 1.38 the length of minute wave a giving a range for it to end from 2,039.45 to 2,022.19. Minute wave b must be a three wave structure and would most likely exhibit divergence in momentum and volatility with the low of minor wave 1. It could see a new low below 2,039.45 with weaker momentum and weaker volatility than the end of minor wave 1. Downwards movement must subdivide as a three.
Thereafter, minute wave c would be expected to make a new high above minute wave a at 2,084.87 to avoid a truncation. It would most likely end about the bear market trend line.
THIRD HOURLY CHART
Click chart to enlarge.
Finally, it is possible that minor wave 2 is over as a zigzag correcting to 0.634 the length of minor wave 1, very close to the 0.618 Fibonacci ratio.
The only thing which does not look perfect about this wave count is the duration and proportion of minor wave 2 to minor wave 1. A longer lasting correction for minor wave 2 would have a more typical look at the daily and hourly chart level.
If members’ own technical analysis favours this wave count, then this is the count which should be used. This wave count illustrates the possibility of a swift strong downwards movement in the next few sessions.
A new low below the end of minor wave 1 at 2,039.45 should be made with a five wave structure down for minute wave i, and would be most likely to exhibit stronger momentum than the low of minor wave 1. Volatility should also show an increase.
Within minute wave i downwards, tomorrow a small fourth wave correction for minuette wave (iv) may not move into minuette wave (i) price territory above 2,074.79 (taken from the five minute chart). A new high short term above 2,074.79 would invalidate this wave count and confirm the first wave count.
At 1,969 minor wave 3 would reach 1.618 the length of minor wave 1. If this target is met and the structure is incomplete, or if price keeps falling through the first target, then the second target should be used. At 1,897 minor wave 3 would reach 2.618 the length of minor wave 1.
The dark blue channel is a base channel about minor waves 1 and 2. The first indication that this wave count is wrong would come with a breach of the upper edge of the base channel. If minor wave 3 is underway, then within it corrections should find strong resistance at the upper edge of the base channel.
A breach of the lower edge of the base channel would be strong confirmation of this wave count.
Within minor wave 3, no second wave correction may move beyond the start of its first wave above 2,084.87.
BULL ELLIOTT WAVE COUNT
WEEKLY CHART
Click chart to enlarge.
Within primary wave C downwards, intermediate wave (2) is seen as an atypical double zigzag. It is atypical in that it moves sideways. Double zigzags should have a clear slope against the prior trend to have the right look. Within a double zigzag, the second zigzag exists to deepen the correction when the first zigzag does not move price deep enough. Not only does this second zigzag not deepen the correction, it fails to move at all beyond the end of the first zigzag. This structure technically meets rules, but it looks completely wrong. This gives the wave count a low probability.
This part of the structure is highly problematic for the bull wave count. It is not possible to see cycle wave IV as complete without a big problem in terms of Elliott wave structure.
Cycle wave II was a shallow 0.41 zigzag lasting three months. Cycle wave IV may be a complete shallow 0.19 regular flat correction, exhibiting some alternation with cycle wave II.
At 2,500 cycle wave V would reach equality in length with cycle wave I.
Price remains below the final bear market trend line. This line is drawn from the all time high at 2,134.72 to the swing high labelled primary wave B at 2,116.48 on November 2015. This line is drawn using the approach outlined by Magee in the classic “Technical Analysis of Stock Trends”. To use it correctly we should assume that a bear market remains intact until this line is breached by a close of 3% or more of market value. In practice, that price point would be a new all time high which would invalidate any bear wave count.
This wave count requires price confirmation with a new all time high above 2,134.72.
While price has not made a new high, while it remains below the final bear market trend line and while technical indicators point to weakness in upwards movement, this very bullish wave count comes with a strong caveat. I still do not have confidence in it.
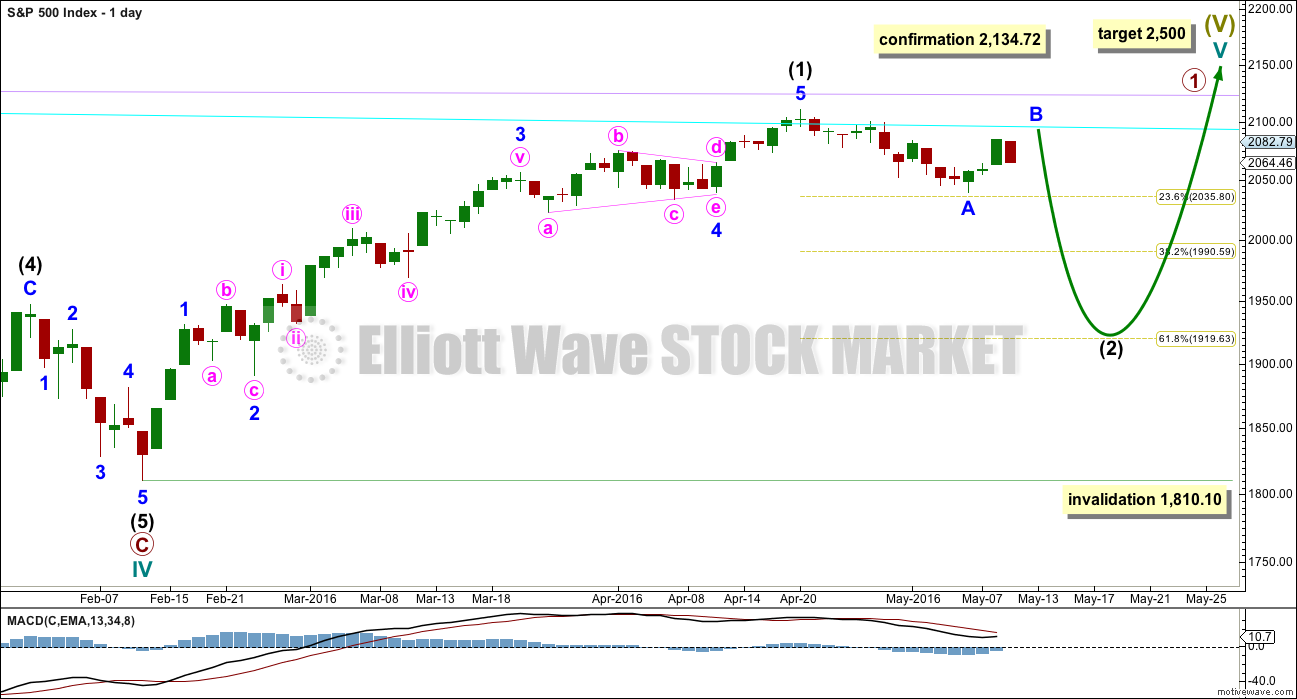
DAILY CHART
Click chart to enlarge.
If the bull market has resumed, it must begin with a five wave structure upwards at the daily and weekly chart level. That may today be complete. The possible trend change at intermediate degree still requires confirmation in the same way as the alternate hourly bear wave count outlines before any confidence may be had in it.
If intermediate wave (2) begins here, then a reasonable target for it to end would be the 0.618 Fibonacci ratio of intermediate wave (1) about 1,920. Intermediate wave (2) must subdivide as a corrective structure. It may not move beyond the start of intermediate wave (1) below 1,810.10.
In the long term, this wave count absolutely requires a new high above 2,134.72 for confirmation. This would be the only wave count in the unlikely event of a new all time high. All bear wave counts would be fully and finally invalidated.
TECHNICAL ANALYSIS
WEEKLY CHART
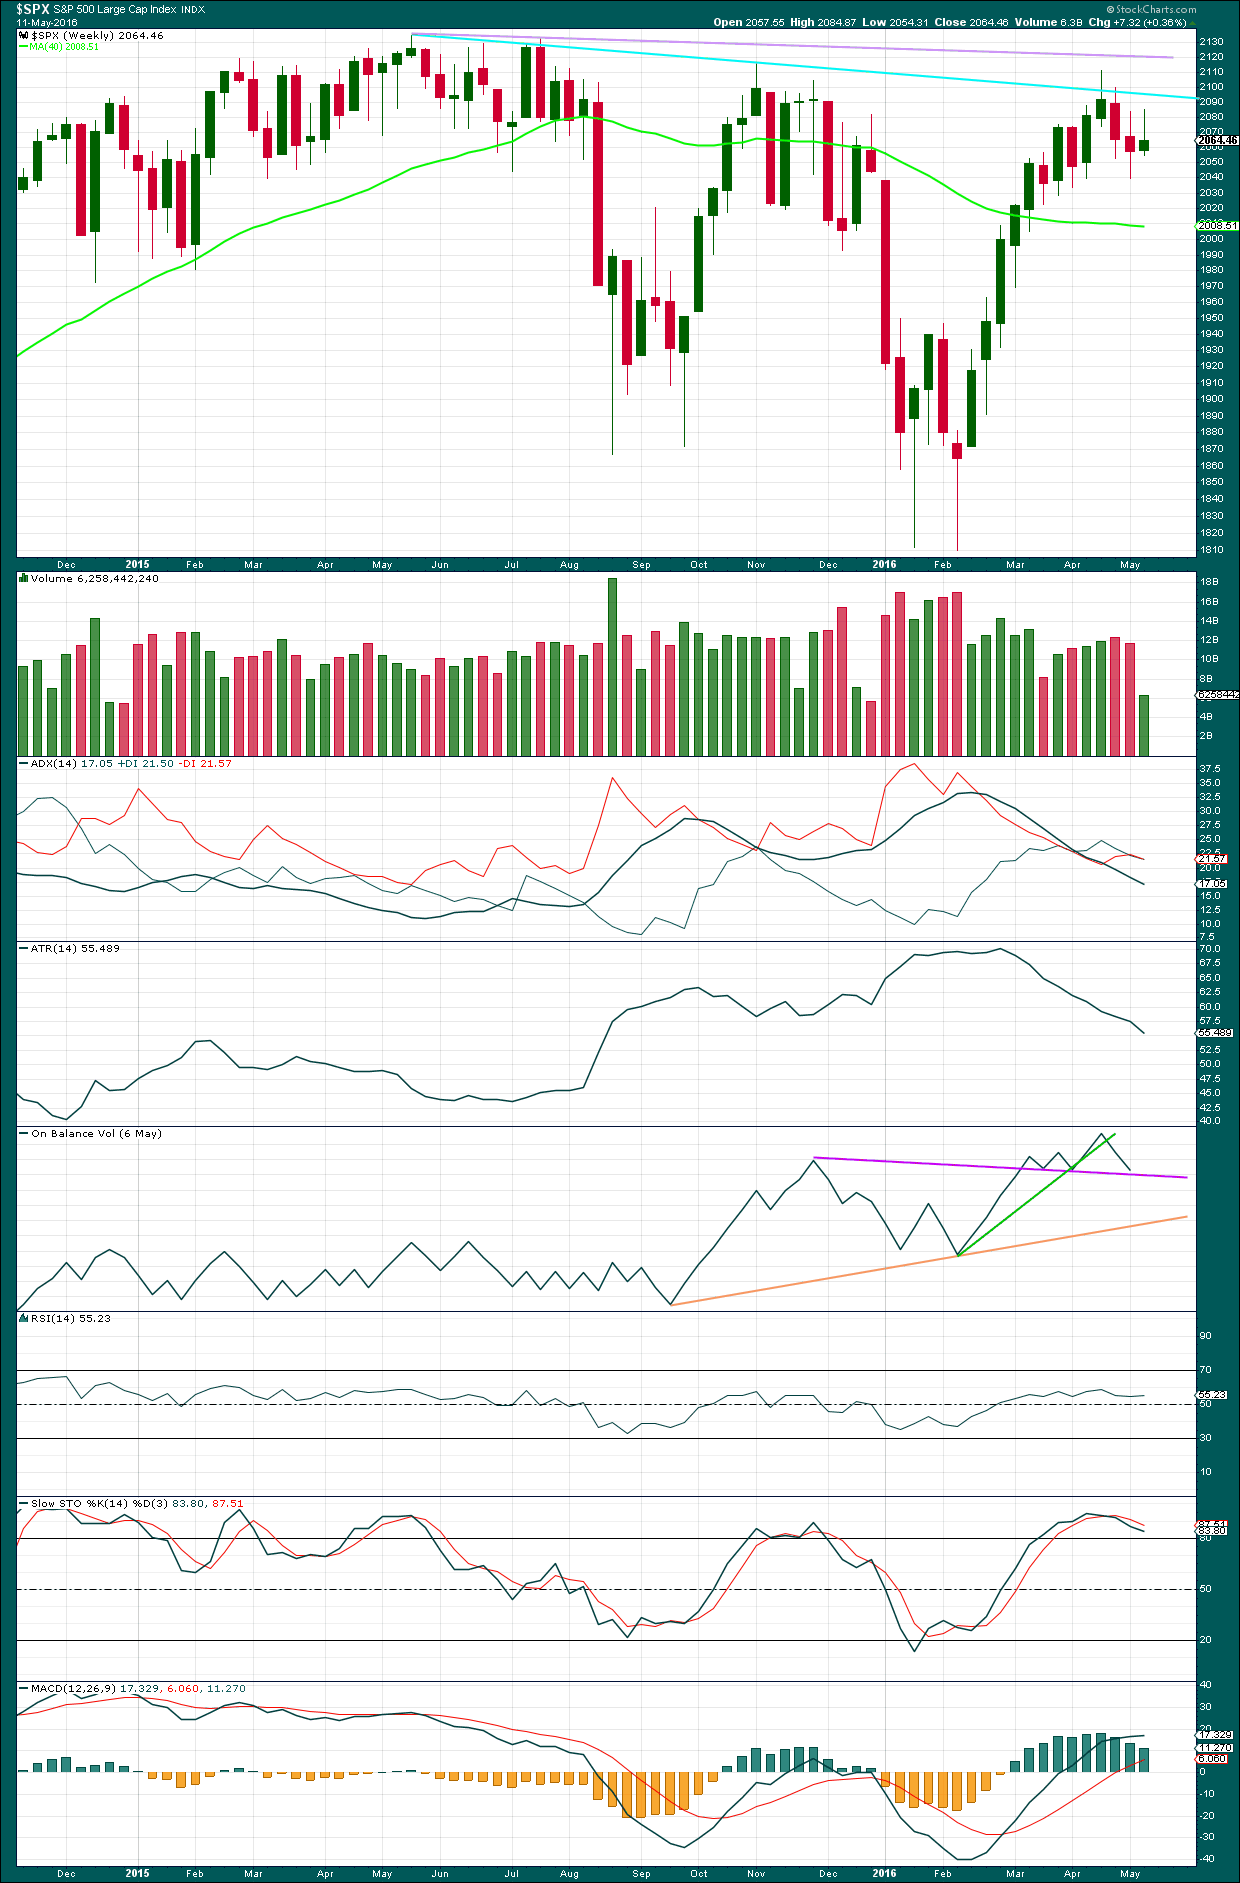
Click chart to enlarge. Chart courtesy of StockCharts.com.
There is a bearish engulfing candlestick pattern at the last high. This has occurred at the round number of 2,100 which increases the significance. Volume on the second candlestick is higher than volume on the first candlestick, which further increases the significance. That it is at the weekly chart level is further significance.
Engulfing patterns are the strongest reversal patterns.
Now this pattern is followed by another red weekly candlestick. The reversal implications of the pattern are confirmed.
This is a very strong bearish signal. It adds significant weight to the expectation of a trend change. It does not tell us how low the following movement must go, only that it is likely to be at least of a few weeks duration.
There is a weak bearish signal from On Balance Volume at the weekly chart level with a break below the green line. A stronger bearish signal would be a break below the purple line. At the end of last week, OBV has come down to almost touch the purple line. Some support may be expected about here, so this may prompt minor wave 2 to bounce higher. This slightly supports the first two hourly wave counts over the second. For the weekly OBV line to move up from here requires a longer lasting correction.
There is hidden bearish divergence between Stochastics and price at the last high and the high of November 2015. Stochastics has moved further into overbought territory, but this has failed to translate into a corresponding new high in price. Price is weak. MACD exhibits the same hidden bearish divergence.
After a period of declining ATR, it should be expected to turn and begin to increase.
DAILY CHART
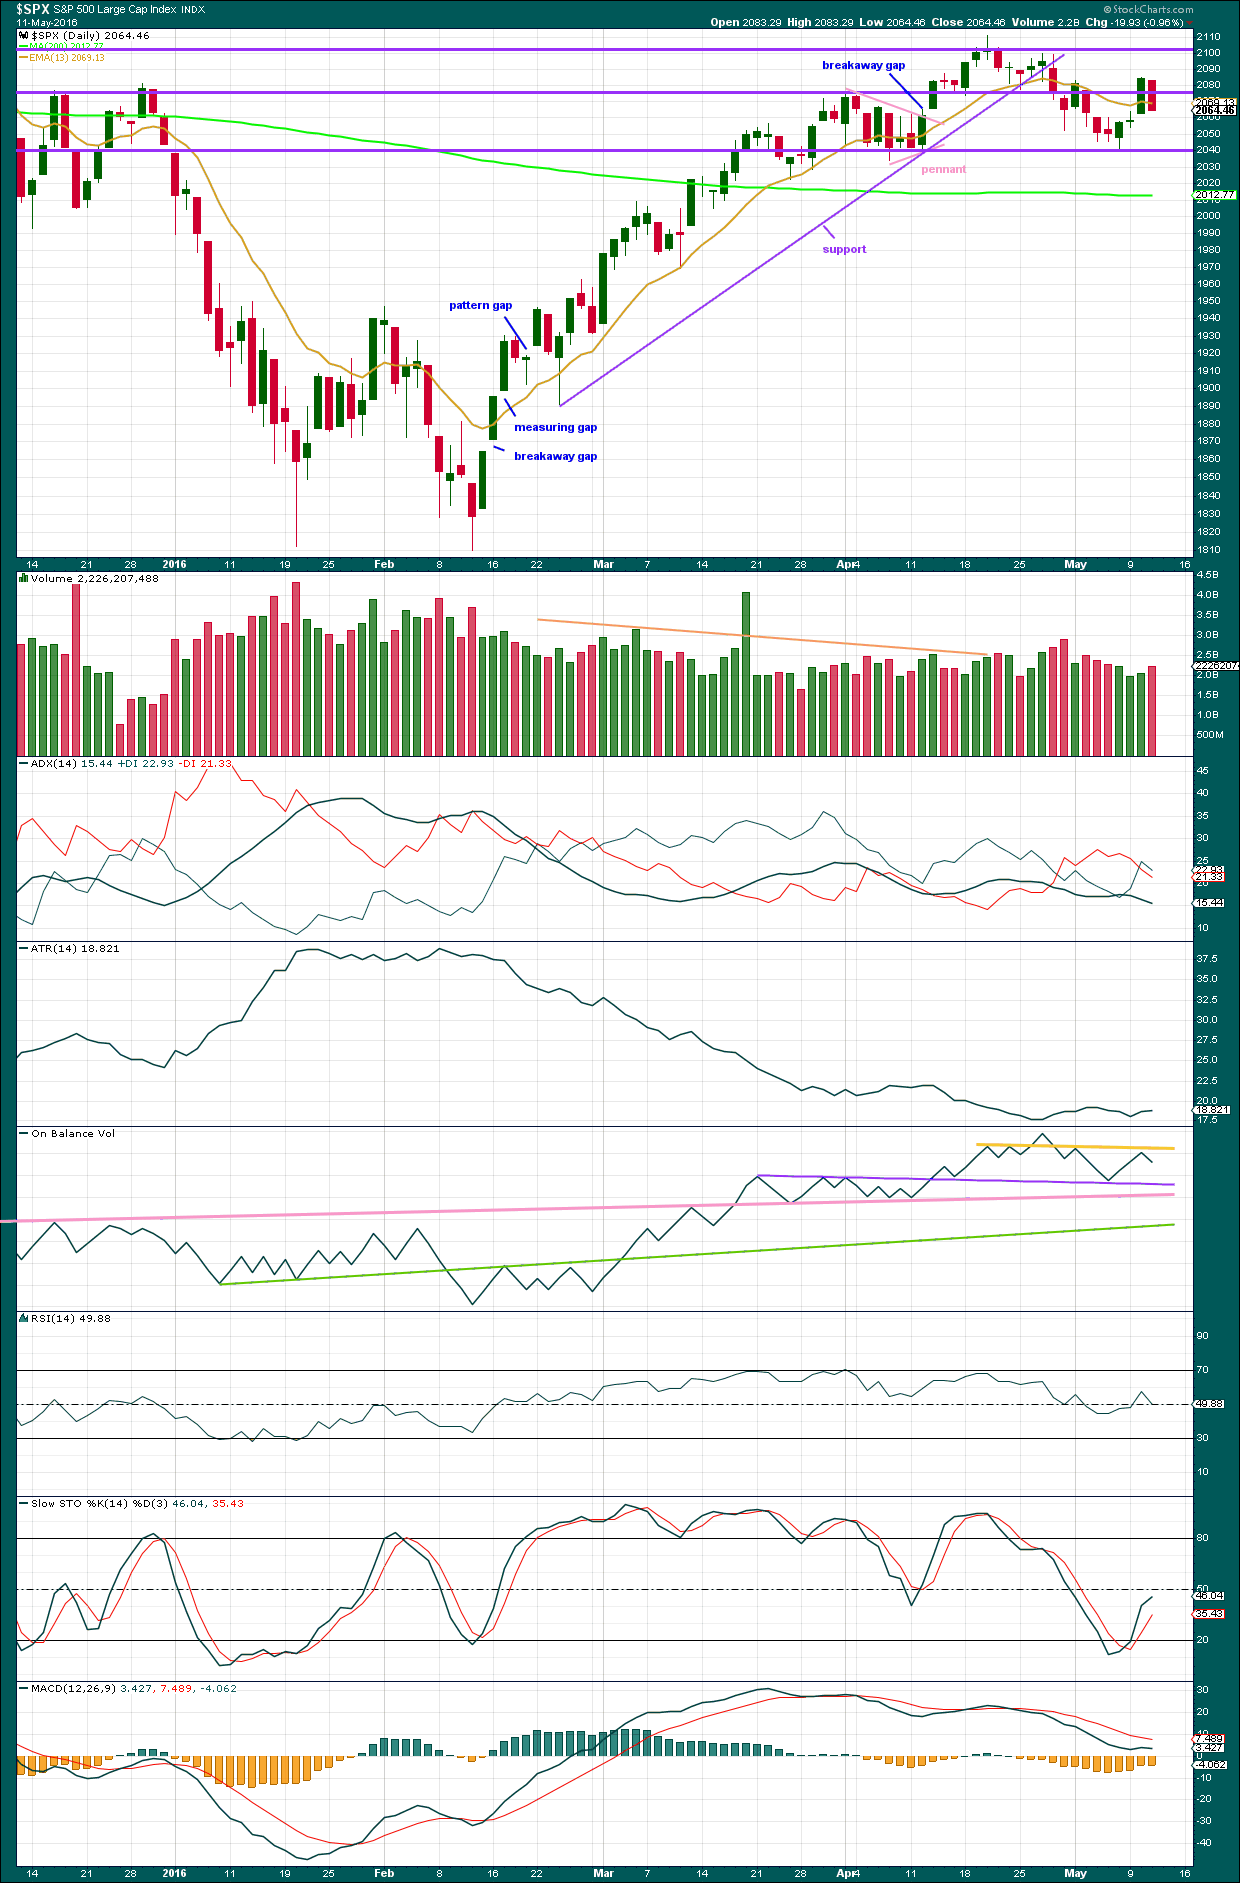
Click chart to enlarge. Chart courtesy of StockCharts.com.
Volume data on StockCharts is different to that given from NYSE, the home of this index. Comments on volume will be based on NYSE volume data when it differs from StockCharts.
As price rose for three days in a row, from the last low, it came with declining volume. Price today has fallen on increased volume, but the volume for today’s downwards day is lighter than the last five downwards days. In the short term, volume indicates that upwards movement is a small counter trend rally, and today’s downwards movement is strong but not yet strong enough to be seen as the resumption of a downwards trend.
Today technically may be seen as a bearish harami candlestick pattern, but the second body of the pattern is not small. It is within the body of the first pattern, but two things indicate that this potential reversal pattern does not have much strength. It has not come after a reasonable rise but only with a small counter trend rise of three days. The body of the second candlestick is only slightly smaller than the first. Overall, I would not give much weight to this pattern.
More weight should be given to the bullish engulfing pattern at the last low. However, this indicates a trend reversal but does not indicate how high following upwards movement should go.
ADX is still declining indicating that the market is not currently trending. This is a lagging indicator though as it is based on a 14 day average. During a consolidation, the +DX and -DX lines fluctuate about each other. Currently, an upwards trend would be indicated if the ADX line increases, but with the directional lines so close together this could change quickly.
ATR agrees with ADX as it is flat.
On Balance Volume has tested the yellow line and moved away. This supports the idea of upwards movement being over for now, but there are two problems with this view. It may support both the second and third hourly wave counts; the second could see more downwards movement for OBV to again test the purple line, then another wave up for OBV to again test the yellow line. The third hourly wave count could see OBV move lower here and slice through the purple line. Both outlooks are equally valid from OBV. The other problem is the yellow line is not very long held and has been breached before, so it could be breached again. It does not offer strong technical resistance.
A breach of any of the purple, pink or green lines by OBV would be a strong bearish signal. At that stage, a third wave down would be expected to be underway.
RSI is neutral. There is plenty of room for price to fall or rise.
Stochastics is close to neutral.
MACD is flattening off as would be expected during a counter trend movement.
VOLATILITY – INVERTED VIX DAILY CHART
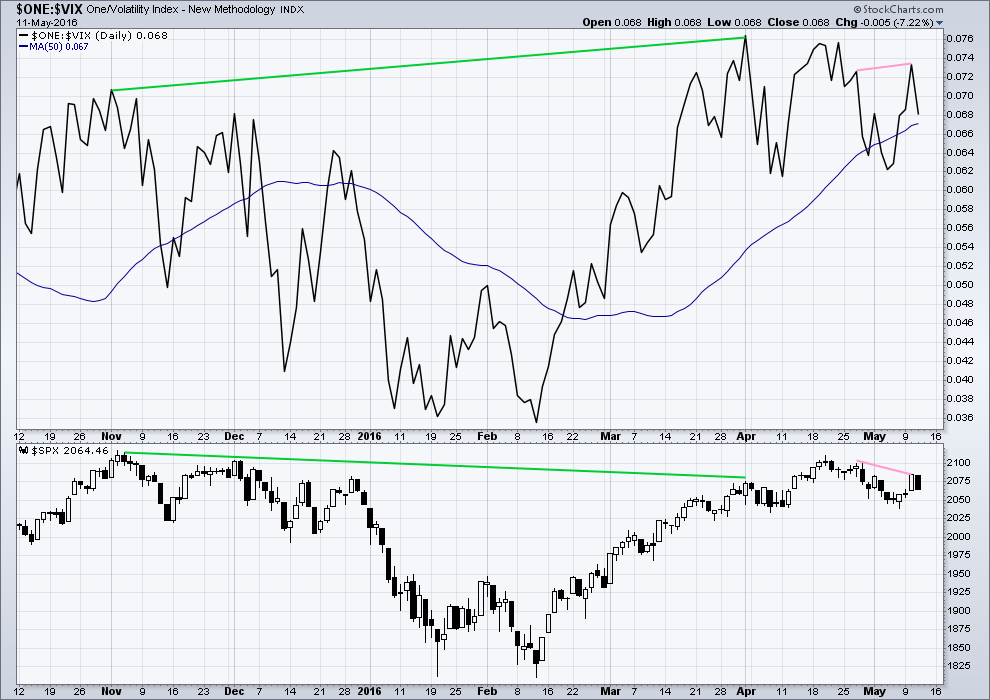
Click chart to enlarge. Chart courtesy of StockCharts.com.
Volatility declines as inverted VIX climbs. This is normal for an upwards trend.
What is not normal here is the divergence over a reasonable time period between price and inverted VIX (green lines). The decline in volatility is not translating to a corresponding increase in price. Price is weak. This divergence is bearish.
Inverted VIX yesterday made a new high above the prior swing high of 27th April, but price has failed to make a corresponding new high. This indicates that volatility declined to below the prior point on 27th April, but this decline in volatility has not translated into a corresponding increase in price. Price again is weak.
Upwards rallies continue to exhibit persistent weakness.
BREADTH – ADVANCE DECLINE LINE
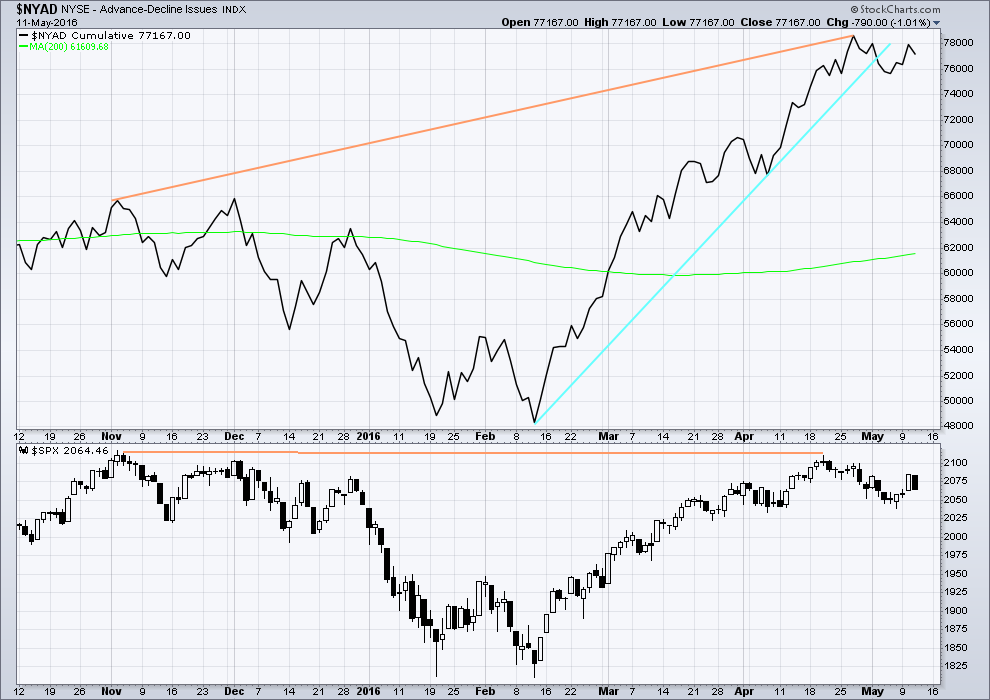
Click chart to enlarge. Chart courtesy of StockCharts.com.
With the AD line increasing, this indicates the number of advancing stocks exceeds the number of declining stocks. This indicates that there is breadth to this upwards movement.
From November 2015 to 20th April, the AD line made new highs while price far failed to make a corresponding new high. This indicates weakness in price; the increase in market breadth is unable to be translated to increase in price (orange lines).
The 200 day moving average for the AD line is now increasing. This alone is not enough to indicate a new bull market. During November 2015 the 200 day MA for the AD line turned upwards and yet price still made subsequent new lows.
The AD line is now declining and has breached a support line (cyan). There is breadth to downwards movement; more stocks are declining than advancing which supports the fall in price.
For three days in a row price increases while the AD line also increases. There is breadth to this upwards movement.
ANALYSIS OF LAST MAJOR BEAR MARKET OCTOBER 2007 – MARCH 2009
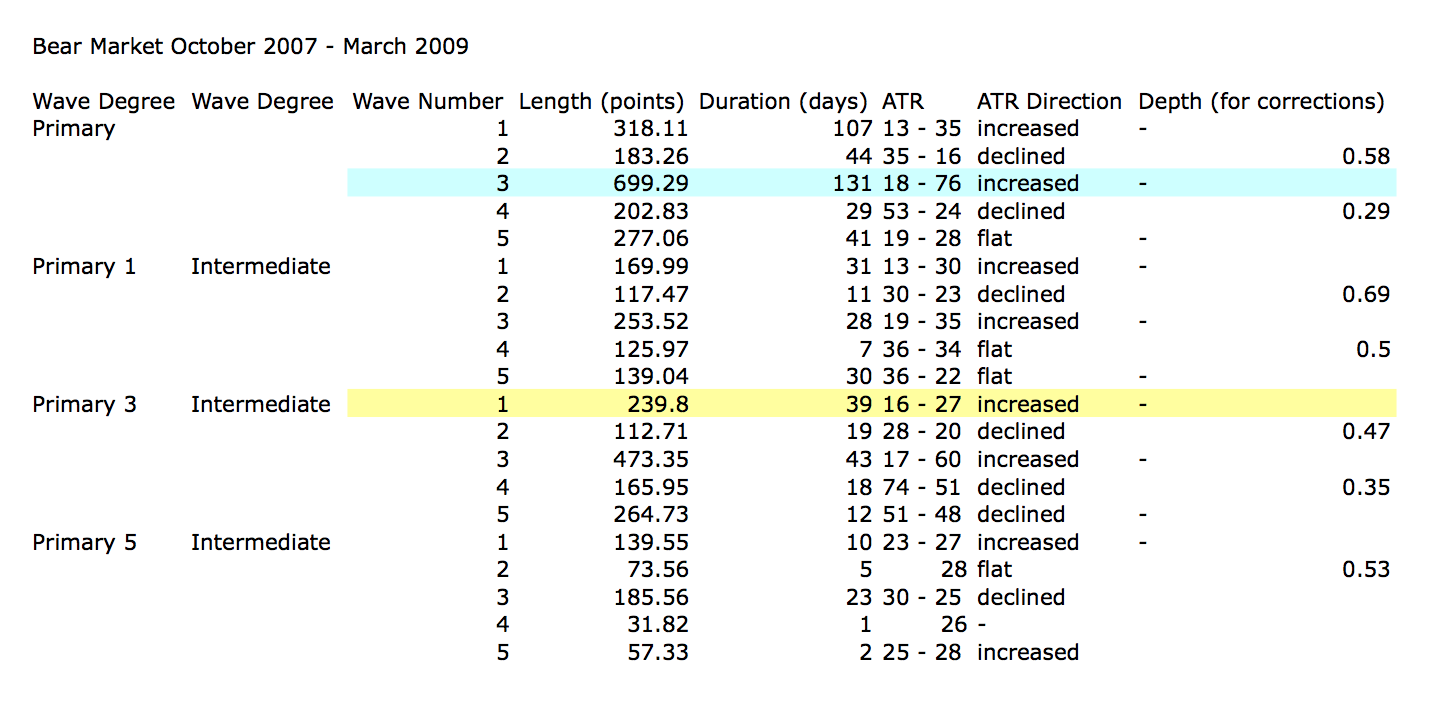
Click to enlarge.
In looking back to see how a primary degree third wave should behave in a bear market, the last example may be useful.
Currently, the start of primary wave 3 now may be underway for this current bear market. Currently, ATR sits about 19. With the last primary degree third wave (blue highlighted) having an ATR range of about 18 to 76, so far this one looks about right.
The current wave count sees price in an intermediate degree first wave within a primary degree third wave. The equivalent in the last bear market (yellow highlighted) lasted 39 days and had a range of ATR from 16 – 27.
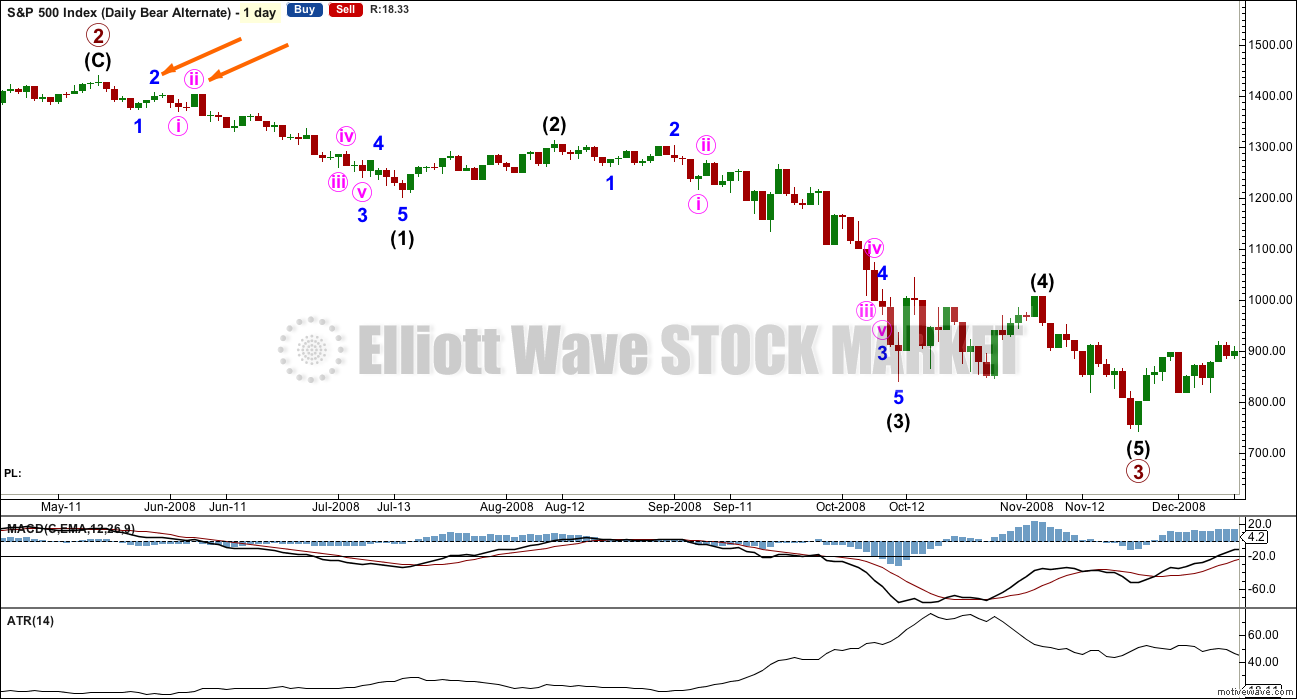
Click chart to enlarge.
This chart is shown on an arithmetic scale, so that the differences in daily range travelled from the start of primary wave 3 to the end of primary wave 3 is clear.
Primary wave 3 within the last bear market from October 2007 to March 2009 is shown here. It started out somewhat slowly with relatively small range days. I am confident of the labelling at primary degree, reasonably confident of labelling at intermediate degree, and uncertain of labelling at minor degree. It is the larger degrees with which we are concerned at this stage.
During intermediate wave (1), there were a fair few small daily doji and ATR only increased slowly. The strongest movements within primary wave 3 came at its end.
It appears that the S&P behaves somewhat like a commodity during its bear markets. That tendency should be considered again here.
Looking more closely at early corrections within primary wave 3 to see where we are, please note the two identified with orange arrows. Minor wave 1 lasted a Fibonacci 5 days and minor wave 2 was quick at only 2 days and shallow at only 0.495 the depth of minor wave 1.
Minute wave ii, the next second wave correction, was deeper. Minute wave i lasted 3 days and minute wave ii was quick at 2 days but deep at 0.94 the depth of minute wave i.
What this illustrates clearly is there is no certainty about second wave corrections. They do not have to be brief and shallow at this early stage; they can be deep.
This chart will be republished daily for reference. The current primary degree third wave which this analysis expects does not have to unfold in the same way, but it is likely that there may be similarities.
DOW THEORY
I am choosing to use the S&P500, Dow Industrials, Dow Transportation, Nasdaq and the Russell 2000 index. Major swing lows are noted below. So far the Industrials, Transportation and Russell 2000 have made new major swing lows. None of these indices have made new highs.
I am aware that this approach is extremely conservative. Original Dow Theory has already confirmed a major trend change as both the industrials and transportation indexes have made new major lows.
At this stage, if the S&P500 and Nasdaq also make new major swing lows, then my modified Dow Theory would confirm a major new bear market. At that stage, my only wave count would be the bear wave count.
The lows below are from October 2014. These lows were the last secondary correction within the primary trend which was the bull market from 2009.
These lows must be breached by a daily close below each point.
S&P500: 1,821.61
Nasdaq: 4,117.84
DJIA: 15,855.12 – close below on 25th August 2015.
DJT: 7,700.49 – close below on 24th August 2015.
Russell 2000: 1,343.51 – close below on 25th August 2015.
To the upside, DJIA has made a new major swing high above its prior major high of 3rd November, 2015, at 17,977.85. But DJT has so far failed to confirm because it has not yet made a new major swing high above its prior swing high of 20th November, 2015, at 8,358.20. Dow Theory has therefore not yet confirmed a new bull market. Neither the S&P500, Russell 2000 nor Nasdaq have made new major swing highs.
This analysis is published @ 10:09 p.m. EST.
I was going to weigh in about trading the Primary wave, and about how to scale entry etc, but I think member – vernecarty – pretty much summed up how we should look at things. If you haven’t read his post right below mine, please do, because its spot on.
If folk are making decisions based only on the expected EW count that can lead to some serious schizophrenia – there can sometimes be as many counts as there are analysts. There is a whole constellation of data and circumstances that should be informing our view of the most likely EW counts. The thing that instantly sold me on Lara’s approach to EW analysis was her unflinching objectivity, quite extraordinary really. It was immediately obvious to me that her preferred wave counts were based on the facts as they were, rather than as she wished them to be. Nothing blows up trading accounts like unchecked emotion. I have watched in amazement as some analysts insisted, and over a long period of time, of assigning motives and intentions to Mr. Market that he clearly wanted no part of, and I am talking about over years! In one particular instance these folk were so reliably wrong that I actually started making trades based on the exact opposite of what they were forecasting and made a lot of great trades with that particular approach- really! I know it sounds unbelievable but it is true. It took me a while but I finally wised up. Some of you know exactly what I’m talking about cause you’ve been there. Ninety per cent of this game is won or lost in the head imo…
Malcolm, you are right; there is a number of possibilities. And as the note from Lara below indicates, there are also limits to what EW can tell us. We are at one of those junctures where EW could go either way. But we don’t need to get frozen with analysis paralysis; all we need is to get the odds on our side a little. As far as I’m concerned that happens when we get a confirmed break below the neckline on that H&S that we’ve been watching. It turns out that there is a strong fib cluster right at the point where minuette v reversed higher, which also coincides with the neckline. If it penetrates that line, the chances are it means business, and I’m going to be short. As we get more confidence in the resumption downwards, I’ll be increasing my position.
To add also, if primary 3 is indeed in its early stages and members can stomach holding an underwater position for about a week (worst case scenario) then any entry point for shorts about here will in the mid / long term be a very good price.
What we are trying to do is get the best entry point. In doing so there is a risk we miss out on it by being too picky.
Personally, I don’t like the idea of an underwater position for too long. I don’t like that kind of risk.
That’s a personal preference though. In this case I think I need to get over myself.
I have been under water enough that I have once again been certified as a deep water diver. I originally was certified in the late 80’s or early 90’s. Kind of gave it up. But, I am now certified again.
Next I am going to learn how to hang glide as I jump over the cliff of the waterfall to come during Intermediate 3 of Primary 3.
Actually I was above water briefly but have been under since May 2nd. I don’t like it, of course. But it is part of the game. I am not too bothered by it because I think we have a good handle on where we are in the EW count as well as lots of supportive TA.
I know a thing or two about the deep. I did due diligence on a priceline trade earlier this year and decided that the price it was trading at represented people smoking some serious wisdom weed( as the Jamaicans say). I was careful to give myself enough time as you know the old saying about the market remaining irrational…those puts lost 60% of their value before they exploded to eventually return 500 %. Was it uncomfortable being underwater? Yep!
Did that change my view on the likely outcome of the trade? Nope!
If you are worried about a position going temporarily under water, either your position is too large, or you may be unsure about the reasoning behind the trade. Clearly we are often wrong; in fact most of us are wrong most of the time. That is why, with very rare exceptions, stops and/or hedges should always be in place.
Exactly Lara! – we don’t want to be in a position where we cannot see the wood for the trees 🙂
There are confirmations galore – for me personally I am trading based on more downside – if my position goes underwater I know the trend is my friend.
Mr Market is not going to make us feel comfortable whatever we do. He absolutely want us to feel we are doing the wrong thing.
I often feel more comfortable placing an uncomfortable trade – the cocky trades are the ones that work out badly imho.
Imho you are the best in the business – if it doesn’t work out it is not through lack of skill or negligence – we’ll brush ourselves off and fight another day.
Thank you very much Olga for the kind words 🙂
I have a cunning plan. It’s so cunning I could put a tail on it and call it a weasel. It’s so cunning I’m sure Mr Market will make me a fool.
I’ve put my shorts back on at 2,057.2. I’ve put my stop for now above yesterdays high at 2,084.87.
I’m fairly confident that tomorrow will make at least a short term new low below todays low. Once there is another five down on the hourly chart I’ll move my stop to just above todays low at 2,053.13.
Then I’ll be expecting a fourth wave correction if indeed we are in minor 3. It can’t move back into minute wave i price territory. So at that stage if it does then I’ll have a small profit, no loss, and can get a better entry.
I feel like Baldrick. And that’s probably not good.
I think that plan may be just a bit too Baldrick like. Not a good idea.
I think what is better and easier is to let this market have time and space to move. Leave my stop just above 2,111.05 and let the trend do its work.
As I look at Malcom’s chart there may be an issue as to the drawing of the bottom trend line of the triangle. It should not extend all the way back to the left shoulder. The triangle bottom trend line would begin at the point labeled 4. It is not a very long nor a tested trend line. Thus I think the idea of a descending triangle is null and void. It does not exist. We are left with a H&S waiting to break the neckline to confirm the pattern.
Furthermore, we must switch our minds / psychology from thinking like we are still in the six years plus bull market. In a bear market, which I have no doubt we are in, the surprises will be to the downside. Does that mean Minor 3 has started? No. It means we should not be surprised if it has started. I think Lara’s idea of a flat for Minor 2, will still play out. We will most likely see another high above 2084 before the start of Minor 3. The next couple of days will tell us which it is.
Be that as it may, we have overwhelming TA and EW telling us the Primary trend is down. Surprises will be to the downside. We best prepare.
Looking at this chart nobody seems to know what the plan is! We are left with a doji and some possible outcomes, the head and shoulders is one option, Could you also class this daily as a large triangle with a false breakout? i have seen someone with a 4 wave structure iv ending on 6th may.
If we get a higher C wave to finish minor 2 then bulls will see a breakout of triangle and i would assume volatility would be insane between the breakout and the long term bear trend line where the bears would step on the scene.
note your 2 goes lower than the beginning of your 1; trendline on top may need adjusting.
Yep I noticed that, not my wave count just one that I have seen, just trying to put some ideas out there! Personally I think we could go higher short term but I do think that could turn people bullish if they think it’s a triangle breakout, that in turn could flip sentiment from bearish to bullish which would be in our favour as currently it seems 87% of traders are bearish which is not too good.
I keep hearing about how bearish traders are, yet VIX is displaying a level of complacency in excess of that seen at the most recent market highs… am I missing something? 🙂
IDK
I feel like I’m missing something too.
Looking for a good sentiment indictor. I don’t want to use COT. I want to use put / call ratio.
From Kirkpatrick and Dhalquist: “the simplest most consistent method of calculating puts to calls is to calculate a ratio of the total volume of puts traded in a day versus the total volume of calls… For the stock market, the raw volume statistics as well as the ratio are available in Microsoft Excel format on the website of CBOE…”
My Excel skills are.. somewhat rudimentary. I had a quick squiz at CBOE’s website… this info wasn’t immediately apparent. I guess I’ll have to spend some time looking for it and working this out.
Probably a few hours 🙁
If any members have any links to a reliable sentiment ratio you’re using, of any kind really, but a put / call ratio which uses volume as part of the calculation, then please do share. It may save me some time.
Thank you.
Why are we talking ABC? Are you saying that this whole wave is a wave 4 and we have started a final leg of Primary 5 and therefore still in a bull trend?
It is my opinion we have been, are, and will be, in a corrective wave IV for a long time yet.
III top May of ’15
A down was Sept.’15 low
B up at Nov.’15 high
C down at Feb.’16 low
D up at April ’16 high (and maybe it tests top again or
even goes higher), and could be an X, or an “a” we
just don’t know yet
E down is coming next after D’s top is confirmed
F up
G down
THEN IV will be complete which will be 2017 and possibly into 2018 sometime. Noting there are many different corrective scenerios and we just don’t know yet. Maybe another zigzag, or flat, or it is going to be a huge three year triangle, or double 3’s and triple 3’s combined. You’ll see tons of news articles written over this time, which already is occuring, with a jumble of yo-yo words.
So IV is only about say 60% complete yet, then V up. So many Elliotts have IV overwith already it is scary. One even has the “A” Sept. ’15 bottom as the end of wave IV.
Nick, Peter is referring to my bull wave count. Which it is true, cycle IV could be incomplete and continuing sideways.
My bear wave count is my main count and that is much more bearish.
No Way… No How… this is the Bull wave count! IMO
The ups & downs are reminiscent of 1987 just before the event. We are in the third occurrence of this in 9 months…. Three times is a charm!
Peter, that doesn’t fit Elliott wave.
A-B-C-D-E (and if you continue with F-G-H-I) is a triangle (or nine wave triangle).
This structure fits neither an expanding nor contracting EW triangle.
There is a video on my education page about triangles. That will show you exactly why this won’t work for continuation of cycle IV.
What would work is a double flat or double combination, with the first flat complete and now X up complete. Moving into a second flat for a double flat, or zigzag or triangle for double combination. That fits EW rules.
A few analysts are contending that the wave four count remains viable until and unless the February lows are taken out…
IMO it remains viable even if Feb lows are taken out.
If cycle IV is a double flat or double combination, then the first structure is a flat and complete as I have it labelled on my weekly bull chart.
The double is now joined by a three in the opposite direction, the wave up I have labelled intermediate (1) on the daily bull chart may be either a complete zigzag or an incomplete zigzag still requiring a final C wave up.
The second structure in a double flat or double combination may make a new price extreme beyond the price extreme of the first structure, in other words below 1,810.10 as part of it.
More sideways movement for another one to two years.
This is essentially why my weekly bull count has the invalidation point still all the way down at 1,370.58.
Once we have more downwards movement then I’m going to have to publish this idea for the bull. For now I’ve got enough charts to publish for the much more likely bear.
I am stuck by indecision. When that happens I need to step back and take a breather.
I want to enter short again here in case minor 3 is underway. But I don’t really want to hold an underwater position for a week if minor 2 continues as an expanded flat.
There is now a five down and three up on the hourly chart off yesterdays lows. Normally that would trigger “enter here”.
But the flat correction for minor 2 to continue all looks entirely possible.
Ugh. I wish there was an easy way to tell which one it is.
B waves are just the worst. Most horrible of all. I count 23 possible structures, and that’s not counting all the different varieties within combinations (it counts combinations of zigzags, flats and triangles, but not the different kinds of flats and triangles within that). So the possibilities for B waves are enormous, and they tend to be fakes fooling everyone. I’ve been fooled by them so many times. I am very wary of them.
The only way to confirm minor 3 is over is to the downside. I want upside confirmation. But I’m not gonna get it. I have to make a decision.
Time for coffee and thinking.
If it helps in your decision process, tomorrow is Friday the 13th. I would like to sit tomorrow out but I got caught holding some shorts I opened this morning
I suspect if we are indeed in minor three down, futures will make it abundantly clear; hopefully not before you can a wagon or two filled… 🙂
If minor 2 is a flat then price heads lower.
If minor 2 is complete then price heads lower.
This looks like a good spot to put your shorts back on! 🙂
LOL
Yes, I think I’ll be putting my shorts back on 🙂
Even though it’s Autumn here in NZ and a bit cool
https://northmantrader.files.wordpress.com/2014/04/opex18.png
FWIW monthly opex is around the corner.
Are wave counts of other indexes the same? Maybe Nasdaq count if more clear, it has been leading… or maybe the count for the all world index.
It sounds like the best thing to do is SOH for a while. But the risk is missing the big move.
Other thing for option traders is to buy options 6 months out
Mostly they are, they’d all see a five down and a three up either complete or halfway through.
DJT today was strongly lower.
But the problem with that is B waves of expanded flats can make new price extremes and expanded flats are very common structures.
I’ve noticed that DJT seems to be a leader (often, not always). It may be leading down here for the next wave.
Lara – count of C wave down chart shown. Daily SPX.
Yeah, that looks better than my solution actually.
My concern there is intermediate (3) has a three wave look to it. Normally at that large degree even the S&P can conjure up an impulse that looks like a five.
Go to a 4 hour chart and it becomes clearer that it is a fairly clean 5-wave C down.
I have a 1, 2 or 6 hour option on Motive Wave.
I can see a solution on the 6 hour, yes.
I still don’t like the three wave look that intermediate (3) has on the daily chart. That is the crux of my dislike of that wave count at that time frame.
Buying back UVXY covered calls for modest gain…
Looking to me like a 3,3,5 for a second wave, UVXY acting frisky…
Judging by the way UVXY has been acting on second waves, I would not be at all surprised to see yet another descent below 13.00; hopefully not too far below… 🙂
I think we end at the day’s high, futures down big…
This move up is almost done imho – could be wrong but don’t think we’re going below 13.
Below 2065.83 might be first clue it’s over
Yeah. With further upwards movement in the offing it usually goes straight for the basement without looking back; it’s acting kinda restless…
I got a few SPY 206.50 calls as hedges that I am not too keen on holding onto overnight… 🙂
Sometimes when comments mix and match different indices or equities etc., they can become confusing. When you speak of this move up being almost done are you referring to SPX or UVXY?
Sorry – S&P – I usually mean that as I’m trading based upon it’s price.
It made more sense when I typed it as the market was still going upwards.
But Verne was then talking about UVXY going up in the next comment – so I can see the confusion!!
C’mon…. keep up Rodney! 😉 🙂 🙂
I am doing my best. Still feel like I am on a game show.
I have been dealing all day with tracking down a reliable status an order for my expedition in July. It is like playing “Whose on first?” I am back and forth from the phone to the screen and then from one screen to another. For a while, I forgot who I was. Where is the doc when you need him?
I am going home before I get lost.
i think FTSE is still in minute i behind the S&P
Thanks Nick.
I have to switch Motive Wave workspaces for FTSE. It’s such a hassle.
That means that minor 2 was only 4 days duration and ended at the 0.382 Fibonacci ratio of minor wave 1. That’s my problem. It looks too brief and shallow.
But to be fair, it does have a nice three wave look to it.
On the possibility that minor 2 is over and minor 3 down has begun:
Entirely possible. There is just absolutely no way to be certain of it unfortunately. Which is so frustrating I know.
So I’ll look to classic TA to figure out the probability.
Interestingly so far price is printing a doji and VIX (inverted) has climbed. Which means that although price moved lower today volatility has declined. However, this data is changing as the session continues. When it it finalised I’ll be using that as one piece of the puzzle.
When I look at momentum I wouldn’t expect it to quite yet be stronger than the end of minor 1, because price is higher. So that’s okay so far for this idea.
The subdivisions all fit. Minor 2 was close to the 0.618 ratio. Minute ii is now deeper than the 0.382 ratio. So far it all looks okay.
Really, it is FTSE which is bothering me the most with this idea. FTSE looks like its correction is not deep enough yet by quite a lot.
SPX Hourly with volume profile. Price pays but I want to point out that the hourly volume on the 10 point upmove off the lows was the lowest hourly volume bar in weeks
That’s good to know – it gives even less weight to a double zig zag playing out.
and possibly more weight to seeing minor wave 3 underway….
At this stage the flat looks like the best possibility if minor 2 is continuing.
So far there is a nice looking five down on the hourly chart. That’s what it looks like. That’s how I want to label it. It fits on the five minute chart too.
So I’m adding some numbers to watch out for on the hourly chart for the flat possibility.
Minute b must meet a minimum 0.9 length of minute a at 2,043.77.
Expanded flats are the most common type of flat correction (and the one most likely to take C back up to the bear market trend line). They require minute b to be minimum 1.05 the length of minute a at 2,037.18.
The common range is the same; 1 to 1.38 the length of minute a at 2,039.45 – 2,022.19.
I’ll chart a combination separately now. Pulling each idea into a separate chart at this stage adds clarity IMO.
Would also throw the most folk off balance (again!) with a strong move down tomorrow, followed by a quick reversal up to complete minute C up. Interesting question is whether it completes tomorrow- huge implications for going into the week-end…
I think that we are in a 1,2,1,2 and just started subminuette iii in minute 3.
That is possible, but I don’t think the proportions look very good for this current possible second wave correction anymore. It is deeper and more time consuming than the first two corrections.
As what others have said looks like ABC up. We made a perfect inverse right shoulder today too!
SPX weekly chart with clearer colors for labeling….comments in a post further below. In order: III, A, B, C, D or X.
Peter, have you figured out how to see C down subdivide as a five?
I am genuinely intensely curious.
I know a few Ellioticians have this wave count. I haven’t been able to solve that piece of the puzzle. There may be something I’m missing.
Laura – the only thing I could offer you is a marriage proposal.
You’ll need to get the name right first! 😉 🙂
LOL
And you’d have to get that one past Cesar. Who I don’t think would approve.
I’ve a got a feeling that this may be playing out – if so then the Double Zigzag is alive and well.
Would explain why the impulse went well below the usual channel. That move down from the spike high today I had labelled as a 4th wave I think was an X wave – the move down from X counts nicely as a double zig zag. Hence why there was no alternation!!! Will I ever learn????!!!
EDIT: Ah – I see the boss is around 🙂 – Morning Lara – we need some guidance (as usual) 🙂 🙂
My first thought was to discard the double zigzag idea due two reasons:
1. The X wave is now very deep, normally they’re quick and shallow.
2. On the hourly chart this downwards movement so far looks like a complete impulse.
But you’re right. It is technically valid. I think I will relegate it to an alternate.
Yeah – I scrapped it for the same reason (not quick or shallow) earlier today. The lack of alternation got me suspicious (for a complete impulse) but I realise sometimes that happens.
Yes indeed it does. Remember intermediate (B) down. Zero alternation. All the corrections were zigzags.
That was another piece of the puzzle (Verne’s consistent doubts a big piece) which should have alerted me earlier to the possibility of a B wave.
That’s the problem with alternation. Its’ a guideline not a rule. It’s wishy washy.
Good morning everyone 🙂
Aahhh! So happy to see you!!! 🙂
♫ so happy togetheeeeerrr ♫
Here we go. C up, or two?
If it is a two correction for the move down from 2085 to 2053, the 61.8% retrace is roughly 2073. Above that the probability of Minor 3 having started reduces.
With respect, an alternative count on the SPX weekly. My argument is IV is long from over yet. We did an A-B-C from the May 2015 high and now label the April high as an D, or X, or “a” (not a concern, at least to me, what it is called yet). Where we will have yet an E down, F up, G down, if you will. It appears it will all be very complex. First part done already could be a large zigzag A ending in Jan. 2016, and then we are in the beginning of a large flat. So the up-into-April 2016 high could be “a” with “b” down next then “c” up into B. Whatever it turns out to be – with a 1/2 dozen complex counts possible – we should still have 1 more large down, 1 more large up, another down, then IV will be complete. Taking well into 2017. Then V up. Just an observation.
There are some analysts who agree with you! 🙂
Bottom line is IV is long from over yet, in my opinion. Fourth waves always take longer than anyone wants them to. Exception is if there is a quick “year 1987” plunge to make the price correction/relief in a short period of time, but that has not taken place so far.
My old friends at the trading group Bottarelli Research still occasionally send me interesting trading set-ups they are watching. They have identified Simon Property Group as the next likely victim of the decimation taking place in retail. One quick look at the chart and you can see why! I wish they had alerted me two days ago! 🙂
If we take out UVXY 15.00 today, the shorts WILL cover, and I will assume minor three down has arrived…
I was hoping for a $15.50 on UVXY today…please do your magic so we can light some fire under the UVXY shorts…
We need a bigger bounce imho – I think we’re still in sub-min (a) of minuette (b) up of minute (b) down.
Minute C up won’t appear until minuette (c) down of minute (b) down is complete – prob quite a bit lower than here (possibly tomorrow)?
Sounds like based on the time taken up for the current waves, we would need at least two more days to complete minor two… a bit of a slow start for minor three down….
This move up looks like a three. If it is a second wave all you know what could be about to break loose…I would have expected a C up to be much more vigorous….maybe it’s playing possum?
Just wanted to inquire of the membership here about other recommended trading resources for the FTSE.
Clearly we are all fans of Lara’s daily S&P analysis (and the other bonus instruments are equally great) however i am curious if there is anyone else here that regularly trades the FTSE has come across any site or resources that they would recommend?
I’m trading it via CFD’s with a New Zealand broker, CMC.
That’s probably not what most members here would want though, CFD’s.
Was that a completed expanded flat…on the 5 minute SP chart?
On the topic of symmetry and cycles:
From the start of the August 2015 crash / sell off, it was 92 trading days to the start of the January 2016 crash / sell off. From that January date add 92 trading days and you arrive at yesterday’s high.
Olga – how do i change the background color on the IB platform? As noted i’ve only had it now for about a week and there are enough buttons and tabs to make a spaceship look plain. Thank you in advance,
On main trading window (not a chart)
File -> Global Configuration
Left hand side panel click the + next to ‘Charts’ to expand it
Select Chart Colours (seems you can change every colour imaginable there!!)
You are right – there are far too many button / options.
Glass cockpit avionics are simpler than IB’s trading platform.
PS – you might want to save your current setting using File -> Save Settings As so you can start again – just in case you end up with your charts looking like Barbie uses them for trading 🙂
I want one! 🙂
I know. I am going to switch to IB soon. But I am trying to wait till I learn a bit more with their charting and trading platforms. Life does not always give me enough time to to do everything and still have play time.
BTW Olga going against the time clock often feels like a ‘game show’. lol
Vern your asked where is everybody. Olga mentioned ‘proper’ jobs. I do not know if my job is proper or improper but I do have a job so to speak. But I still don’t like being tied to the screen. So I have been in and out this morning and watching.
I don’t like trading second waves especially lower degree including Minor 2’s. I detest b waves even more.
I am in for the long ride and yes, it has been bumpy to say the least. I have wagons and they do not have great shocks!
How is the IB platform?
I’d like to switch to IB but TOS is like a comfortable old shoe at this point. Learning a new platform seems like as much fun as dental work 🙂
IB is great, just working through the learning curve. Tons of options, studies, configurations possible. Fills are great so far, low commissions.
Low commissions, very low margin cost and the ability to use algorithmic trading. Not to mention the international market and currency reach it has. I’ll switch one of these days 🙂
Seems ok to me, albeit I’ve never known anything different.
There are far too many options to tweak different things, but it works straight out of the box.
My biggest issue is with trendlines moving and labels getting messed up when you change timeframes, but I imagine the charting on most platforms is not that amazing.
If you live in 2 different countries / need to exchange FOREX, IB cannot be beaten imho. But for large amounts of low value shares, fixed price brokers might be alot cheaper (IB is $1 per 200 shares – but they also have another per share price structure which I think is cheaper for larger volumes).
I’ve been with IB for over 10 years
Southward Ho! 🙂
BBBY is the poster child for the beleaguered retail sector. It recently broke down big time and today is clawing its way back from another sell-off. At 44 it is telling short sellers to “Come and get me!” 🙂
For a little variety – a corrective wave 4 horizontal (appears to be descending type) triangle is developing on the daily chart of the Mexican Bolsa. Should provide a good long position when it completes, then a good short position when wave 5 ends. A very good view of this happens to be on the Yahoo Finance chart. For some platforms it is IPC (futures), otherwise check MXX.
Textbook behaviour for UVXY during third and fifth wave completions. I was starting to feel like a spurned lover, with its coyness of late…. 🙂
Here’s hoping C up will be short and sweet. Get the scimitars ready…we will be serving bankster scalps shortly…he! he!
That scalp to the upside is actually now looking much more attractive…naaaaaah! 🙂
O.K. Final wave down of current impulse underway. What happens next will spell volumes for the immediate future of Mr. Market…
Hi Olga, any numbers on what length (% of A) a possible B is so far?
If UVXY goes below 14.29 we are looking at either a C up or a corrective second wave I think…
Has only retraced about 70% so far. Needs to retrace at least 90% for a flat.
But has to be a three wave structure so we’re still missing a B & C wave to complete this possible Minute B wave down.
Div on UVXY on that last pop lower – I think wave B up should be along fairly soon.
Not sure if that’s exactly what you were asking?
Exactly. I was thinking it was not quite long enough to be done if it were a B of a flat…thanks!
UVXY divergence noted…back up the truck people!! 🙂 🙂 🙂
That small move lower just went below the (b) wave of the move up from 2039 @ 2054.32 – so it’s now not a matter of if we’ll go below 2039, but when.
Also gives us a confirmed 5 down 3 up at Minor degree. The trend is most def down imho (we already knew that but more confirmation is always nice).
Are you saying we’re already in minor 3?
No – It is not currently possible (for me!) to know for sure that Minor 2 is over. I’m saying that Minor 2 is confirmed (confirmed 3 waves) – but that might have only been Wave A of an ABC with us in Wave B right now.
Ordinarily it would be one of the highest probability confirmation points you wait for to short the heck out of the market with a stop at the Minor 2 high.
Imho, it means there is a very high probability that Minor 3 is either beginning now (less probable) or here soon (more probable due to the lack of time Minor 2 has been in progress to date).
As always, my comments are based on a very small timeframe (often 1min chart), so should not be acted upon unless you understand and agree with what I am seeing 🙂
Gotcha and for minor 2 we’re looking for a double zigzag or expanded flat yeah? (Sorry really new to this:))
With this move down today being a 5 wave move, the double zz is reduced in probability imo (as it required a 3 wave X wave down) so the likely options now are a flat, expanded flat (or Minor 3 has already started).
This current wave down is probably a B wave – so it can morph into lots of different structures (I think Lara counted 23 total) – B waves are a nightmare to both analyse and trade.
I suspect it will be an expanded flat with a super scary final c wave up which reaches above 2085, but whatever it happens to be, any short should come into profit – it is just a matter of how much time you want your position to be underwater and how good you want to get your entry.
Mr Market will not make it an easy ride for anyone.
“Mr Market will not make it an easy ride for anyone.”
You don’t say…!!!!! 🙂
Cool thanks so much!
Taking a bit of a defensive move against possibility of a C wave up with covered calls expiring next week against half my UVXY long position. Insurance well worth buying back if a minor three down is confirmed….should also cushion a possible minute two up…
Black Friday the 13th anyone?? Or red, if you will 🙂
Well! well! well! Now that you mention it… 🙂
Looks like we have a complete impulse down…or almost…
One more low I think to complete impulse…
I am deeply relieved that the bears have decided that there will be no more wrangling around round number pivots, not today….thank you very much…deeply relieved!!
UVXY short sellers at 15.00 should be breaking out a cold sweat just about now…
This move down has gone quite far below the usual impulse channel – I’m wondering if we are seeing a series of 1,2’s.
Might still be an expanded flat so a B wave that’s quite deep (below 2039).
Below 2054 the move up from 2039 is proven corrective beyond doubt but was it all of Minor 2 or just Wave A????
That is definitely still a possibility, and what I originally expected would happen. I started to have second thoughts as volatility kept heading North. We should start to see some divergence for a B wave correction I would wager…
If that plays out then the (c) wave up will probably be a very swift impulse to scare the living daylights out of the bears (and hopefully reduce Peter’s bearish percentage a fair bit).
Would make life very difficult for both bulls and bears.
Yep! Yep! Yep! Just like sneaky old Mr. Market… 🙂
Chart as I see the Flat option atm (zig zag has reduced in prob now we have 5 down imho as the X would need another B&C wave making it neither short nor swift).
There is now alternation between W2 & W4 so they might be 1,2 (Minor 3 now!)
EDIT: There is *no* alternation between W2 and W4 in the impulse down from 2084.65, so we might have a series of 1,2s (i.e. the start of Minor 3).
I should stop trying to beat that little edit timer. Like being on a game show 🙂
I hear ya on that one. lol
Ya think??! 🙂
So glad I held onto my “scalp” this morning! Lying futures notwithstadning… lol
Oops! I guess that was just the end of the third down….sheepish! sheepish! 🙂
UVXY looking a bit frisky ain’t it? Does it know something we don’t?! 🙂
We have a new low, tiny though it may be…now up we go for a neat little bull trap… UVXY will take out this morning’s low at 13.51 no doubt… 🙂
If we get a confirmed 3 up now (Minuette (b) of Minute (b) of Minor 2) then I’ll be all over it.
If we are tracing out an expanded flat for Minor 2 then this 5 down could be Wave A of an ABC zig zag for Minute (b) of Minor 2.
We’ve just gone below Minuette (a) of Minute (a) of Minor 2 so this wave down cannot be a 4th wave meaning the wave up from 2039 is unlikely to an impulse.
If this is an expanded flat then price must retrace at least 90% of the move up from 2039.
Spreads on UVXY starting to get laughable but I will try and scalp minute two up with an intra-day sale of calls against my long position if I can get filled at a reasonable bid…probably hardly worth the effort…really no need to get antsy now is there? 🙂
No new low so that must be 1,2 of minuette five down; I doubt we are seeing a truncation…if right, a strong small degree third down on deck…
Or maybe W2 of Minuette (a) of Minute (Y)??
New low below yesterday invalidates that.
EDIT: Invalidated!! – This is getting interesting!
We have 5 down from yesterdays highs now.
Where’s everybody? 🙂
Oh, I just saw Ris is alive and well…! and Olga too!
Everyone else has proper jobs 😉 🙂
I’m surprised I don’t need to wear glasses the amount of time I waste glaring at my laptop (was always warned about sitting too close to the TV when I was a kid!).
Hopefully Mr Market will make me feel more productive today.
i’m here…watching the current very bearish candle on SPX
We should quickly close the gap from yesterday’s close at 2064.46 and proceed swiftly to a new low in a final wave down I think…
Another small degree fourth?
Heads up from NDX?!
If this is minute five down, UVXY should head back up to around the fourteen area before heading back down below 13 for minute two up.
Yup 🙂
Yep! Looking very much like a fourth wave triangle, typically a penultimate formation. If that is correct, we make a new low then a ramp up in minute two….
The percentage of traders short number today is 82%.
Noting my source is a good friend who owns a top 20 brokerage in the USA. They scan the positions each night of all accounts and note the longs versus the shorts.
Interesting. VIX saying there is very little fear in this market.
VIX is calculated in a very complicated way, it gets thrown off too by the options changing, expiring, switching to new months etc.. The number I receive is just straight forward how many long, how many short updated every night. It has been very useful.
Hi Peter – do you go by the name of ‘Golden Nugget’ on some forums?
I used to converse with a very nice chap by that name who was very knowledgeable about long term wave patterns, had been watching / trading the market for decades & had quite a few friends in brokerages etc (from his days trading metals I think) – just wondering if it is the same person. He did almost all his charting on paper (so couldn’t easily post charts online!)
I think he also had something to do with horses! 🙂
No I am not. This is the first forum I have ever wrote on, save for a few comments here and there on news’ sites. I admire Laura’s work and maybe I can still learn a few things from her and others posting.
Well you certainly picked a good forum to start imho – you are very welome 🙂
Peter, thank you very much for sharing that with us.
I’m struggling to find a good source for sentiment ATM.
FWIW – Cycle analysis – no real surprises here. A few more days up.
I think we have to respect the possibility of a minuette fourth wave of minute one down this morning….
Yes, interesting start to the day. That’s why “FWIW” 🙂
I had a fleeting thought (about one nano-second!) of scalping the upside move in SPX at the open and then took a look at what UVXY has been doing pre-market…it’s telling me I am the one more likely to get scalped if I attempt it! 🙂
UVXY not showing too much pre-market selling pressure. If it spikes down shortly after the open it will almost certainly be some gun-slinging short seller just pleading with you to take him to the cleaners!
Look for another hammer at the bottom as traders step in… 🙂
Futures strongly hinting that we will get our wave Y up today. The eager beaver banksters will be offering the best possible scenario for a high confidence short entry. I will be deploying remaining dry powder on a move above 2090 with a mental stop to exit in the event of a close above 2100.00
Vern,
Looks like MaClellan folks are looking for a bottom between 17-19 next week, I suspect that they are under estimating the power of downward moves. They under estimated the moves back in Feb with expect to the intensity and drop. We shall see how this plays out…
Overall, I am dumbfounded as to who and why would they would buy this market given all the fundamentals. Additionally, folks that have profits sitting on the long side are taking too much risk trying to milk the last 0.5% and may end up losing it all…time will tell.
Here is another interesting article
http://www.marketwatch.com/story/something-dangerous-is-lurking-below-the-markets-surface-2016-05-12
I hear ya Ris. I remember that thousand point drop we had in the DJI last August and just cannot stop thinking that “Something wicked this way comes.”
The banksters spent a fortune the last week to get us where we are. I also get the distinct impression that selling pressure has been muted. I have yet to find a single additional analyst who is expecting a primary degree decline. I cannot entirely blame them as most of them have been really beaten up by the banksters the last few years on all their bearish prognostications, as the market charged ever higher against all reasonable expectations. I have been absolutely dumbfounded by the sentiment switch over at EWI as they are now calling for all time highs! Talk about contrary indicators!!
The winds of change are blowing nonetheless for those paying attention.
Lara gave the heads up months ago with some critical trend line breaks, and since then the drip, drip of negative economic news continues – anaemic GDP, declining job numbers, increasing lay-off announcements, and most recently the implosion of the retail sector. Why are folk still bullish…? I have no idea!!
Oh…I know….Its gotta be confidence in the banksters!
Speaking of which, that clown Carney is now threatening the UK with recession if they leave the Eurozone….I guess they have already forgotten how he blew up the Canadian banking system before he got recycled into the UK 🙁
Vern,
I am from Canada and we are seeing some of the unreal real estate market bubble… what doesn’t get reporting in the main stream is that resale are significantly weak unless price is way below the market. Someone had a house for sale at $850k and finally sold for $725k after waiting for about 6 months. I know a large number of people who are carrying multiple houses based on the rental situation. Drop in economy will start to hit rental situation and the house of cards will come tumbling down hard and strong..IMHO
The higher they rise, the harder they fall… 🙂
Lara’s excellent employee count also on British index. Good night N/Z from Israel!
testing to see if this chart will upload.. thanks
Lara- Thank you for putting together such a detailed analysis tonight. I thoroughly enjoyed it.
You’re welcome 🙂
The revisit of the action during the last bear market is most insightful so thanks so much for the work you put into making that information available.
I suspect we will get the flat as it will bamboozle the most folk! 🙂
During times of uncertainty about which of several possible wave counts is unfolding, a look at proxies may give some indication of what is likely to happen. I will be closely watching Transports and Russell tomorrow to see what, if anything, may be gleaned.
Ditto on the help your work brings to us.
I was thinking today, t here is no similar SPX analysis and member’s only blog I know of where 1) The senior analyst / owner keeps improving and adding value and 2) There is a plethora of good, insightful, expert, and experienced intraday commentary by members. We have the best staff in the world not too mention Lara. I am deeply grateful for there is no where else I can go, for any amount of money, and have access to the expertise and wisdom of this group of people. Thank you all.
I love you too man! 🙂
I had a fabulous surf (okay, the surf was average but I’m still stoked) today and so I’m super happy and FEELING THE LOVE
Oh yeah.
Thanks for the kind words people 🙂
And I’ll second too, thanks to Verne for sharing your experience and knowledge.
You’re very welcome Rodney. I know my input on this forum will some day be regarded as some of the best all-time internet comments… Hmmm, maybe not!
As soon as I read today’s analysis, I had the same thought as Verne. Minor 2 is going to be an expanded flat correction. No lower invalidation point, so price can go up and down as much as it wants to frustrate both bulls and bears for some time…
The question that I have is if the next upward movement goes above 2084 and approaches the bear market trend line, does that mean the flat correction is invalidated? Is there anything that will invalidate this expanded flat wave count?
The expanded flat idea would be invalid if minute b does not retrace a minimum 0.9 length of minute wave a. So it requires price to move lower first to 2,043.99 or below.
Downwards movement should be weak and subdivide as a three.
That’s a good point about other markets Verne.
A quick review of a few of the biggest:
FTSE; minor 1 lasted 11 days, so far minor 2 is only 3 days and is slightly short of the 0.382 Fibonacci ratio. It really looks to me like it needs to go higher.
DJIA: minor 1 lasted 11 days, so far minor 2 is only 3 days and 0.60 of minor 1. For the Dow it looks like it could be over. Today completed a bearish engulfing candlestick pattern.
DJT: minor 1 lasted 11 days, minor 2 so far 3 days and 0.44 of minor 1. Today completed a very strong bearish engulfing candlestick pattern. For DJT it also looks like it could be over, but I can see the possibility of it moving higher to be a clear three wave structure on the daily chart.
Nasdaq: minor 1 lasted 12 days, minor 2 so far 3 days and 0.45 of minor 1. Again a bearish engulfing candlestick pattern today. If Nasdaq has completed its correction then the correction would have lasted only 2 days. Nasdaq looks like it should move higher so that the correction has better proportion and a stronger three wave look.
On balance unfortunately this doesn’t clarify much for me. It still looks slightly more likely that price for these markets will move higher for another day to three, but it is very possible that the correction is over and tomorrow we may see some very strong downwards movement.
Singapore sometimes leads. That looks so far like it’s correction is very brief and shallow.
2nd:)
1st! 🙂