
FTSE breached the channel confirming a trend change. Thereafter, it continued lower as expected.
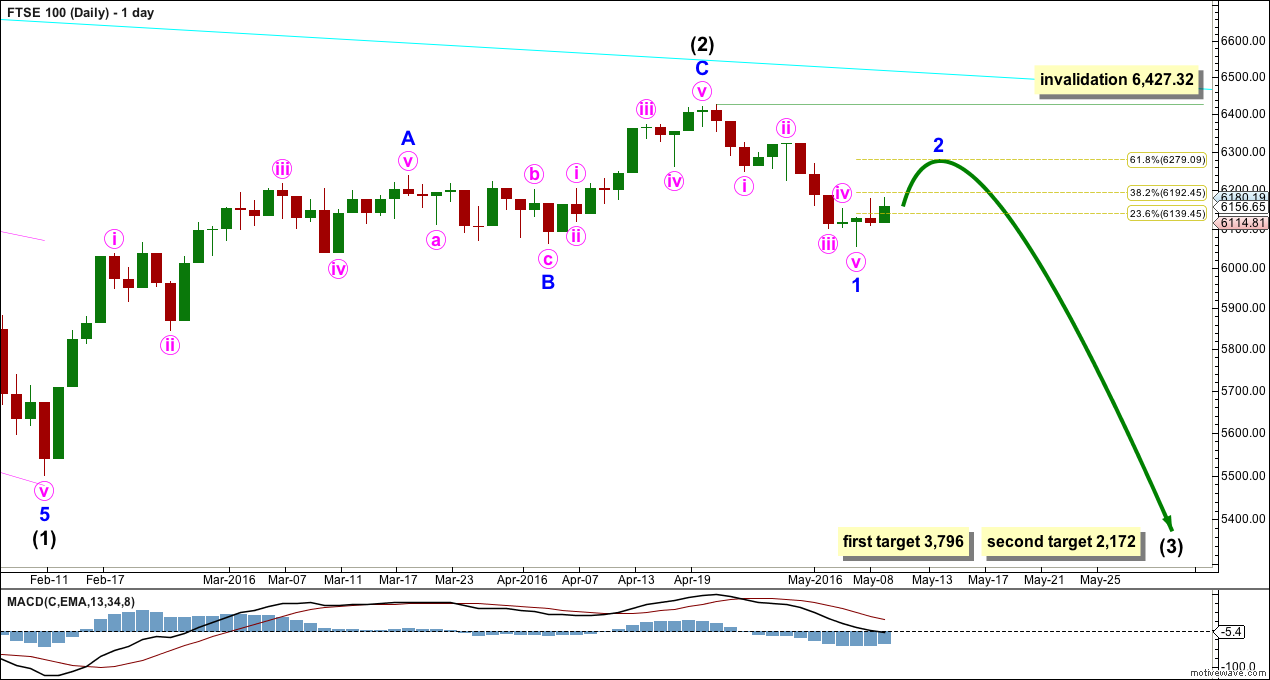
Summary: FTSE may have just begun a second wave correction. It may end in a few days about 6,279. But look out for surprises to the downside because it is possible it may end more quickly. The target remains at 3,796.
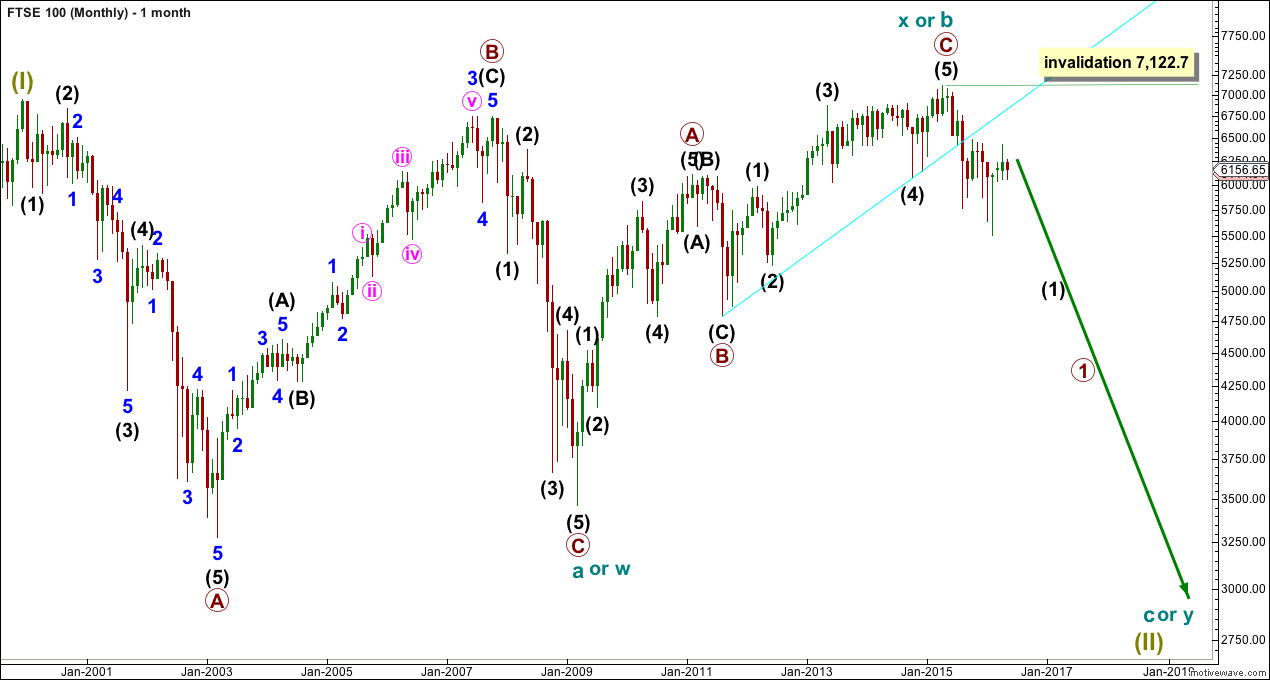
MONTHLY ELLIOTT WAVE COUNT
Click chart to enlarge.
At the monthly chart level, FTSE is the clearest bear market.
The cyan trend line is drawn across the two major swing lows in the bull market which began on March 2009. This bull market trend line has been breached by a close well over 3% of market value, indicating a trend change from bull to bear.
The 200 day moving average is now declining (shown on the technical analysis daily chart at the end of analysis). Price has made a series of lower lows and lower highs. FTSE is in a bear market until proven otherwise.
From an Elliott Wave perspective, the downwards movement labelled intermediate wave (1) to the low in February 2016 has well overlapped back into the high labelled primary wave A of February 2011. This downwards movement may not be a fourth wave correction within an impulse unfolding upwards. So the prior wave up labelled cycle wave X or b must be over and it must be a three wave structure.
The cyan bull market trend line has provided resistance.
Super Cycle wave (II) is seen as either a large flat correction, a double flat or a double combination.
If Super Cycle wave (II) is a large flat, then within it cycle wave a was a regular flat and cycle wave b was a zigzag and 1.05 the length of cycle wave a. The length of cycle wave b indicates the most common type of flat, an expanded flat, may be unfolding. Cycle wave c downwards must subdivide as a five wave structure. Cycle wave c would be expected to end substantially below the end of cycle wave a at 3,460. At 1,477 cycle wave c would reach 1.618 the length of cycle wave a.
If Super Cycle wave (II) is a double flat, then the first flat in the double was a regular flat labelled cycle wave w. The double is joined by a three in the opposite direction, a zigzag labelled cycle wave x. Now a second flat correction should unfold sideways for cycle wave y. Cycle wave y would look similar to cycle wave w, with two large market crashes within it. It should end about the same level as cycle wave w at 3,460, so that the whole movement is a sideways structure.
If Super Cycle wave (II) is a double combination, then the second structure in the double for cycle wave y may be either a zigzag or a triangle. Either of these should reach down only to about the same level as cycle wave w at 3,460, so that the whole structure has a sideways look to it.
Of all these three options the simple expanded flat labelled cycle waves a-b-c is the most likely because expanded flats are very common structures.
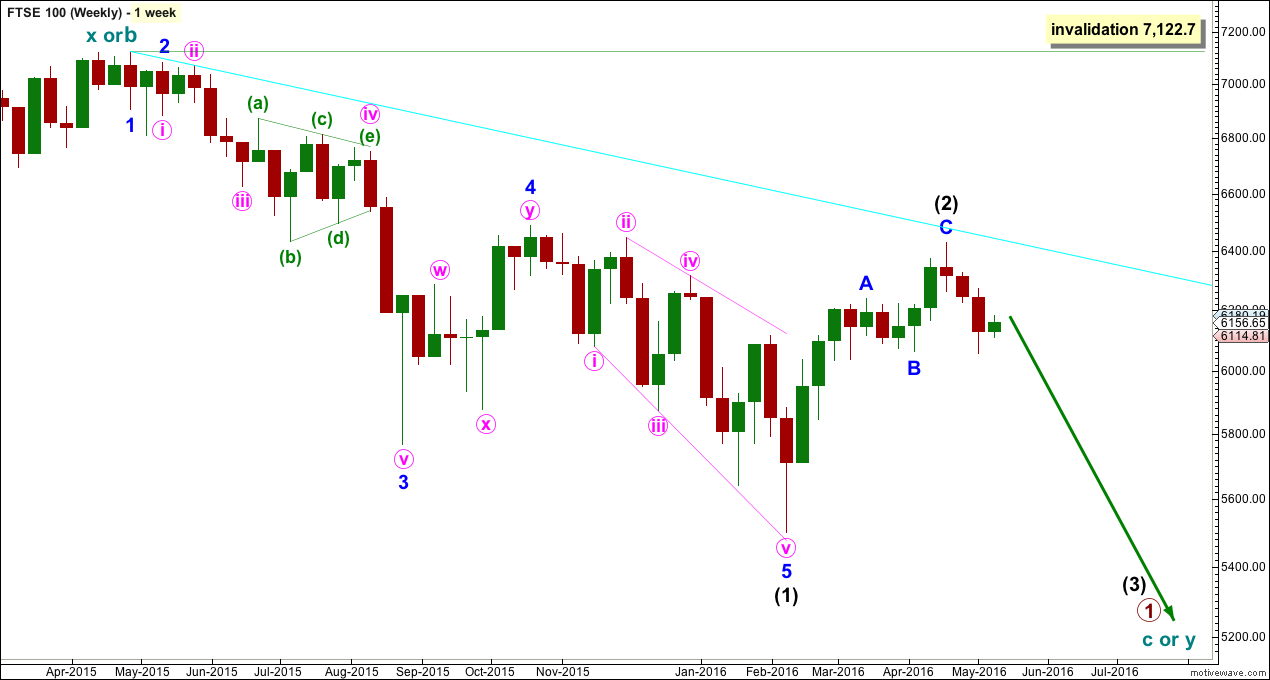
WEEKLY ELLIOTT WAVE COUNT
Click chart to enlarge.
Intermediate wave (1) subdivides as an impulse. Intermediate wave (2) is subdividing as a zigzag. Only when the small blue channel about this zigzag is breached to the downside may confidence be had that it is over.
Intermediate wave (2) may not move beyond the start of intermediate wave (1) above 7,122.7.
DAILY ELLIOTT WAVE COUNT
Click chart to enlarge.
A five down looks fairly clear for FTSE. This should be expected to be followed by a three up. Minor wave 2 would most likely end about the 0.618 Fibonacci ratio. It may last a few more days.
However, technically it may also be over. It would be relatively brief and shallow though at only 0.342 of minor wave 1 and lasting only two days. It is possible it may be over but looks more likely it will continue higher.
The first target for intermediate wave (3) is at 3,796 where it would reach 1.618 the length of intermediate wave (1). If price gets to the first target and the structure is incomplete, or if price keeps falling through the first target, then the second target would be used. At 2,172 intermediate wave (3) would reach 2.618 the length of intermediate wave (1).
Intermediate wave (3) must make a new low below the end of intermediate wave (1) at 5,499.51.
TECHNICAL ANALYSIS
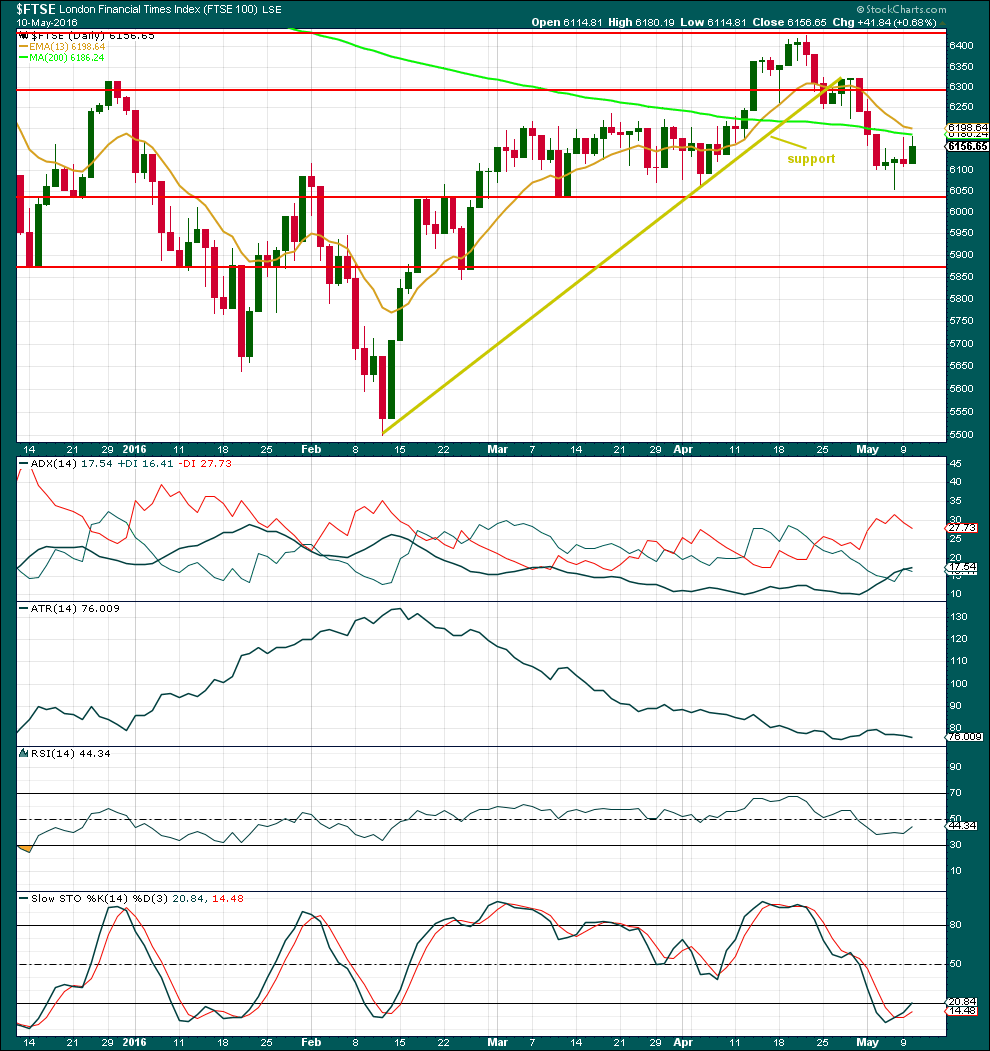
Click chart to enlarge. Chart courtesy of StockCharts.com.
Neither Google / Yahoo data feed nor StockCharts provide volume data for FTSE. Comments on volume are taken from Yahoo Finance data.
The rise in price for 10th May comes on lighter volume. The rise in price is not supported by volume. This supports the Elliott wave count.
At the low, the candlestick for 6th May completes a hammer. Now the 9th and 10th of May complete a bullish engulfing pattern. This indicates a trend change but does not indicate how high the next wave may go.
Price is finding some resistance at the 200 day moving average.
ADX is increasing indicating the market is trending downwards. ATR is still declining indicating a trend has not yet started, or that there is something wrong with this downwards trend so far.
RSI is neutral. There is room for price to rise or fall. There was slight divergence between RSI at the low of the 6th May and the low of 4th May. This indicates some upwards movement which is unfolding.
Stochastics is returning from oversold.
This analysis is published @ 04:02 a.m. EST on 11th May, 2016.
First! Ha!
Now i feel awesome 🙂