
Downwards movement was expected for Tuesday’s session but did not happen.
Upwards movement invalidated the hourly Elliott wave count, but the daily Elliott wave count remains on track.
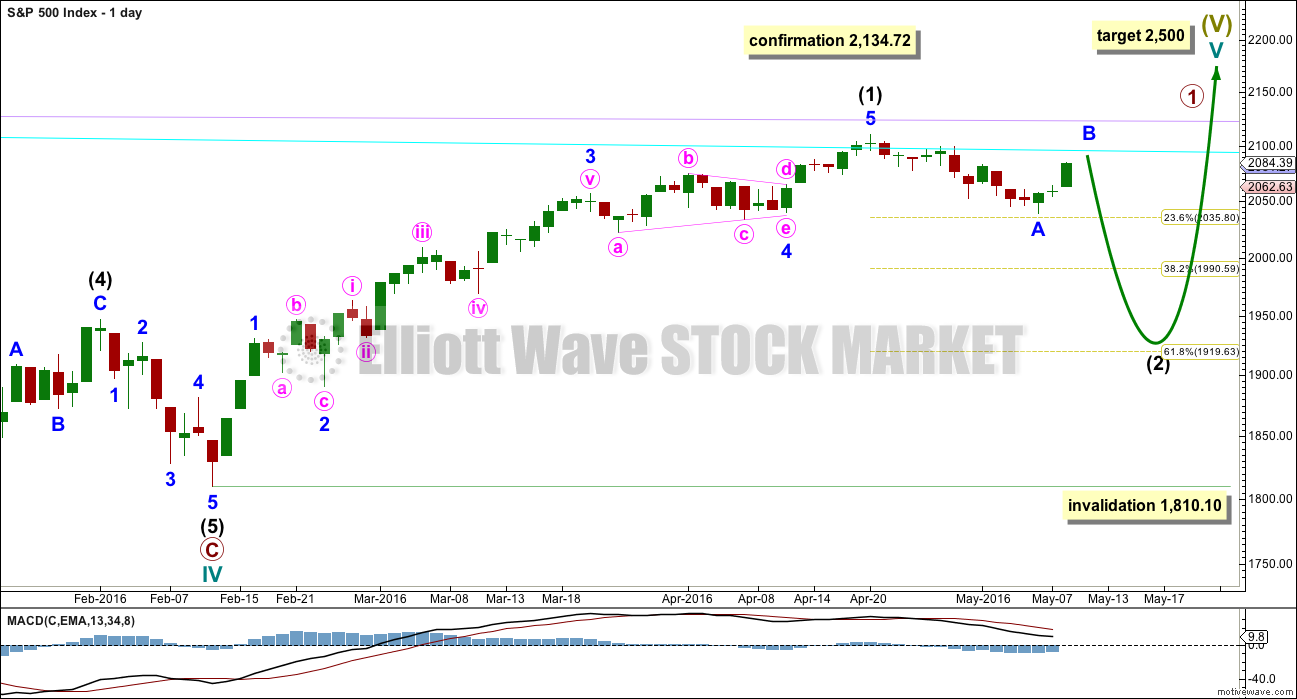
Summary: A five down on the daily chart for minor 1 is complete. Minor 2 upwards has begun. It is possible that minor wave 2 is over at today’s high, but it is also possible it may continue higher. If it does, look for it to end if price touches the bear market trend line. This is the point at which surprises to the downside may show up in a big way. Risk to short positions must be at 2,111.05.
To see last published monthly charts click here.
To see how each of the bull and bear wave counts fit within a larger time frame see the Grand Supercycle Analysis.
To see detail of the bull market from 2009 to the all time high on weekly charts, click here.
New updates to this analysis are in bold.
BEAR ELLIOTT WAVE COUNT
WEEKLY CHART
Click chart to enlarge.
This bear wave count fits better than the bull with the even larger picture, super cycle analysis found here. It is also well supported by regular technical analysis at the monthly chart level.
Importantly, there is no lower invalidation point for this wave count. That means there is no lower limit to this bear market.
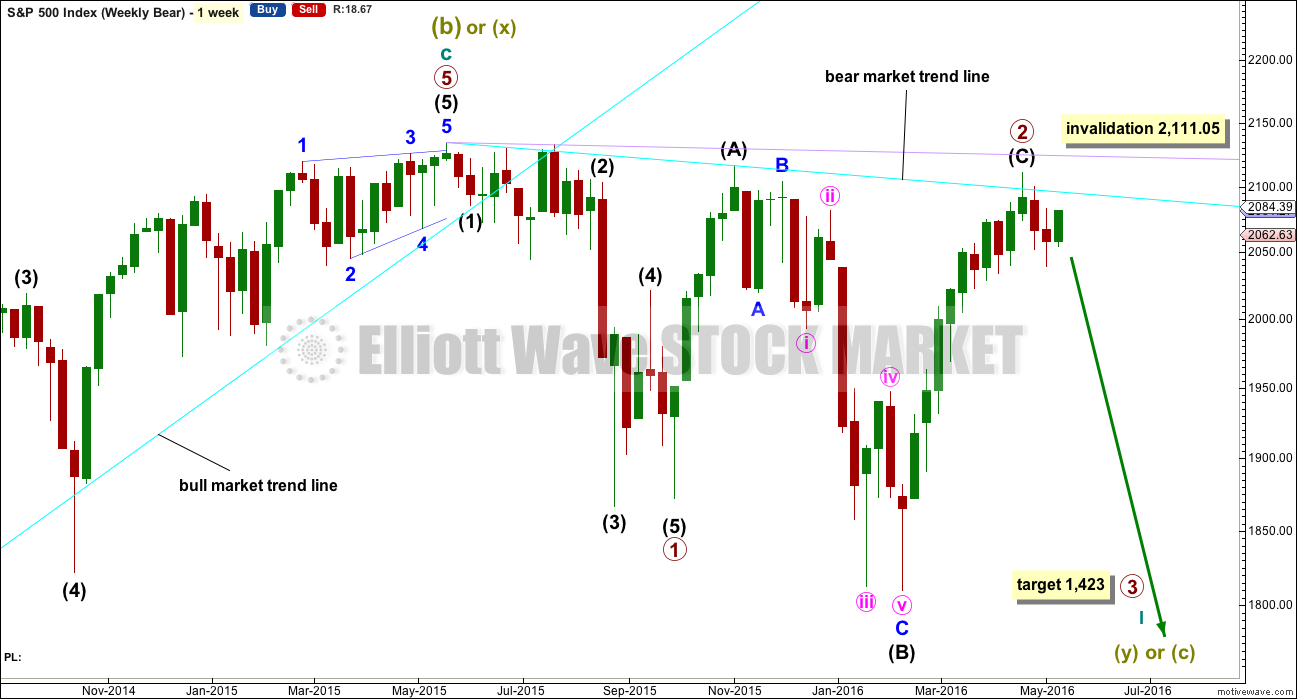
Primary wave 1 is complete and lasted 19 weeks. Primary wave 2 is either over lasting 28 weeks, or it may continue for another one or two weeks.
An expectation for duration of primary wave 3 would be for it to be longer in duration than primary wave 1. If it lasts about 31 weeks, it would be 1.618 the duration of primary wave 1. It may last about a Fibonacci 34 weeks in total, depending on how time consuming the corrections within it are.
At the last high in April, the weekly candlestick has a long upper shadow which is bearish. The next candlestick completes a bearish engulfing pattern. That pattern is now followed by another downwards week, so it is reinforced.
Primary wave 2 may be complete as a rare running flat. Just prior to a strong primary degree third wave is the kind of situation in which a running flat may appear. Within primary wave 2, intermediate wave (A) was a deep zigzag (which will also subdivide as a double zigzag). Intermediate wave (B) fits perfectly as a zigzag and is a 1.21 length of intermediate wave (A). This is within the normal range for a B wave of a flat of 1 to 1.38.
Within primary wave 3, no second wave correction may move beyond its start above 2,111.05.
DAILY CHART
Click chart to enlarge.
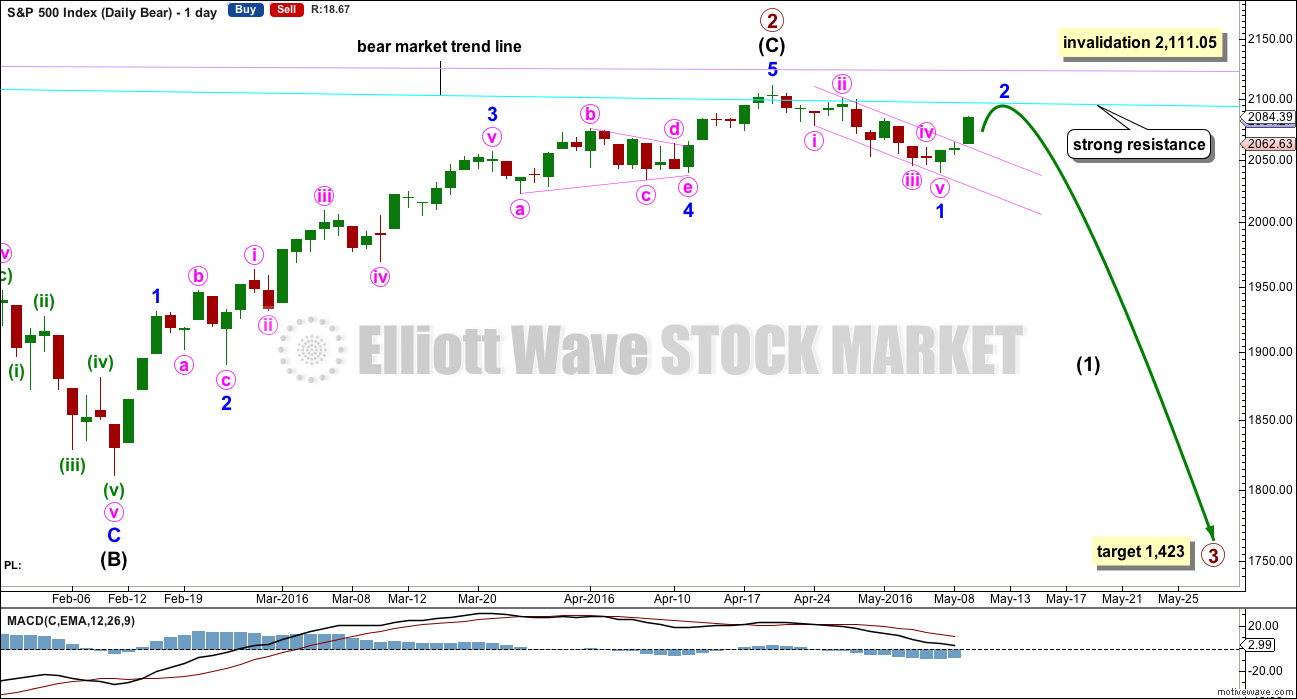
If intermediate wave (C) is over, then the truncation is small at only 5.43 points. This may occur right before a very strong third wave pulls the end of intermediate wave (C) downwards. At the end of last week, price has confirmed a trend change with a new low slightly below 2,039.74.
The next wave down for this wave count would be a strong third wave at primary wave degree. At 1,423 primary wave 3 would reach 2.618 the length of primary wave 1. This is the appropriate ratio for this target because primary wave 2 is very deep at 0.91 of primary wave 1. If this target is wrong, it may be too high. The next Fibonacci ratio in the sequence would be 4.236 which calculates to a target at 998. That looks too low, unless the degree of labelling is moved up one and this may be a third wave down at cycle degree just beginning. I know that possibility right now may seem absurd, but it is possible.
Alternatively, primary wave 3 may not exhibit a Fibonacci ratio to primary wave 1. When intermediate waves (1) through to (4) within the impulse of primary wave 3 are complete, then the target may be calculated at a second wave degree. At that stage, it may change or widen to a small zone.
Draw a small channel about the new downwards movement using Elliott’s first technique: draw the first trend line from the ends of minute waves i to iii, then place a parallel copy on the end of minute wave ii. With upwards movement today clearly breaching the channel, this confirms that minor wave 1 is over and minor wave 2 has begun.
After reexamination, the equivalent minor wave 2 within the last big bear market was a 0.495 depth of minor wave 1 and lasted two days to minor wave 1’s five days.
The next possible equivalent minor wave 2 lasted one day longer than its minor wave 1 and was very deep at 0.81.
Overall, it is impossible to tell with certainty how deep and long lasting this minor wave 2 will be. Expect surprises to the downside with a big third wave in its infancy.
Minor wave 2 may be deep enough to find resistance at the bear market trend line. This line should now offer very strong resistance; I would not expect price to break above it.
Minor wave 1 lasted 12 days, one short of a Fibonacci 13. So far minor wave 2 has lasted only two days. If it continues for another few days and has a clear three wave look to it, then it would very likely be complete. The risk today is that it could be over here or very soon indeed.
Minor wave 2 may not move beyond the start of minor wave 1 above 2,111.05.
HOURLY CHART
Click chart to enlarge.
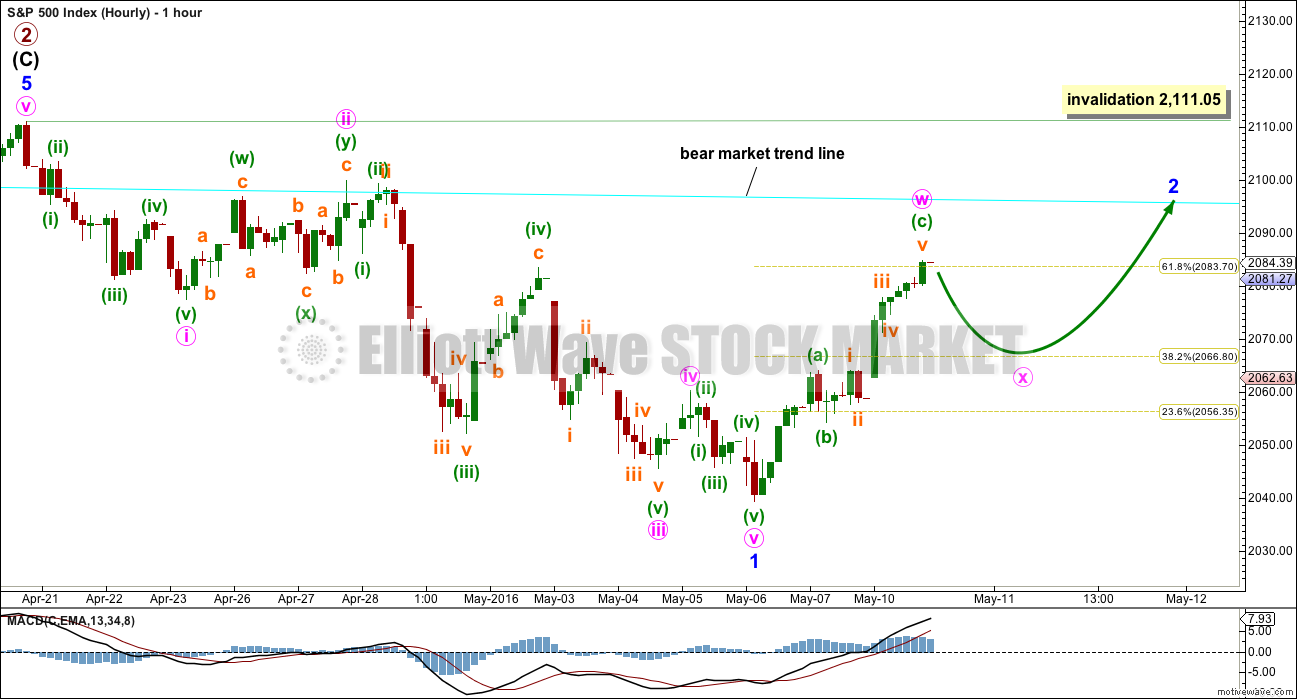
Upwards movement back into minute wave i price territory cannot be minute wave iv, so minor wave 1 must be over.
Ratios within minor wave 1 are: minute wave iii is just 0.09 points longer than 1.618 the length of minute wave i, and minute wave v is just 0.06 points longer than 0.618 the length of minute wave i. There is some alternation between the deep 0.68 double zigzag of minute wave ii and the shallow 0.27 single zigzag of minute wave iv.
The most difficult question today is whether or not minor wave 2 could be over. It certainly could be, and we may be surprised by very strong downwards movement tomorrow.
At this stage, the wave count is labelled with an incomplete minor wave 2. In order for the wave count to have a more typical look at the daily chart level minor wave 2 may be a little longer lasting and a clearer three wave structure. A small red candlestick or doji tomorrow may complete a zigzag down for minute wave X. That may be followed by one or two upwards days for a second zigzag labelled minute wave y to end when price touches the bear market trend line.
Alternatively, the degree of labelling within minor wave 2 may be moved up one degree and it may be over at the high today. Tomorrow may see the start of minor wave 3 downwards with very swift strong movement.
Only a five down on the hourly chart would confirm that minor wave 2 is over. Unfortunately, impulses and zigzags can often look the same and it is sometimes impossible to tell which one a movement subdivides as.
On balance, my conclusion is the high of Tuesday still represents a good entry price for this large third wave. Trying to perfectly time a better entry risks missing this opportunity right now. Some risk must be accepted. Risk at this stage is firmly at 2,111.05. Minor wave 2 may not move beyond the start of minor wave 1.
BULL ELLIOTT WAVE COUNT
WEEKLY CHART
Click chart to enlarge.
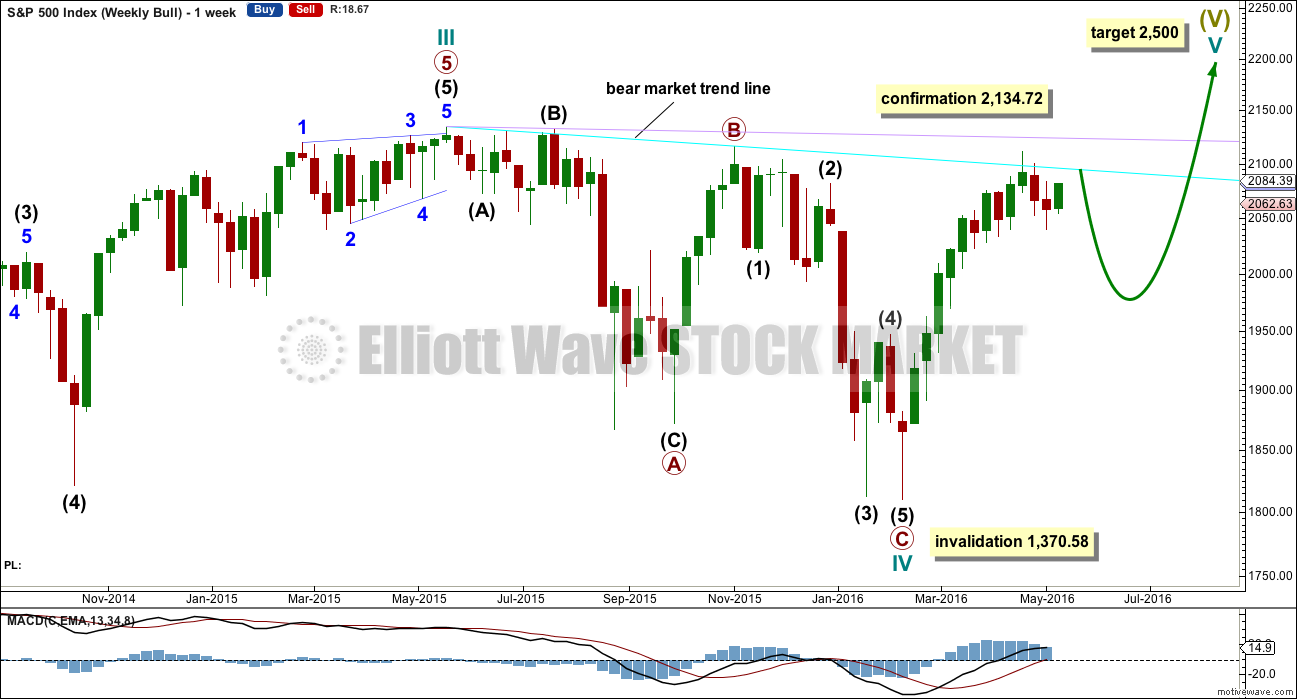
Within primary wave C downwards, intermediate wave (2) is seen as an atypical double zigzag. It is atypical in that it moves sideways. Double zigzags should have a clear slope against the prior trend to have the right look. Within a double zigzag, the second zigzag exists to deepen the correction when the first zigzag does not move price deep enough. Not only does this second zigzag not deepen the correction, it fails to move at all beyond the end of the first zigzag. This structure technically meets rules, but it looks completely wrong. This gives the wave count a low probability.
This part of the structure is highly problematic for the bull wave count. It is not possible to see cycle wave IV as complete without a big problem in terms of Elliott wave structure.
Cycle wave II was a shallow 0.41 zigzag lasting three months. Cycle wave IV may be a complete shallow 0.19 regular flat correction, exhibiting some alternation with cycle wave II.
At 2,500 cycle wave V would reach equality in length with cycle wave I.
Price remains below the final bear market trend line. This line is drawn from the all time high at 2,134.72 to the swing high labelled primary wave B at 2,116.48 on November 2015. This line is drawn using the approach outlined by Magee in the classic “Technical Analysis of Stock Trends”. To use it correctly we should assume that a bear market remains intact until this line is breached by a close of 3% or more of market value. In practice, that price point would be a new all time high which would invalidate any bear wave count.
This wave count requires price confirmation with a new all time high above 2,134.72.
While price has not made a new high, while it remains below the final bear market trend line and while technical indicators point to weakness in upwards movement, this very bullish wave count comes with a strong caveat. I still do not have confidence in it.
DAILY CHART
Click chart to enlarge.
If the bull market has resumed, it must begin with a five wave structure upwards at the daily and weekly chart level. That may today be complete. The possible trend change at intermediate degree still requires confirmation in the same way as the alternate hourly bear wave count outlines before any confidence may be had in it.
If intermediate wave (2) begins here, then a reasonable target for it to end would be the 0.618 Fibonacci ratio of intermediate wave (1) about 1,920. Intermediate wave (2) must subdivide as a corrective structure. It may not move beyond the start of intermediate wave (1) below 1,810.10.
In the long term, this wave count absolutely requires a new high above 2,134.72 for confirmation. This would be the only wave count in the unlikely event of a new all time high. All bear wave counts would be fully and finally invalidated.
TECHNICAL ANALYSIS
WEEKLY CHART
Click chart to enlarge. Chart courtesy of StockCharts.com.
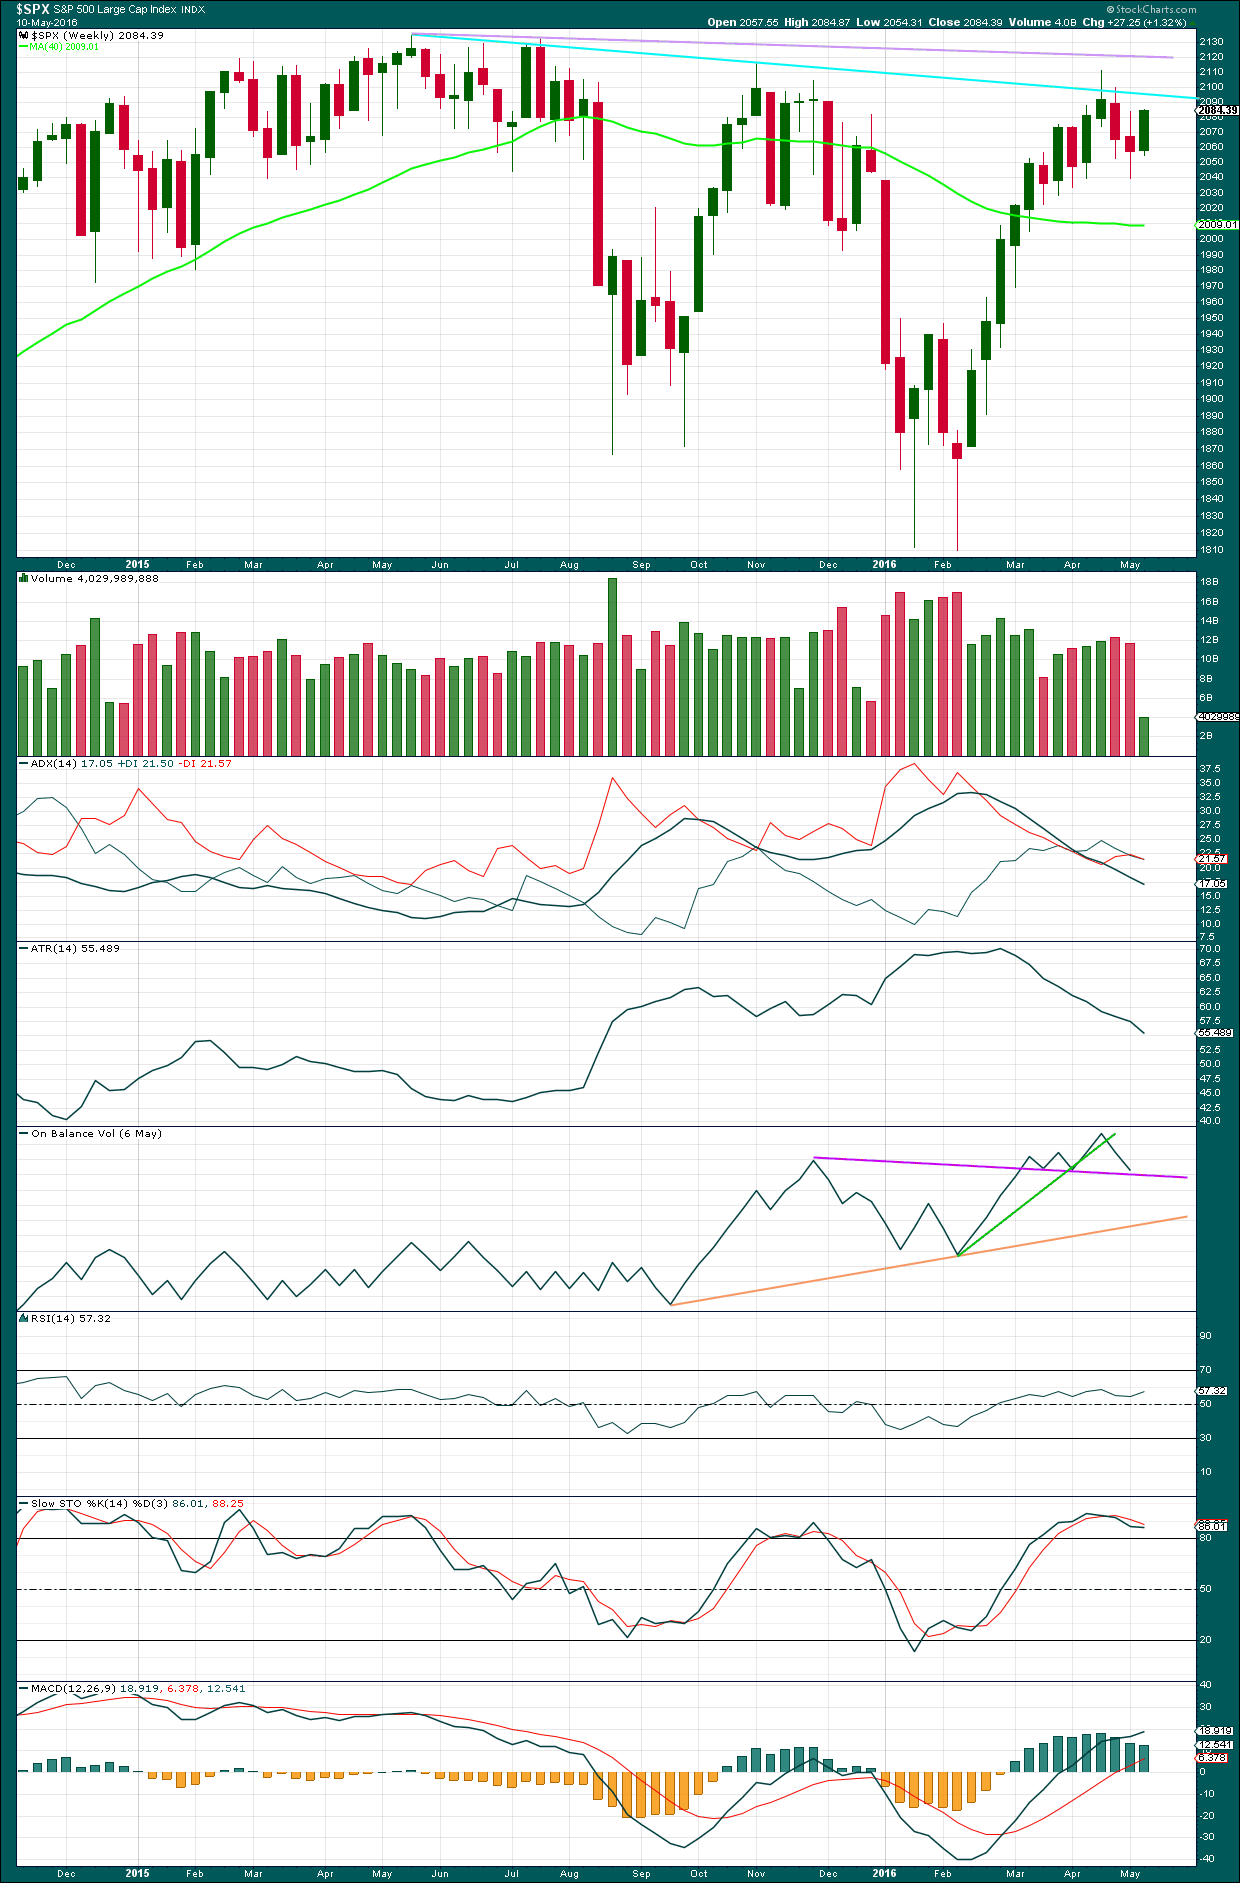
There is a bearish engulfing candlestick pattern at the last high. This has occurred at the round number of 2,100 which increases the significance. Volume on the second candlestick is higher than volume on the first candlestick, which further increases the significance. That it is at the weekly chart level is further significance.
Engulfing patterns are the strongest reversal patterns.
Now this pattern is followed by another red weekly candlestick. The reversal implications of the pattern are confirmed.
This is a very strong bearish signal. It adds significant weight to the expectation of a trend change. It does not tell us how low the following movement must go, only that it is likely to be at least of a few weeks duration.
There is a weak bearish signal from On Balance Volume at the weekly chart level with a break below the green line. A stronger bearish signal would be a break below the purple line. At the end of last week, OBV has come down to almost touch the purple line. Some support may be expected about here, so this may prompt minor wave 2 to bounce higher.
There is hidden bearish divergence between Stochastics and price at the last high and the high of November 2015. Stochastics has moved further into overbought territory, but this has failed to translate into a corresponding new high in price. Price is weak. MACD exhibits the same hidden bearish divergence.
After a period of declining ATR, it should be expected to turn and begin to increase.
DAILY CHART
Click chart to enlarge. Chart courtesy of StockCharts.com.
Volume data on StockCharts is different to that given from NYSE, the home of this index. Comments on volume will be based on NYSE volume data when it differs from StockCharts.
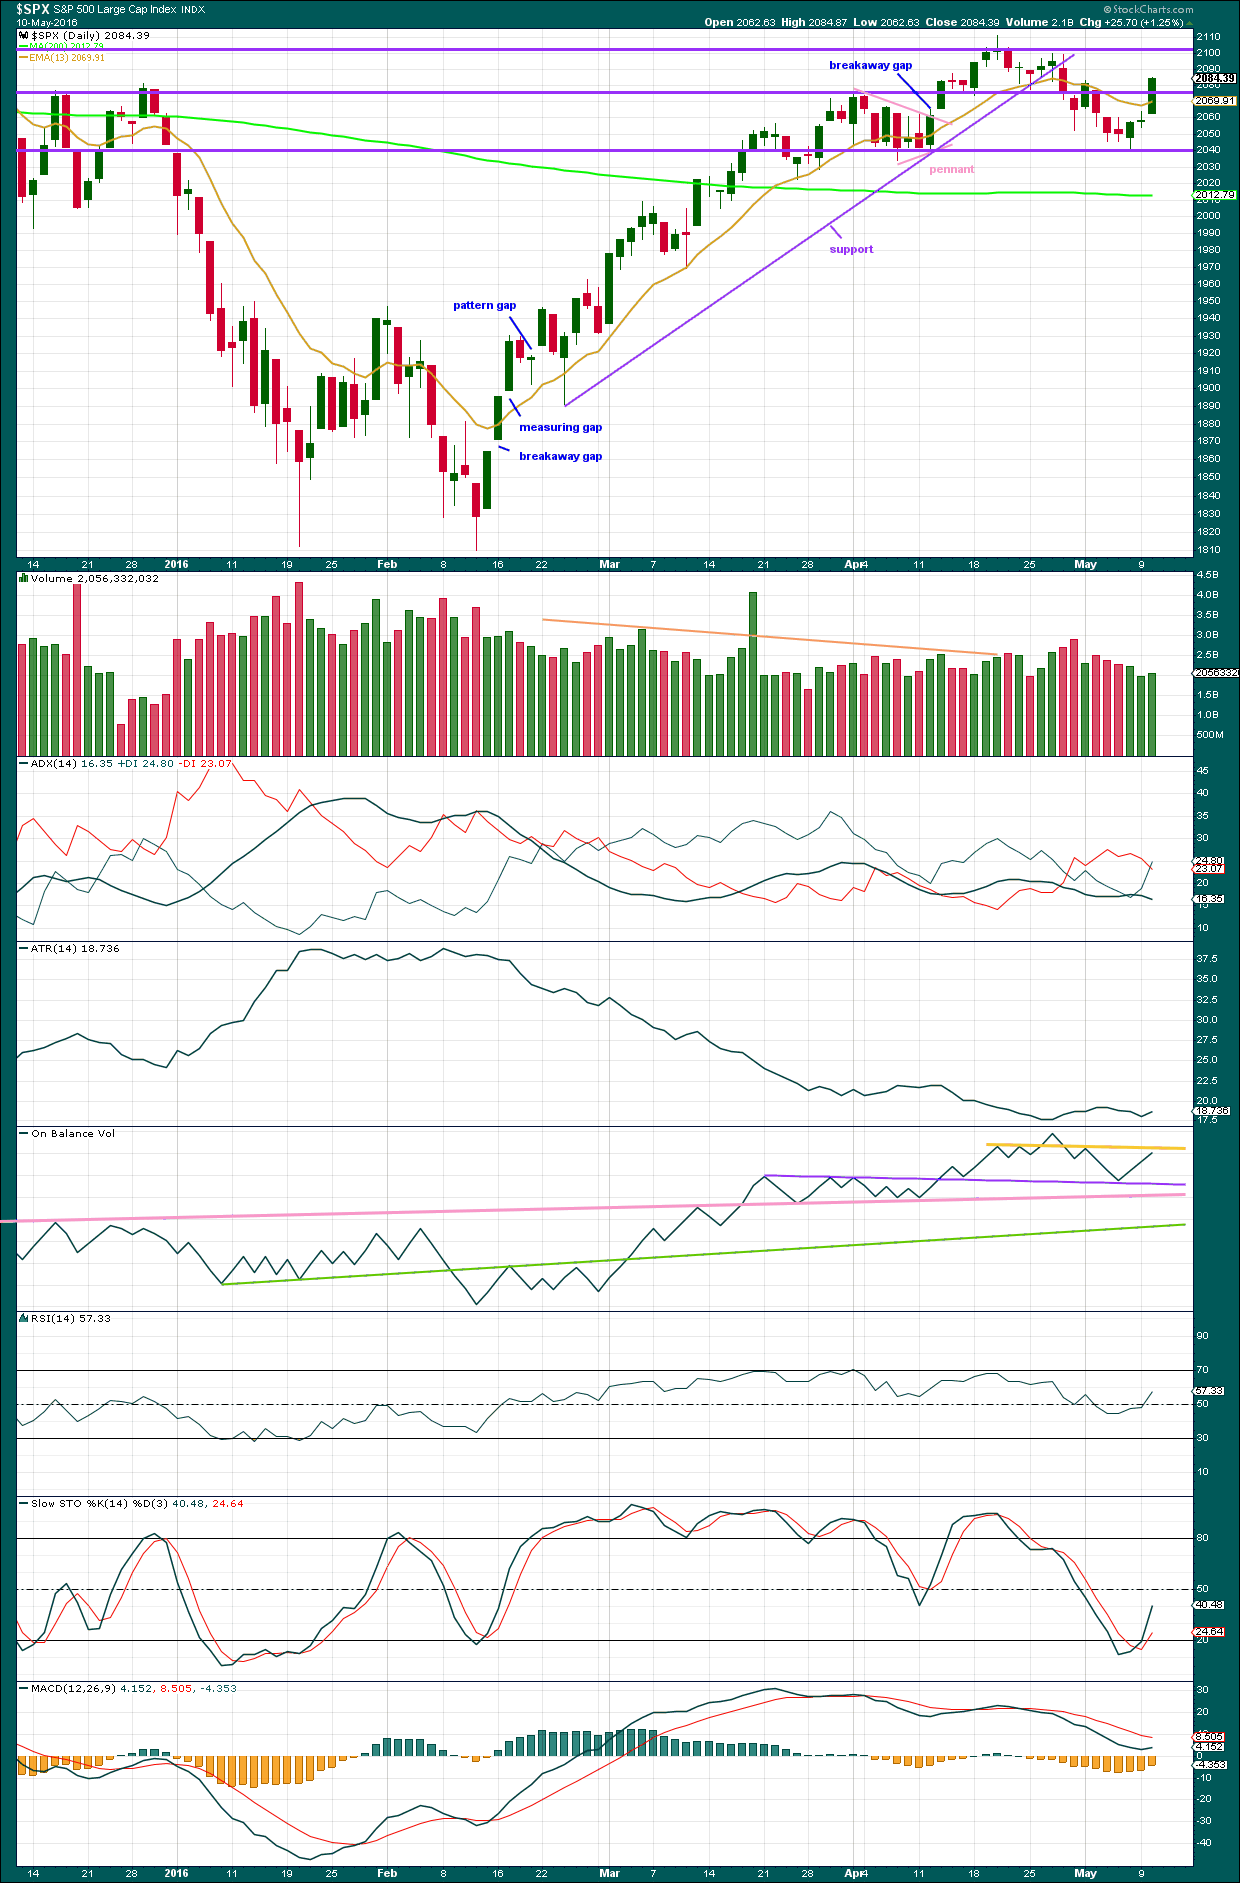
Volume data today on StockCharts differs from NYSE. NYSE data shows today’s upwards day has lighter volume than the prior two upwards days. There are now three upwards green daily candlesticks in a row on declining volume. The rise in price is not supported by volume, so it is suspicious. This is more likely a small bear market rally than the start of a new upwards trend.
Price has sliced through resistance at the horizontal line about 2,070. The next significant horizontal line is at 2,100. This round number should be expected to offer very strong resistance at this stage. If price reaches up that high, expect an end to upward movement there.
ADX is declining and indicating a possible trend change. The +DX line today has slightly crossed over the -DX line.
ATR is increasing today indicating a possible trend beginning.
The picture from ADX and ATR today is unclear, which is to be expected if this upwards movement is a small rally.
On Balance Volume did in fact assist to show where minor wave 1 ended. It ended when OBV touched the purple line. Now OBV is moving strongly away from the line. In looking for a line to offer resistance for OBV the best I can find is the yellow line. This line does not offer good technical significance; it is not very long held and has been breached. But it has been tested three times before. It may be that it is being tested a fourth time today. This may assist to stop price moving higher about here; this suggests that minor wave 2 may be over today more quickly than expected.
RSI is just above neutral. There is room for price to rise or fall.
Stochastics is returning from oversold.
MACD has not indicated a trend change yet.
VOLATILITY – INVERTED VIX DAILY CHART
Click chart to enlarge. Chart courtesy of StockCharts.com.
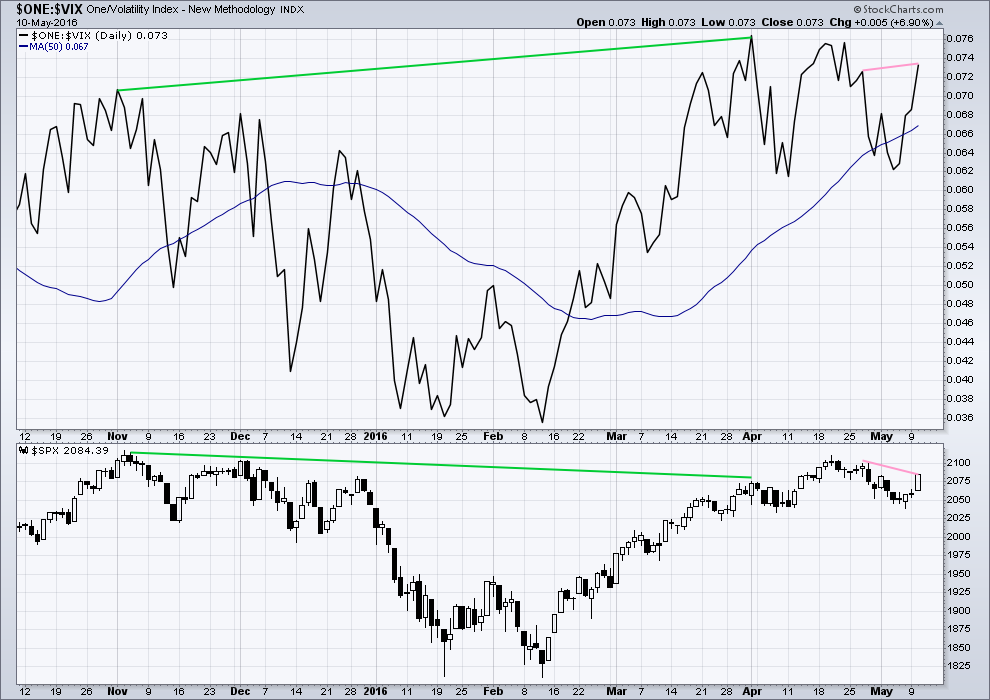
Volatility declines as inverted VIX climbs. This is normal for an upwards trend.
What is not normal here is the divergence over a reasonable time period between price and inverted VIX (green lines). The decline in volatility is not translating to a corresponding increase in price. Price is weak. This divergence is bearish.
Inverted VIX today has made a new high above the prior swing high of 27th April, but price has failed to make a corresponding new high. This indicates that volatility today declined to below the prior point on 27th April, but this decline in volatility has not translated into a corresponding increase in price. Price again is weak.
Upwards rallies continue to exhibit persistent weakness..
BREADTH – ADVANCE DECLINE LINE
Click chart to enlarge. Chart courtesy of StockCharts.com.
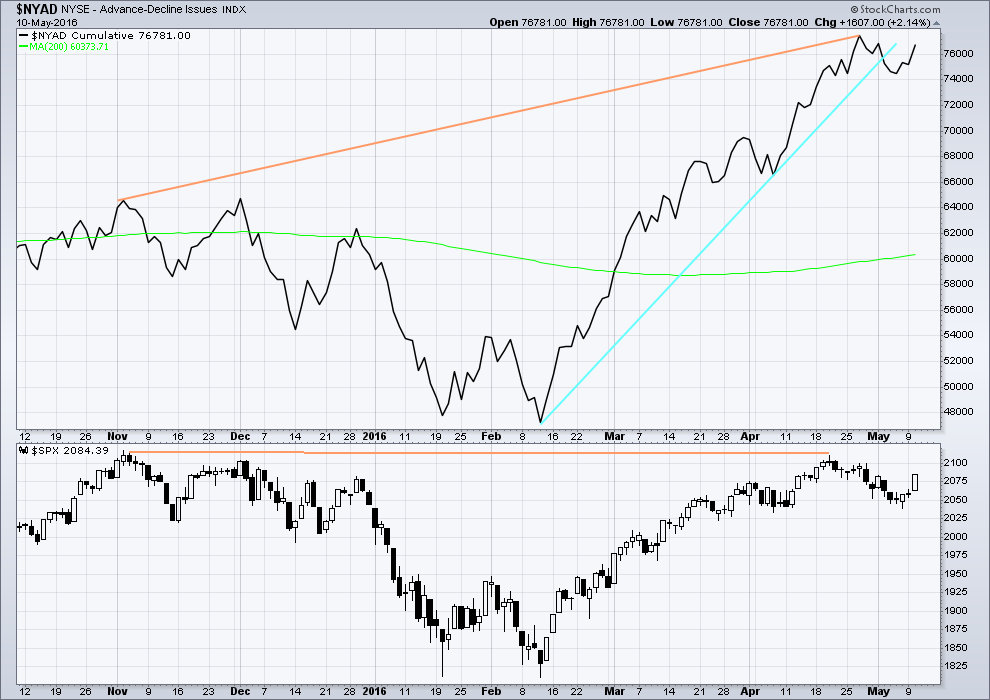
With the AD line increasing, this indicates the number of advancing stocks exceeds the number of declining stocks. This indicates that there is breadth to this upwards movement.
From November 2015 to 20th April, the AD line made new highs while price far failed to make a corresponding new high. This indicates weakness in price; the increase in market breadth is unable to be translated to increase in price (orange lines).
The 200 day moving average for the AD line is now increasing. This alone is not enough to indicate a new bull market. During November 2015 the 200 day MA for the AD line turned upwards and yet price still made subsequent new lows.
The AD line is now declining and has breached a support line (cyan). There is breadth to downwards movement; more stocks are declining than advancing which supports the fall in price.
Now for three days in a row price increases while the AD line also increases. There is breadth to this upwards movement.
ANALYSIS OF LAST MAJOR BEAR MARKET OCTOBER 2007 – MARCH 2009
Click to enlarge.
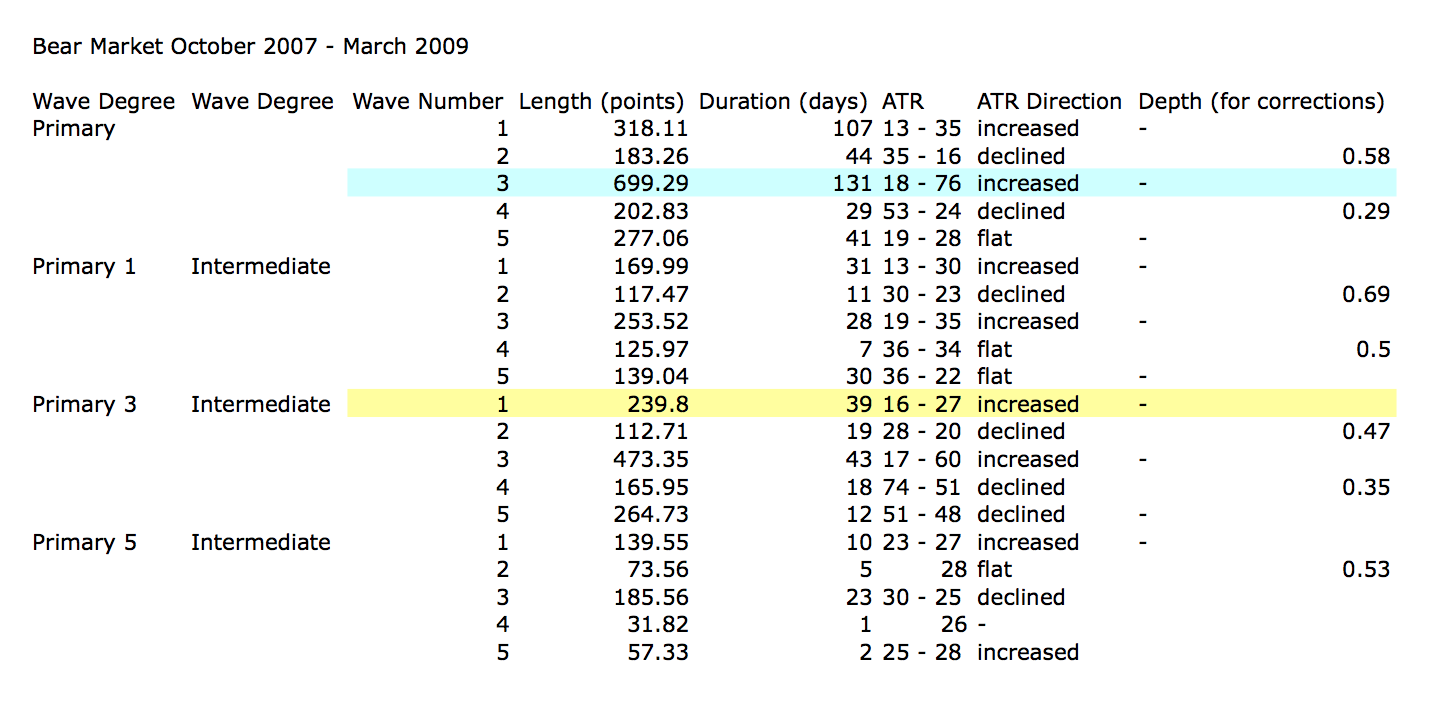
In looking back to see how a primary degree third wave should behave in a bear market, the last example may be useful.
Currently, the start of primary wave 3 now may be underway for this current bear market. Currently, ATR sits about 19. With the last primary degree third wave (blue highlighted) having an ATR range of about 18 to 76, so far this one looks about right.
The current wave count sees price in an intermediate degree first wave within a primary degree third wave. The equivalent in the last bear market (yellow highlighted) lasted 39 days and had a range of ATR from 16 – 27.
Click chart to enlarge.
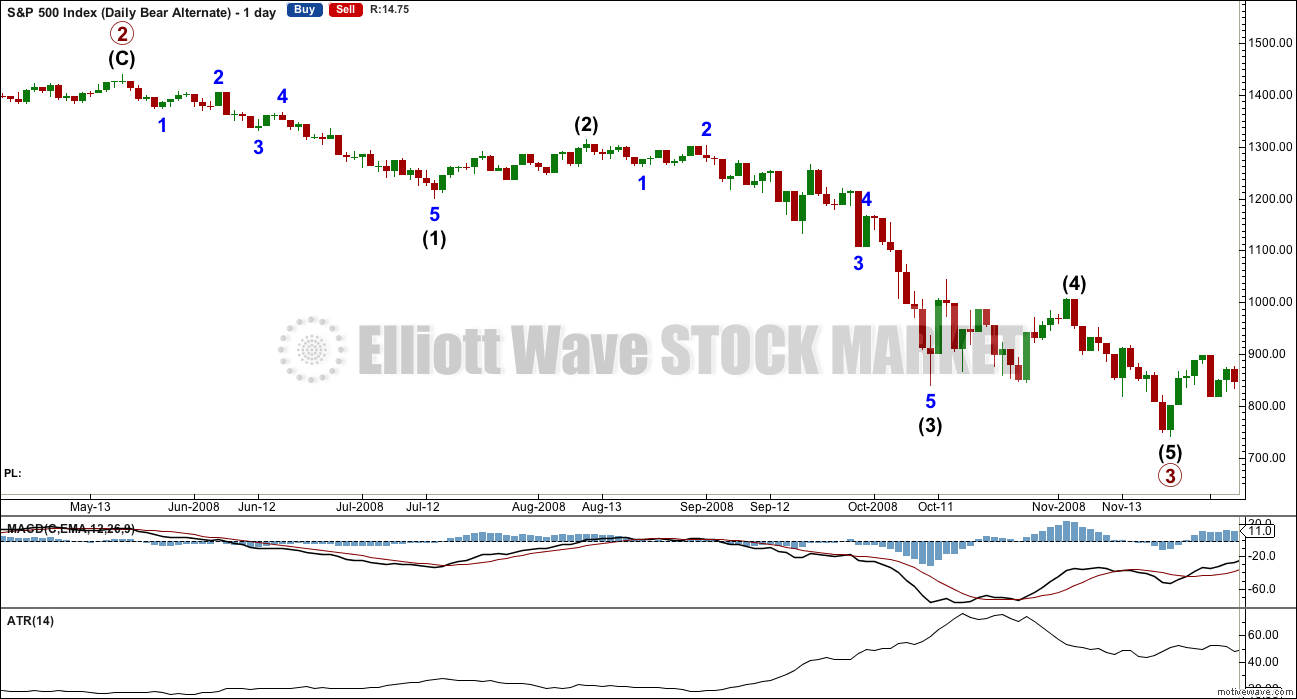
This chart is shown on an arithmetic scale, so that the differences in daily range travelled from the start of primary wave 3 to the end of primary wave 3 is clear.
Primary wave 3 within the last bear market from October 2007 to March 2009 is shown here. It started out somewhat slowly with relatively small range days. I am confident of the labelling at primary degree, reasonably confident of labelling at intermediate degree, and uncertain of labelling at minor degree. It is the larger degrees with which we are concerned at this stage.
During intermediate wave (1), there were a fair few small daily doji and ATR only increased slowly. The strongest movements within primary wave 3 came at its end.
It appears that the S&P behaves somewhat like a commodity during its bear markets. That tendency should be considered again here.
This chart will be republished daily for reference. The current primary degree third wave which this analysis expects does not have to unfold in the same way, but it is likely that there may be similarities.
DOW THEORY
I am choosing to use the S&P500, Dow Industrials, Dow Transportation, Nasdaq and the Russell 2000 index. Major swing lows are noted below. So far the Industrials, Transportation and Russell 2000 have made new major swing lows. None of these indices have made new highs.
I am aware that this approach is extremely conservative. Original Dow Theory has already confirmed a major trend change as both the industrials and transportation indexes have made new major lows.
At this stage, if the S&P500 and Nasdaq also make new major swing lows, then my modified Dow Theory would confirm a major new bear market. At that stage, my only wave count would be the bear wave count.
The lows below are from October 2014. These lows were the last secondary correction within the primary trend which was the bull market from 2009.
These lows must be breached by a daily close below each point.
S&P500: 1,821.61
Nasdaq: 4,117.84
DJIA: 15,855.12 – close below on 25th August 2015.
DJT: 7,700.49 – close below on 24th August 2015.
Russell 2000: 1,343.51 – close below on 25th August 2015.
To the upside, DJIA has made a new major swing high above its prior major high of 3rd November, 2015, at 17,977.85. But DJT has so far failed to confirm because it has not yet made a new major swing high above its prior swing high of 20th November, 2015, at 8,358.20. Dow Theory has therefore not yet confirmed a new bull market. Neither the S&P500, Russell 2000 nor Nasdaq have made new major swing highs.
This analysis is published @ 08:40 p.m. EST.
This interesting quote from Chirs Ciovacco’s article made me smile.
“Do you think it would be concerning if the Fed announced they were going to start buying S&P 500 ETFs like (NYSE:SPY) in an effort to “stimulate” the economy? That is exactly what is happening in Japan. From Bloomberg:”
Does anyone really think the juice injected in the markets these last several years came only from stock buybacks?
Furthermore, does anyone think the FED would actually announce that they were engaged in such melarky?
Quite a few learned souls have written convincingly about the great fib that somehow Q.E. for US markets went away. If we only knew…
The interesting thing is that all that bankster largesse notwithstanding, we have gone absolutely nowhere for a year now…something’s gotta give…! 🙂
http://www.investing.com/analysis/doing-the-central-bank-dance-200129423
I love the straight forward technical approach from Ciovacco Capital.
We have gone somewhere in the last year. We have gone sideways 🙂
That’s still a direction. Albeit an intensely frustrating one.
I am thinking that all this interference is delaying the inevitable, and when fear takes over it will have made the crash worse.
This bear market is starting out very slowly indeed in comparison to the last two. It is testing our patience. But so far we have lower highs, lower lows, a 200 day moving average pointing lower and the Grandaddy of all, Dow Theory pointing to a bear market.
‘Nuff Said! 🙂
You can look at the charts and try and predict what will happen, the more you look the more you see lots of different possibilities that could play out, We could well see another wave up as i think vernecarty had a reminder set, the bankers hit hard every other day! Tuesday firstly and maybe Thursday? or will one of these other patterns playout.
I’ve heard this one before: “no one ever went broke by taking profits”.
I’ve closed my small short. Entry 2,077.68, exit 2,065.04.
Nice.
I’m putting my money on expecting minor 2 to move higher.
Todays volume is slightly higher than the prior upwards day, but importantly it is lighter than the last three downwards days.
During a small bear market rally I would expect still to see good volume on a down day, but if it’s lighter than the down days in the last impulse down then it looks more like a B (or X) wave.
And so I am expecting it is more likely that minor 2 will continue higher.
I’m not prepared to trade anything up, no trades against the trend for me. But I’m happy with a quick day trade with a small profit along the way.
Now lets see if I’m right and I can get a better entry for minor 3 down in the next session…. I’d expect tomorrow to print a green candlestick. Minute w lasted two days. If minute y lasts two days the whole thing would have nice proportion.
So it looks like I’ll be up late tonight… or up early tomorrow morning. Hanging out here again with you all.
For now… better get this analysis published because there are waves and I wanna surf!
FWIW: There was divergence with UVXY and price of SPX index. As the price closed at low of the day (2064.46), UVXY closed at 13.98; far from its high of the day (14.22).
If its previous indications hold true, we should be going a bit higher over the next day or 2… But nothing is certain in this crazy market, and we could go down from here…
What is strange about that is that VIX, which is a better measure of near term bearish sentiment, closed near its high of the day. Crazy and mixed-up are good descriptors! 🙂
We have three green daily candlesticks followed by today’s red one. Tomorrow we need a green candlestick with a high at least above 2085 and most likely more. Then we will be able to count Minor 2 on the daily charts. I think that will prove important somewhere down the line.
It does not need to close at the high. But it would be nice to see it finish just barely up. Then we would have a bearish doji gravestone. Wishful thinking I am sure. But reasonably possible. The bulls push it up for several hours. Then the bears push it back down like today with a close up one point. I think it would be a fitting start to Minor 3 down!
The double zig zag exists to take price higher, so if it is going to play out I’d expect price to go quite alot higher than 2085 as expected by Lara especially if X completed at todays low.
That said, we’ve already hit the usual retrace fib so I’m keeping an eye out for this current wave down morphing into a 5 followed by a 3 up.
I’d be very surprised to see it retake 2100. The bear market trend-line sits just beneath.
I’m not how reliable equality is in WXY’s but if X ended today, Y = W @ about 2008
EDIT:
I’m not sure how reliable equality is in double zigzags but if X ended today, Y = W @ about 2008.
Will eventually learn to type in English 🙂
Did you mean 2080? Or perhaps 2108?
Lara, how common are combinations in second waves as opposed to a,b, c zig zags?
This is s double zigzag, not a combination.
It is important to note the difference. Both double zigzags and combinations are labelled W-X-Y, but they are not the same.
Double combinations may have only one zigzag within them. The other structure in the double must be a flat or triangle. Or it both could be a flat for a double flat, which is essentially the same as a double combination.
The purpose of double combinations is to take up time and move price sideways. So they normally have deep X waves and overall are a sideways movement, not a clear slope.
Double zigzags are very different. They are related to single zigzags and should have a clear slope against the prior trend. To achieve this purpose the X waves are normally quick and shallow, and the second zigzag in the double moves well beyond the end of the first to deepen the correction.
When the first zigzag in a correction (particularly a second wave correction) does not move price deep enough then consider a double zigzag.
Double zigzags are pretty common.
Triples are very rare.
Another example of why it is so difficult to trade 2nd waves.
The fact is that unless you are prepared to book profits intra-day, this market has been very slippery for bull and bear alike. Yesterday and today’s price action powerfully illustrated that reality.
Or this?
Doesn’t change the importance of 2,074.79
I think this is an impulse!
It certainly could be.
The third wave would be either complete or close to it.
It has shown some increase in momentum beyond the first wave, but not much (5 min chart posted above)
Perhaps gap will be filled in the last minute of trading.
Either way it looks like we are set for at the very least an initial bounce tomorrow.
I continue to sit tight. Have a great evening everyone!
Yesterday’s big daily up candle got completely wiped out today with a down candle…
No idea what the count is, but I know the candle pattern is very bearish.
add to that…someone’s earlier comments about 84% of the traders out there are bullish right now. That’s typical of end of wave 2 sentiments….
Wasn’t that bearish?
Todays candlestick isn’t coming after a long rise, not at the end of a clear uptrend. So the candlestick pattern here if it turns out to be bearish (and so far would be a piercing pattern) should not be taken as a reversal pattern.
Because there isn’t much of a trend to reverse.
At least, that’s my reading of Nison.
That comment was revoked. Peter, who wrote it, later wrote It should have read “traders are 84% bearish.”
He amended that comment. He meant to say “bearish”
VIX does not seem to reflect it….
FWIW, Transports fully closed opening gap from yesterday and posted a bearish engulfing candle today.
I did mean to type 84% of traders right now are BEARISH (which of course is bullish). But, agree with Mr. Vo that the candlestick is a bearish Harami. Came up from 3 days positive, then changed color to red, and is a Harami = bearish sign at least for the short term.
Of note – the Dow made a new high in the April 20th time frame…but the NYSE, SP500, Nasdaq did not.
I’m not sure exactly how the 84% is calculated, but hopefully another zigzag higher from this X wave low today (if thats what it is) will help bring that percentage down.
2nd waves are obviously there to turn bears into bulls so that percentage supports the idea Minor 2 is not yet over.
Inter-market divergences continue. The harami for SPX was not duplicated in DJI which took out yesterday’s low…
Todays candle could be a large Harami
Pattern: reversal
Reliability: low
Identification
A long white day is followed by a black day that gaps down and is completely engulfed by the real body of the first day.
The Psychology
In an uptrend or within a bounce of a downtrend a long white day occurs. The next day’s gap down comes as a surprise to bulls who thought they were sitting on a great position the previous day. Reliability of the bearish Harami is low, so a weak following day is needed for confirmation.
A harami, yes. Thank you John. Perfect.
Looks like bears loosing dogfight over open gap from yesterday…then again, could be just a fourth wave before the last leg down…
Div on UVXY on that last pop lower – possibly signalling a reversal.
1min RSI has been signalling the same for a few hours
VIX closes close to high of day. Showing more short term caution than is UVXY, which did dip a bit at the close.
A final pop higher tomorrow would be a trader’s dream… 🙂
So this is what I have so far today for the drop.
A chart of the prior rise as a zigzag is posted below.
So far for this drop the structure could be either complete or very close to it, the last fifth wave isn’t yet confirmed as over.
A new high above 2,074.79 is here crucial. That is the low of minuette (a).
A new high back into minuette (a) price territory could not be a fourth wave correction of an unfolding impulse, as then it would be back into first wave price territory.
So a new high above 2,074.79 tells us the move down today would be a three, and would be complete. That would indicate that minor 2 is not over and is moving higher as a double zigzag.
Now if we get some upwards movement here that is larger than the tiny corrections within minuette (c) and it remains below 2,074.79, then it could be a fourth wave correction of an impulse unfolding down.
Which means that minor 2 could be over and minor 3 could be beginning.
This morning (it’s my morning anyway) it is too early to tell exactly what this downwards structure is. It could be a zigzag, or it could be an impulse.
Click on chart listed below: Head and shoulders I mentioned earlier, hope you can see it Ok…left blue box is Left Hand Shoulder, top blue box is the Head, right blue box is Right Hand Shoulder (top of a “b” wave). Or top of a wave 4, top of a wave 5, top of a wave b we are seeing now.
Just don’t want it to go above (by much at all) yesterdays’ high of 2084.09 although it can certainly test it again over the next few days. If H&S pattern is true then the downside target just based on the H&S is about 1956.69. But again don’t want a close much above 2084.09 as it will invalidate it.
Chart looks like you are also on IB – my instructions were of use then after all 🙂
Yes, thank you.
Open gap from yesterday not as yet closed but we are close. If we close it we are most certainly going lower….
Biggest cash dump of the day underway. Let’s see how the bears respond…
In response to Rodney – all “old style” technical stock patterns fit nicely into Elliot Wave counts. Take the Dow theory for example, it has the:
-Accumulation phase
-Public participation phase
-Distribution or panic phase
Where the ‘accumulation’ phase is a Wave 1
Where the ‘public participation’ phase (most everyone) is a Wave 3
Where the ‘distribution or panic phase is Wave 5 into the A-B-C correction. Elliott matches the Dow Theory really. Mr. Dow just didn’t get it as detailed as Elliott did.
Same with the current Elliott wave ending diagonal triangle shown on this last run up into the high of April 20th, 2016 on the daily SP 500 chart. What is it called in a technical chart pattern? A wedge.
Same with head and shoulder patterns: if an inverse head and shoulders for example (an overall bottom), the left shoulder is a wave 4 down; the bottom head is wave 5 down, the right shoulder is wave 2 bottom (or a wave B). The inverse head and shoulders is confirmed when it breaks up past the top of wave 1…just as it is considered a breakout of the inverse head and shoulders to the upside.
You can take any common stock pattern and there is an Elliott wave pattern for it, which only makes sense when you think about it.
Perfect. Couldn’t have said it better myself, so I have nothing to add 🙂
Yes it does make a great deal of sense that we should see EW withing classical chart patterns.
What I am looking for is an edge such as Elliott wave confirming or invalidating a classical technical analysis pattern as it is forming. For instance, based on EW, can we tell early if the potential H&S will actually see a break of the neckline? Or, based on EW can we say something about an island reversal etc.?
Thanks for the response. Appreciated.
In the case of H&S: the right hand shoulder is usually a second wave correction. The following third wave down must meet the rule of moving beyond the end of the first wave. So a new low below the low between the head and RH shoulder meets the rule.
Which is also about the same time the neckline is broken.
So it depends on the exact price points and the slope of the neckline.
Island reversals are probably about the same in EW terms; left hand side end of third wave, head end of fifth wave, right hand side end of second wave.
So the same price point for the low of the first wave down from the head applies. That needs to be breached for a third wave to be underway.
Interesting strategy by the bears. They are responding to the banksters’ pushing the market higher on very low volume so instead of aggressively selling the market outright, they are selling the cash dumps…this could be a very protracted stair-stepping affair until we get some clarity…
anything like this?
For the downwards movement today that is how I’d label it, yes.
For the upwards movement I’d move the label for b to the first low after a.
I was wondering if you kept running counts at lower than 1 hr (as I often am playing around with 5 and 1 min). There is the answer!
Sold 20% UVXY @ 13.90 – now at 70%.
When price goes below 2054 I’ll relax a bit more. If it can do it before exceeding 2085 it would be an absolute gift.
Still think this might only be wave (a) of an ABC (x) wave
Lara has a fib line on her chart around 2066, so maybe this is the whole deal???
or 3 wave has kicked off
Yeah – I’m keeping an open mind.
We are still in the base channel of the move down so I’m not getting too excited yet.
Div with UVXY (UVXY has shot higher than the last low). Maybe there’s still a bit of gas left in the tank.
I was expecting a bounce – just sitting on the fib. If it breaks down from here we could be in for a ride.
Sold another 20% @ 14.07 – I might regret it!!
Now at 50% – gonna let that ride until I know exactly what is going on.
Div on 1min RSI but that might resolve itself – If we break below the base channel I will buy back in.
Somebody bought a ton of UVXY at around the 12.80 low this morning. The folk that aggressively sold short at around 13.20 may have already covered…next basing area is 15-16.50…let’s see if they cover today…
Strange market action. If this reversal had happened yesterday I would have immediately callled it a false breakout from a triangle formation. A day later?
Who the heck knows…!
Lara – still need to wait util 2039 to confirm 5 down or is there a higher confirmation?
Thanks!
Below 2054.25 would give price confirmation that the move up from 2039 was corrective (so will be fully retraced) imho. However it doesn’t tell us whether we’ll get a higher high above yestedays close first.
Looks like we will fill the gap from yesterday.
VIX trading at higher value than UVXY is novel!
Fascinating that even those of us who are bearish are looking with some suspicion at this initial decline, quite certain that we have another move up…. 🙂
Not me..
But…. unfortunately the invalidation point for an X wave if this is a double zig zag is 2039.52 (not really a written rule – but Lara says it should be so that’s good enough for me) – though I would get mighty suspicious before then.
We may get a candlestick or more outside the channel lines of the current correction to Minor 1. If I recall properly, it is not uncommon for X waves to exhibit such behavior. Thus, breaching the hourly channel now would not conclusively indicate Minor 2 is over.
Yep I’ve seen the 2nd zig zag of a double zig zag go out of the 1st zig zags channel almost every time. I often use that as a guide that the X wave is in progress (like now).
Whilst price remains above 2064.12, this could be a 4th wave but it is starting to look way out of proportion with what would be W2, so I’m starting to think we’re either in X for a double zig zag or we’re at the begining of Minor 3 (latter less probable atm imho)
Third cash dump underway. Will this effect a reversal to the upside…or on to new lows?!
Olga –
Been doing this for 38 years, but not smart enough yet to figure out how to copy my charts off the computer yet albeit I’ve just switched to a new data/trading platform system.
The Left shoulder is the April 1st, 2016 top and a top of a 3 in Elliott speak. The head is April 20th top, a wave 5 ending. The Right shoulder (maybe/and/or forming) is yesterday May 10th’s top, which would be a “b” wave. All on the S&P500 daily chart for the best view.
Top of III wave was May of 2015, we are in a long multi year corrective wave IV, taking at least all of this year yet and into 2017 to finish. Exception is (aren’t there always) if price action makes a quick/sharp plunge to complete IV in a 1987 type drop to give relief.
More interesting my long time work is showing 2022 to be a bad time. Either the wave V top and plunge down of the Grand Supercycle, or could be the bottom of the plunge from Grand Supercycle wave V. This goes back beginning in the year 562 B.C., ties in with the beginning of the USA stock market in 1789 (started in Philly, not the one in 1792 in New York) which is beginning of Grand wave of the United States, ties in perfectly with the 1933 bottom, end of Reagan’s era 1988, off 1 month of the 2000 top, and other key points in time. Will write more on it another time maybe….just wanted to provide a counterweight to Olga’s 1 minute chart 🙂
Some browsers will let you save a screen image by right-clicking and selecting “view background image”. You can then again right-click to save that image in your preferred format. It would be great to see your charts!
I think Olga is fairly astute on computing matters and could also tell you how to post your charts.
Peter,
That is all quite interesting. Thanks.
Is the H&S pattern you describe above a single occurrence? Or do you have more data and examples suggesting how head and shoulder patterns are commonly related to Elliott Waves? Thanks for the posts.
Thanks Peter, Very interesting. Please do post more often.
Re charts: On my platform (interactive brokers) on the chart of interest you click File then Save As Image.
Will not be exactly the same on your platform, but there is usually some way of saving the chart image as most traders want to do that.
I think Lara would also be most interested in seeing what you are seeing long term (as would the rest of us) so if you can work it out we would all appreciate it I’m sure 🙂
The whole picture created by posters here is very useful – everyone has their specific areas of expertise.
My dearest Olga,
You’re breaking my heart. You never asked me to post more often. Huh.
You can tell me. I am not a doctor.
(Long day. Too much time on hands.)
Yeah… but TBF you do post more than once a fortnight 🙂
😀
Yes, please post more, I love this big picture stuff.
A screen shot should make it possible to share a chart. A google of “screen shot” and your computer os should give a option or two.
Peter, I would be enormously interested in seeing a chart of your long term analysis. As I’m sure all others here would be too.
2022 could possibly be the end of a huge super cycle Y or C wave as per my main bear wave count. Eight years in total… yep. That looks entirely possible.
With Elliott wave price is easier (not at all easy though) to figure out, but time is much harder. And so cycle analysis in conjunction with Elliott wave may be very powerful indeed.
Possible head and shoulders top pattern now showing on the daily SP 500 index. If correct then entire wave up from Feb. 11th, 2016 low is a corrective wave X type forming a double zigzag type formation from the May 18th, 2015 high. And last top we just had was a ending triangle formation. So Laura should be correct a good sized downward motion to take place. Only concern is 84% of traders are bullish as of today.
Or… Lara’s count is correct 🙂 (and is a fair bit more bearish than a double zig zag – albeit atm I’d take either!!).
Many thanks for your input Peter – if you could post a chart it would be much appreciated. Personally I’d be concerned if 84% of traders were bearish.
Sorry, typed the wrong word – 84% of traders today are BEARISH.
Certainly not reflected in the VIX. I have often wondered if these sentiment measures distinguish “traders” from everyone else.
Is anyone else considering a series of first and second waves…?!
‘Is anyone else considering a series of first and second waves…?!’
If you mean short term … then always 😉 🙂
Until we go above 2082.46 that is a serious possibilty.
We’ve got 5 downs, 3 ups atm with lower lows.
Yeah – we considered that before here.
Alot of bullishness is hidden in shorting bearish ETFs if I remember rightly.
Joseph I think was one of the authorities on that subject (I certainly aren’t)
I have heard it said, “The market doesn’t repeat itself. But it rhymes.”
We have a H&S pattern going back to the end of March. We also have a very large H&S going back to October 2014 and many more in between. The market is rhyming. I think EW people call it fractals. That is why we have also noticed some symmetry going on. Bottom line – it is all being set up since the topping process began long ago. It is about to enter the last phase(s) of the bear process.
It all makes sense to fool the most people. In 2000 it was a more sudden and abrupt top. Ditto for 2007-2008. This time is different. It has been long and slow and building. The coiling process is continuing until it snaps. This market will burst. It will not be like letting the air out of the balloon slowly. It will burst.
I am afraid you are right about that Rodney. The reason the process has been so slow and torturous is that it is being opposed tooth and nail by those terrified of what yet another market collapse is going to do to the financial system. Had the system been allowed to cleanse itself of its excesses during the last crisis, we would be well on our way to a real recovery. They have not only delayed the inevitable, they have made it considerably worse I think…
I absolutely completely agree with that sentiment Verne.
Our esteemed leaders are supposed to be so smart.
I don’t think so.
If that was C of X, we should quickly go into the green as the impulse down unfolded swiftly and is already done…
UVXY did not make a new high as we hit today’s lows on SPX. We still have some upside over the next couple of days IMO… Probably will be closing in on 2100 at least…
There was divergence but it wasn’t huge on my chart – 13.43 then 13.41 on next drop lower.
I think we are in W4 of c of Minuette (a) of Minute X now but might be (b) of X or maybe X is now over (but I think that has lower prob atm).
We could also still be in Minute (a) – so minuette (4) of Minute (a) of Minor (ii).
Price is ok, but time needs to extend so we’ll likely see alot more rangebound movements even if they swing wildly like today. I’d be very suprised if X is over already.
Chart
Thanks for your input, as always…
No worries – I may be wrong (I certainly don’t want to mess up the entry on your UVXY short!) – but in any case above the (b) high 2082.46 you have your confirmation that you are good to go – though if X is a flat / expanded flat we may still make new lower lows afterwards.
It’s always a gamble whether we have seen the whole move or just part of it.
Just be careful, because if this is a 4th wave to make the wave up 2039 a 5 wave structure (W(a) of a Zig Zag) – then we will still have a B wave down to go before another 5 wave structure (c) up….. It’s never easy!! (and that could fool alot of people so has a good chance of playing out imho)
You’re not messing up anything, trust me 🙂
Always learning from the regulars who post on this forum…
Especially Doc, who reminds me that a laugh is all you need to set your mind straight…
I have not shorted UVXY yet, I’ll probably do that when we make a new low today, when it gets as close to 13.40 as possible. I’m thinking it’s going close to 12.50 over the next day or two…
Looks like that impulse was just a small three down. We should see new low now per your chart labels for five down. Thanks for the visual…
Is starting to take a bit too long – maybe that leg down was done and we’ll just drift sideways. If price goes complex I won’t even attempt to count it at low degree…. it’s hard enough at higher degree.
Maybe a SOH moment for a few hours. Mr Market has some time wasting to do.
The market is falling steadily against repeated huge cash infusions. Very strange things happening the last few days…
Below 2074.79 means five down three up…
Looks like small degree third down underway.
Looks like that sharp move up was the b wave of x, and now we’re going down for the c of x…
I have a feeling all corrections of this down move will be sharp, like this b wave; almost fully retraced to yesterday’s close. The upcoming y wave, minor 2, and when the time comes intermediate 2…
If that was the B wave it was over within 10 minutes and coincided with the oil numbers released at 10:30 eastern today
nibbled some UVXY at 12.97
took it off at 13.30 for a quick scalp
Nice trade!
That is the way to trade that animal; unless of course you have the patience of Job… 🙂
I’ve done it both ways and while the quick scalp is definitely more gratifying, timed right (much easier said than done!), the patient trade will give a fatter return…
I will have to wait for a clear of 15.50 to roll to a short term options trade profitably…tick, tock…tick…tock… 😀
Remarkably, yet another 52 week low in UVXY…
Looks like we are headed higher…
Massive cash dumps to counter impulse down. If there was ever an example of banksters fighting an impulsive wave this is it. This ought to interesting…
Looks like the next move up is coming
Well, that was a clear five down this morning so let’s see what develops next…
Yup all is good with the economy…Fitch downgrades Gap rating into junk on sales woes
FTSE 100 , asked for help…
The second leg of expansion is okay or needs to move it to (b)?
I’m not sure what your question regarding a “second leg of expansion” is.
It looks like the B wave may be incomplete. Maybe a nine wave triangle?
Wanting to see an X wave down today so I can dump some of my position (currently at 90%) and get a better entry. My worse case scenario would be straight up from here so you can bet the farm that’s exactly what will happen! 🙂
If we get a decent move down soon then it being in 3 waves will be absolutely key. If it is 3 waves it is very likely an X wave, otherwise it could be the kick off of Minor 3 (less probable but also possible). Mr Market has rewarded handsomely anyone who is not yet short imho – the dilemma now is, will we go straight up, down then up higher or straight down…. which require slightly different trading approaches for best entry – what fun eh 🙂 🙂
Assuming the overall count goes to plan, we should have already totally forgotten about any current frustration in a couple of weeks time.
I think you are going to get that X wave this morning…. 🙂
I think the bear market trend line will once again mark the reversal.
Surprises to the downside. Everyone has their eyes on that bear market trend line. The surprise would be to turn and head down before we touch it.
Rodney,
I agree with you as rationale and logical trade for bears is at the failure of the trend line, but I suspect that Mr. Market will pull a smart one ahead of that test
Rodney,
Can 2084 be considered close enough for the bear trend line from EW perspective?
Elliott Wave theory does not necessarily or directly speak to trend lines or other TA. Price action is paramount and does not need or heed other indicators etc. We have reached the 61.8% retrace and that is a reasonable price conclusion to Minor 2.
Particularly ahead of a third down at primary degree; one would expect the draw to the downside to be strong…
If you look at the symmetry on the S&P chart, it calls for a multi week of downtrend since last year we had a symmetry with respect to market moves..14 weeks down, 10 weeks up, 14 down, 10 up and now expecting 14 weeks down…
I plan on sitting through the pain unless UVXY breaks 10, at which point I will cry “Uncle” on my shares….we may get close…. 🙂
If UVXY reacts as it should (predicting a turnaround) then it shouldn’t get that much lower than we are now. If it takes a serious dive near invalidation either it has broken or it is telling us to expect that we’ll invalidate imho.
Note to self: on that same subject – I was very suspicious that UVXY the other day wasn’t reacting how it should, but I still traded based on the EW count (as the larger EW context had confirmed with price).
Lesson learned – in future when that happens I intend to just SOH until things clear up. Things haven’t turned out too badly for me (yet!) but I’d still be in a better position if I had just SOH.
Obtaining precision (consistently) in this game is almost impossible, but if we aim for it then we might at least get half decent entry points.
DITTO in a much bigger way. That is the first time I have used all caps on this blog. My entries based on SPX were excellent. My entries based on VIX derivatives has been abysmal.
That being said, I am not without reasonable hope. If we begin Minor 3 soon, it should all come back plus more.
Yep I noticed the divergence too but downplayed it. It is always a challenge to know whether to go with the EW count or the volatility signal. I was tentative for this reason at the last break of the upper BB but it clearly remains a powerful signal for a trade to the downside in volatility. Live and learn! 🙂
X wave or a larger b wave today. I think it would be good to see three waves up on the daily chart.
When it comes to sentiment and momentum, I need to remember that we are about to begin Minor 3 of Intermediate 1 of Primary 3. I am thinking the big momentum and sentiment moves will begin in earnest in Intermediate 3 of Primary 3. Until then, perhaps volatility will be relatively muted. I am also thinking that Intermeidate 2 will see a strong increase in bullish sentiment where the masses will be saying, “Okay, we survived this bear market move (to perhaps 1780) and now is a great buying opportunity.” Thus, the masses will be more bullish than today even though we will be at lower SPX levels.
Well this is just something I have been thinking about especially as it relates to volatility and I read Vern’s questions / concerns. I need to improve my understanding in this area as it relates to trading.
Good luck and may all our efforts prove prosperous.
Yeah – I can only count 3 up so we would need to trace out a further 4 & 5 up before the B wave would play out. This move down could be W4 – below 2064.12 (poss W1 top) would elliminate that and suggest an X for a double zig zag.
Certainly a simple 5-3-5 zig zag would be more time consuming from here and possibly fool more people so I’ve def got me eye on it!
Previous 4th ended about 2071.28 so that may be a good place for this wave down to stop if it is a 4th wave.
Yep. Lara pointed out that momentum can be slow to get going during these primary impulses down…
Interesting. Transports (IYT) appeared to be bucking the trend this morning but then did an about-face and headed lower as well…
Another thing to keep in mind is that interventions in the equities markets have been extreme, distorting price discovery mechanisms, and in my opinion severely skewing risk and volatility measures. UVXY has now made a new 52 week low ahead of what EW analysis expects to be an approaching minor third of an intermediate one at primary degree. Strange times indeed.
US Retail Stocks down 3-4%+++ across the board after Macy’s reported this morning. Big Revenue Miss & Lowers future earnings below estimates.
I don’t understand why there is not more of an impact on the indexes???
There goes a portion of the part time Job Growth.
Next is the restaurant & Bar businesses
Joseph,
I am very confused as earnings are going down, layoffs, now retail is getting hit….who are these buyers that keep pushing the markets higher. This is worse than 2000 and will end up very bad for majority of folks. I can’t understand who is buying the market at these levels given the fundamentals…
Banksters!
😉 🙂
CB’s??? – they no longer even deny it (and maybe some mom and pops forced out of the banks into high risk by miserable rates).
The band must continue to play on the Titanic – all smoke and mirrors imho…
Not much volume… so it doesn’t take a lot to move the markets.
But that would work both way’s once the momentum changes. Remember, there are a lot of momentum players currently. Including the computers.
Momentum trading works until it doesn’t!
No question the indices are being propped up.
Look at the carnage:
Disney down over 5% premarket
Staples and Office Depot both hammered 3% or more on the scuttled merger
The above mentioned retailers and several more down in sympathy makes the indices trading at these levels very strange indeed…
Yeah but Bernie had a victory last night! The whole world is excited and shares his optimism. (Just joking of course,)
I am a bit curious as to why we saw greater selling pressure and downside momentum at the end of minute three and four of minor C of intermediate B of primary two. While momentum and volatility does fluctuate, the expectation for the completion of a minor wave in a primary third down would in my view be that it would at least equal, if not exceed that in a corrective move at similar degree. I realise the completion of minor one is coming at much higher market prices but nonetheless, even other measures like the A/D ratio was relatively muted when compared to the January and February lows. There is still a bit of a mystery here I think. Something does not quite add up….I think Mr. Market has a few more surprises up his sleeve.
If the wave count is correct, and I believe it is, what the volatility profile is painting is a portrait of a market in a state of full-blown insanity so far as its pricing of risk, reflected in the VIX, is concerned. The other option, which is contrary to an abundance of evidence, but which would justify the current expectation of voltility (for in the final analysis that is all the VIX is) is that new ATH are in the cards. I am more inclined to believe that we are witnessing an un-natural calm before the storm…
IMO it’s far too early in primary 3 to expect a strong increase in momentum yet.
In the last bear market the primary wave 3 there did not meet the momentum within primary wave 1 until towards the end of intermediate (1).
So far this one looks similar.
Most interesting. I guess history must be repeating itself! 🙂
Probably. It has a tendency to do that.
Vern,
I don’t think we are the only ones worried or unable to figure the market reaction. FYI, MaClellan Financial updates reflect the same confusion on this behaviour and in fact the longer this market goes up without a significant correction the risk compounds for longs.
BTW- your other guy must look like a champ for calling this rally 🙂
Indeed. Quite right about a few savvy market mavens scratching their heads about the latest moves; I have noticed it in the commentary. We know that the kind of manipulation we are seeing may muddle the waters in the short term but will not alter the larger picture.
Understand you’re mostly Elliott Wave, but there was a clear inverse head and shoulders on the 2 hour S&P 500 chart. Then a bullish engulfing candlestick on the daily two days ago now. The depth of the inverse is ~30 points which projects to 2095/2100. But can’t rule out what you said where Minor 2 could end early with the larger down happening sooner.
Thanks Peter for pointing out he inverse H/S with price target. That adds a little confidence to an expectation of a little more upwards movement to about that area.
I’ve just done FTSE analysis and that market looks a little clearer than S&P. So far for FTSE the correction is very shallow, so that looks like it may move higher before it’s done.
H Lara,
On the one hand it’s a bummer living down here at the bottom of the world, having to pad around in our slippers in the dead of night to check our charts, but on the other, at least we’re more likely to be home close to our screens when the action happens.
🙂 True
Can’t surf in the dark 🙂
Once again, you provide such a great analysis and communication of the analysis. Thank you for the level of research and detail you provide for this Minor 2. It helps me understand the overall picture.
Even though Minor 1 ended before we expected, I feel much more confident of this wave count. I was troubled by the ending diagonal idea. A leading diagonal as Minor 1 makes much more sense to kick off this Primary 1. This is going to fool a lot of people.
Thanks again and have a great rest of your day or night or whatever it is where you live.
As I look again, I realize you are not labeling Minor 1 as a leading diagonal. We still have the strongest momentum within subminuette 3 of minuette 3 or minor 1. It looks really good.
Thanks Rodney.
I’m torn now between waiting for a better entry, or just jumping in right here.
I think I’ll open a small position here just in case. And leave some equity to open another if price goes up some.