
Sideways movement was expected. A small red doji fits the expecatation for the session.
Summary: The probability that the upwards wave is over and the next wave down has begun is very high indeed. If the bear wave count is right (and it is supported by technical analysis), the target for primary wave 3 is at 1,423. Tomorrow may print a small green candlestick or maybe a doji as a small correction completes. It should remain below 2,077.52 and be followed by a fifth wave down.
To see last published monthly charts click here.
To see how each of the bull and bear wave counts fit within a larger time frame see the Grand Supercycle Analysis.
To see detail of the bull market from 2009 to the all time high on weekly charts, click here.
New updates to this analysis are in bold.
BEAR ELLIOTT WAVE COUNT
WEEKLY CHART
Click chart to enlarge.
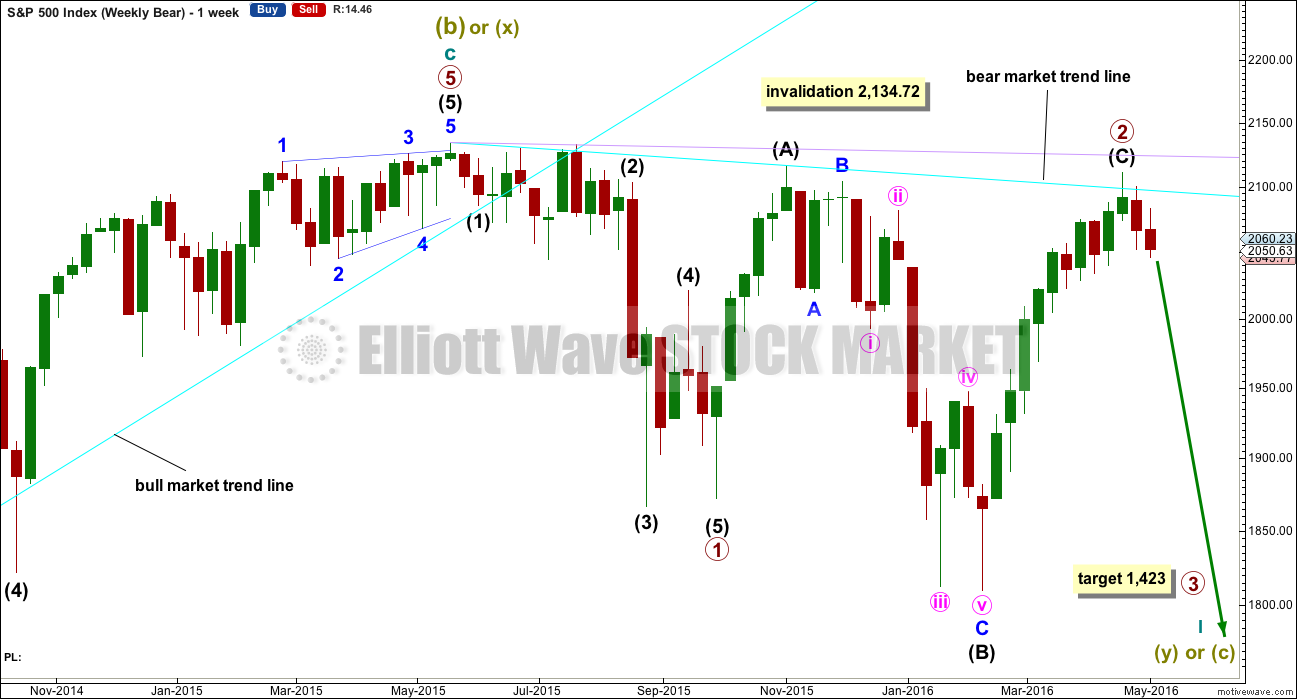
This bear wave count fits better than the bull with the even larger picture, super cycle analysis found here. It is also well supported by regular technical analysis at the monthly chart level.
Importantly, there is no lower invalidation point for this wave count. That means there is no lower limit to this bear market.
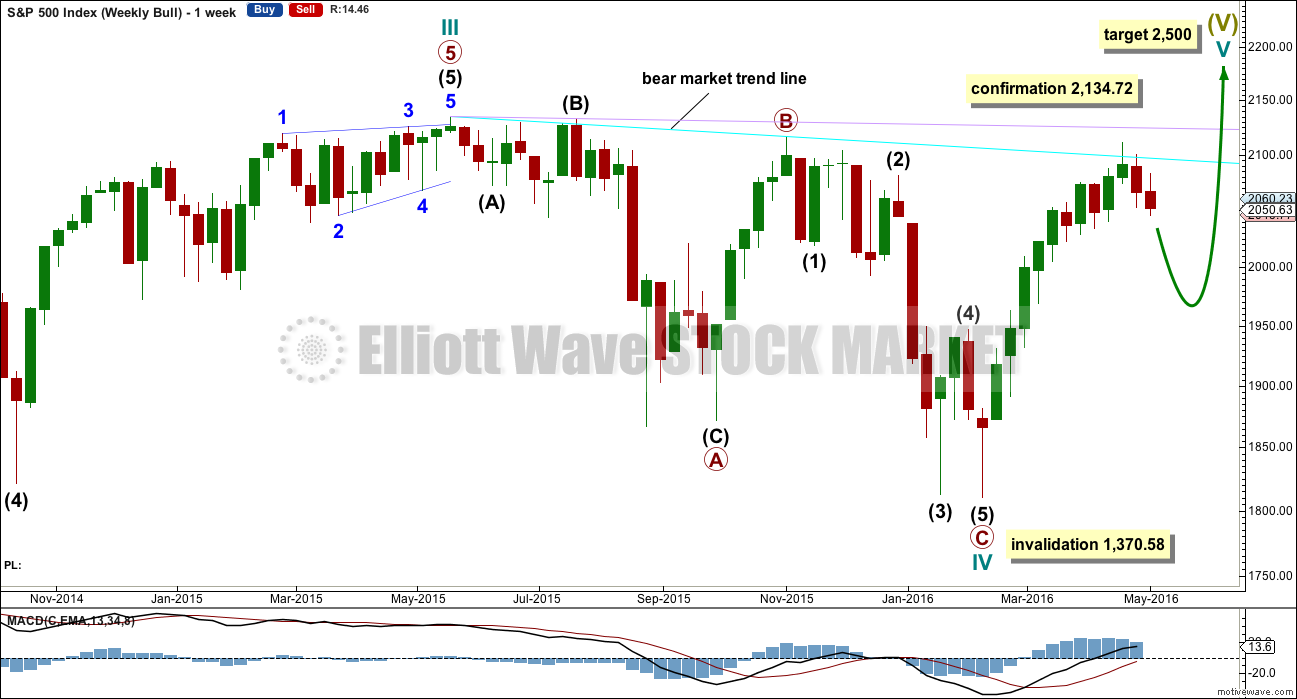
Primary wave 1 is complete and lasted 19 weeks. Primary wave 2 is either over lasting 28 weeks, or it may continue for another one or two weeks.
An expectation for duration of primary wave 3 would be for it to be longer in duration than primary wave 1. If it lasts about 31 weeks, it would be 1.618 the duration of primary wave 1. It may last about a Fibonacci 34 weeks in total, depending on how time consuming the corrections within it are.
The long upper shadow on the green weekly candlestick at the last high is bearish. Last week completes a bearish engulfing candlestick pattern.
Primary wave 2 may be complete as a rare running flat. Just prior to a strong primary degree third wave is the kind of situation in which a running flat may appear. Within primary wave 2, intermediate wave (A) was a deep zigzag (which will also subdivide as a double zigzag). Intermediate wave (B) fits perfectly as a zigzag and is a 1.21 length of intermediate wave (A). This is within the normal range for a B wave of a flat of 1 to 1.38.
It is possible but highly unlikely that primary wave 2 could yet move a little higher. If it does, then intermediate wave (C) should end above 2,116.48 to avoid a truncation. Primary wave 2 would then be a very common expanded flat.
Primary wave 2 may not move beyond the start of primary wave 1 above 2,134.72. When there is some price confirmation that primary wave 2 is over, then the invalidation point may be moved down to its end. Price is the ultimate determinator. This is the risk while we do not have final price confirmation.
DAILY CHART
Click chart to enlarge.
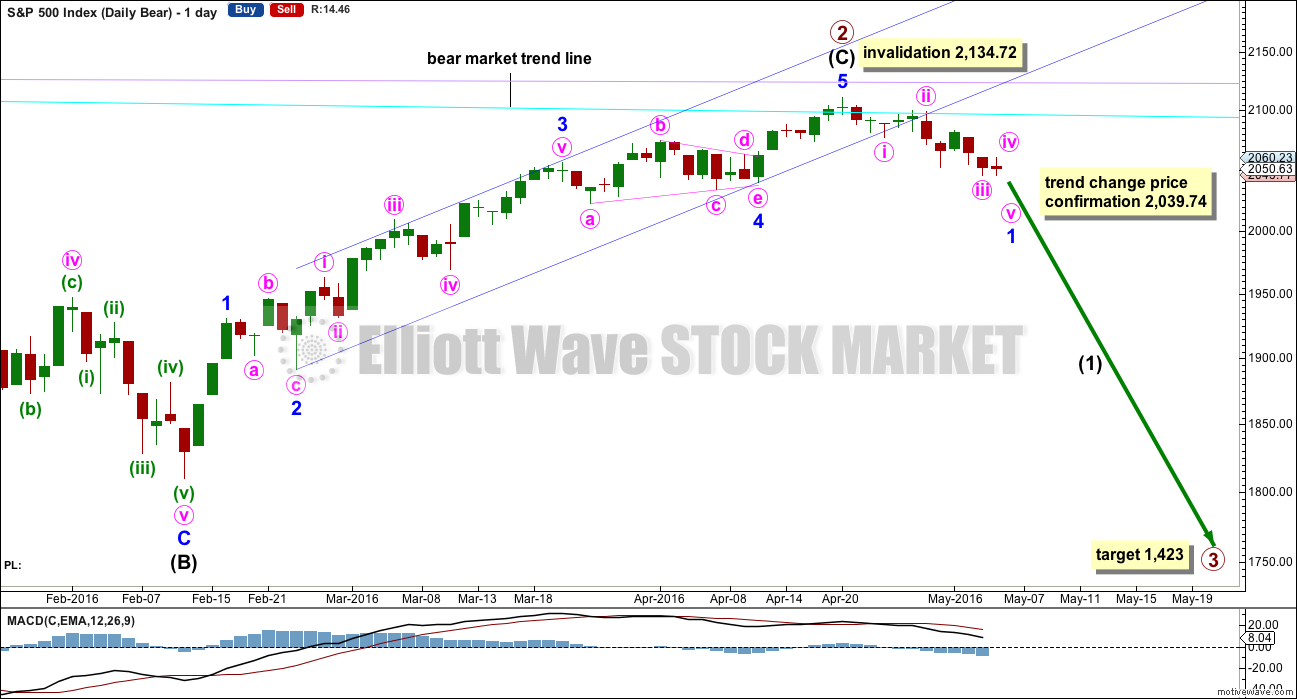
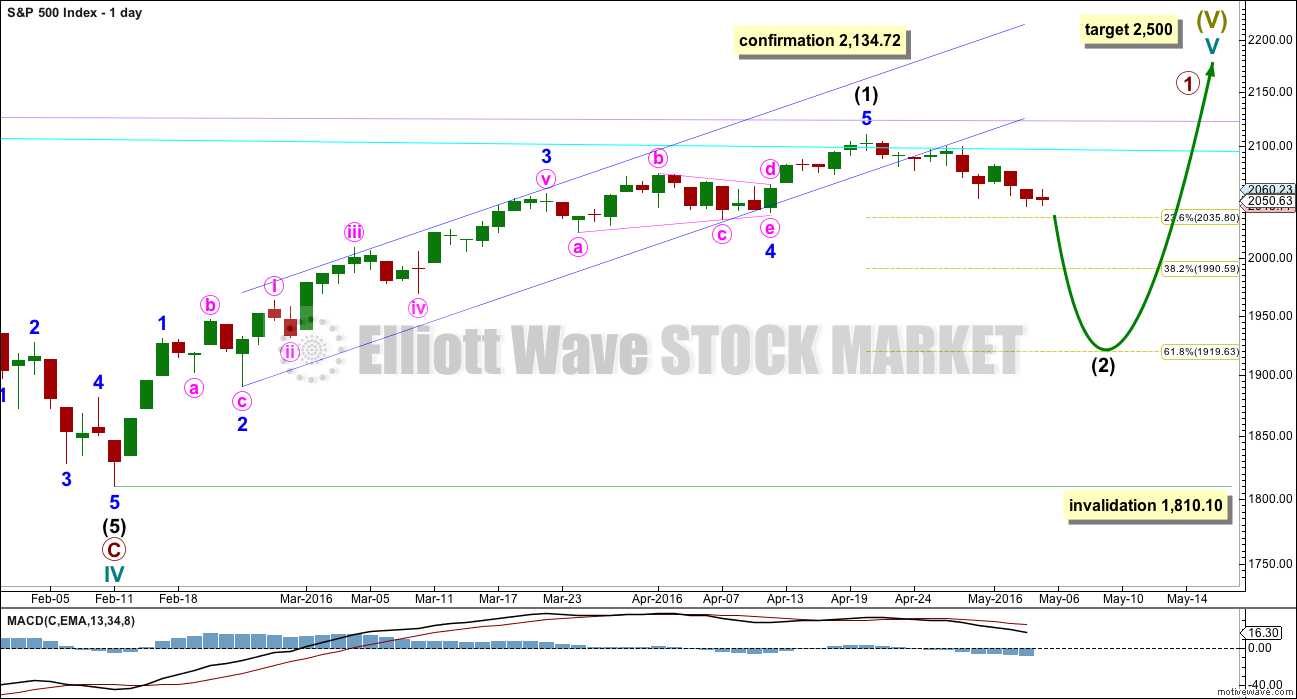
If intermediate wave (C) is over, then the truncation is small at only 5.43 points. This may occur right before a very strong third wave pulls the end of intermediate wave (C) downwards. Price confirmation of a trend change would come with a new low below 2,039.74.
The next wave down for this wave count would be a strong third wave at primary wave degree. At 1,423 primary wave 3 would reach 2.618 the length of primary wave 1. This is the appropriate ratio for this target because primary wave 2 is very deep at 0.91 of primary wave 1. If this target is wrong, it may be too high. The next Fibonacci ratio in the sequence would be 4.236 which calculates to a target at 998. That looks too low, unless the degree of labelling is moved up one and this may be a third wave down at cycle degree just beginning. I know that possibility right now may seem absurd, but it is possible.
Alternatively, primary wave 3 may not exhibit a Fibonacci ratio to primary wave 1. When intermediate waves (1) through to (4) within the impulse of primary wave 3 are complete, then the target may be calculated at a second wave degree. At that stage, it may change or widen to a small zone.
Draw the channel about the impulse of intermediate wave (C) using Elliott’s second technique: draw the first trend line from the ends of the second to fourth waves at minor degree, then place a parallel copy on the end of minor wave 3. Minor wave 5 may have ended midway within the channel. The channel is now breached decisively at the daily chart level. This provides some reasonable confidence in a trend change.
Because expanded flats do not fit nicely within trend channels, a channel about their C waves may be used to indicate when the expanded flat is over. After a breach of the lower edge of the channel, if price then exhibits a typical throwback to the trend line, then it may offer a perfect opportunity to join primary wave 3 down. At this stage, price may not move high enough to touch the dark blue trend line. It may find strong resistance at the cyan bear market trend line which is now just below 2,100. It looks like the typical throwback to resistance was quick and completed on the 28th of April.
Within minor wave 5, no second wave correction may move beyond the start of its first wave below 2,039.74. A new low below 2,039.74 could not be a second wave correction within minor wave 5, so at that stage minor wave 5 would have to be over. This would confirm a trend change.
HOURLY CHART
Click chart to enlarge.
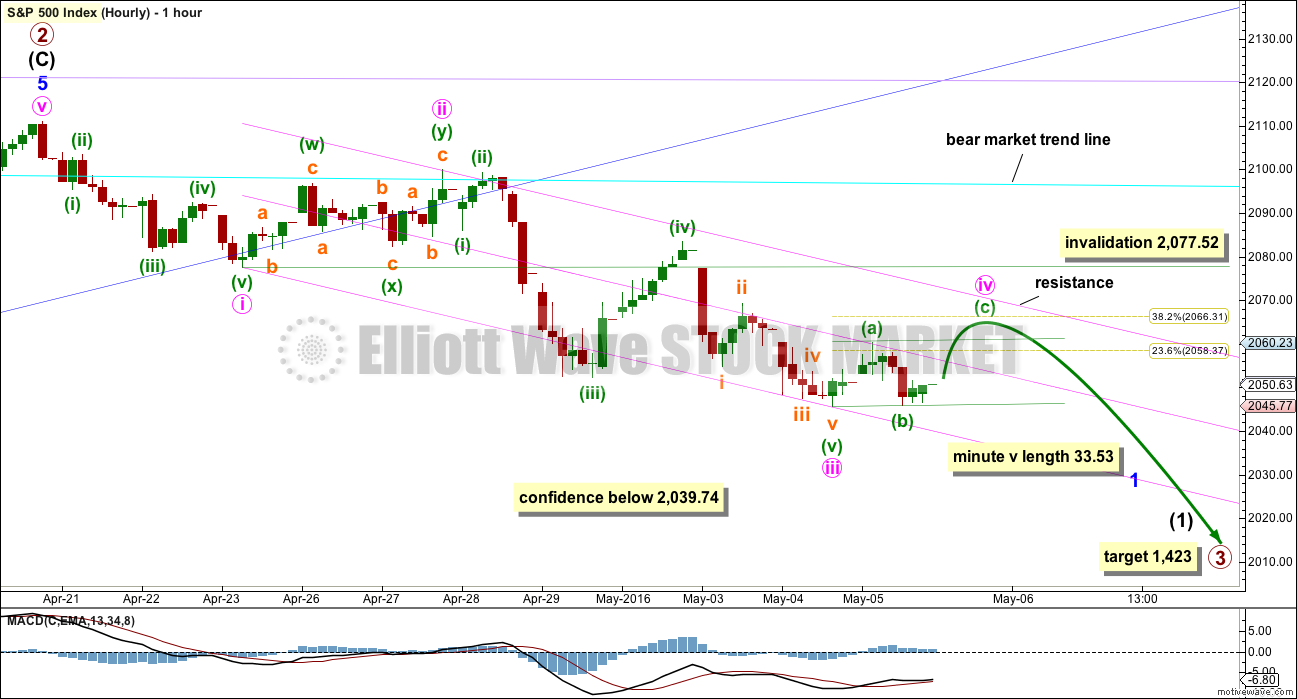
Minute waves i, ii and now iii may be complete within minor wave 1. Minute wave iii is just 0.09 points longer than 1.618 times the length of minute wave i. Minute wave iii shows an increase in momentum beyond minute wave i, and the strongest part is the middle of the third wave.
A channel drawn using Elliott’s first technique sees the middle of the third wave overshoot the lower edge. This looks typical. The upper edge of the channel may show where minute wave iv finds resistance.
Minute wave ii was a deep 0.67 double zigzag correction. Given the guideline of alternation, minute wave iv may be expected to be more shallow and a sideways type of correction such as a flat, combination or triangle. At this stage, all three options are open. Minuette wave (a) fits as a three on the five minute chart. Minuette wave (b) fits well as a three on the five minute chart and it is over 0.9 the length of minuette wave (a), so the minimum for a flat correction is met.
If minute wave iv is a running triangle or an expanded flat, then minuette wave (b) could move lower and make a new low below the start of minuette wave (a) at 2,045.55. A new low early tomorrow does not mean minute wave iv is over; it would more likely be part of the B wave within minute wave iv.
If price continues sideways in an ever decreasing range tomorrow, then minute wave iv may be a triangle. Triangles take time to unfold. If this happens, it may last another two or even three sessions.
If price moves upwards above the end of minuette wave (a) tomorrow at 2,060.23, then minute wave iv may be completing as a regular flat correction. If that happens, then it may be over relatively quickly and be followed by a downwards breakout for minute wave v.
If price moves sideways in a wider range, then minute wave iv may be unfolding as a combination. The first structure in a double may be a zigzag labelled minuette wave (w), over at the high labelled on this chart minuette wave (a). The second structure may be joined by a three in the opposite direction labelled minuette wave (x), over at the low labelled on this chart minuette wave (b). A second structure in a double would most likely be a flat correction labelled minuette wave (y).
If minute wave iv is time consuming enough, it may end when price finds resistance at the upper edge of the pink Elliott channel.
Minute wave iv may not move into minute wave i price territory above 2,077.52.
Stops may be set just above this invalidation point at this stage.
The most likely target for minute wave iv is the 0.382 Fibonacci ratio at 2,066.
Minute wave ii lasted for two days producing two small green daily doji. Minute wave iv may be expected to last one to three days to maybe produce one or two doji or small green candlesticks.
At this stage, a target for minute wave v downwards to complete the impulse of minor wave 1 cannot be calculated because it is not known where it starts. Minute wave v is most likely to be equal in length with minute wave i at 33.53 points.
The S&P can behave like a commodity during its bear markets in that it can exhibit swift strong fifth waves. However, this behaviour is seen more often for third wave impulses (the fifth wave to end the third is swift and strong) and during the last bear market did not show up until the middle to end of the whole bear market. I would not necessarily expect this tendency to show up here for minute wave v, but it is a possibility to be aware of.
ALTERNATE HOURLY CHART
Click chart to enlarge.
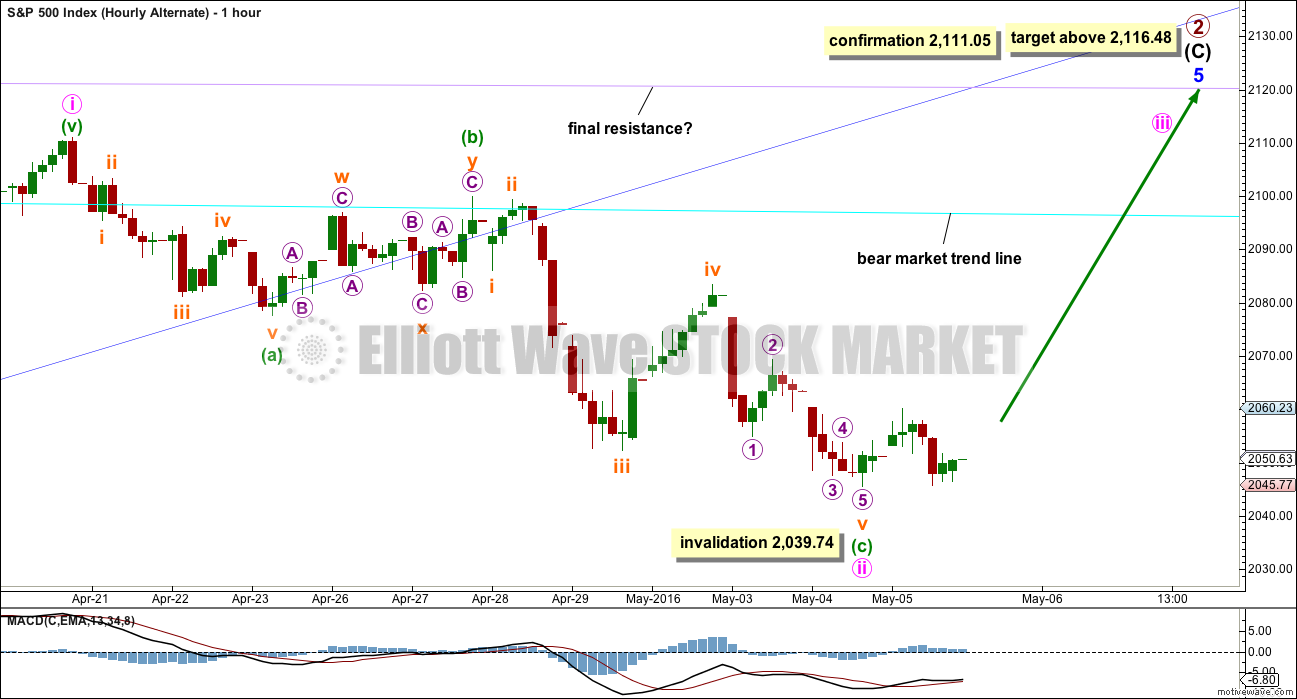
It is still just possible that primary wave 2 may not be complete. Intermediate wave (C) may yet be able to move above 2,116.48 to avoid a truncation and a rare running flat.
The degree of labelling within minor wave 5 is moved down one degree. The upwards wave to the last high may be only minute wave i within minor wave 5.
Minute wave ii may not move beyond the start of minute wave i below 2,039.74.
The problem of the strong breach of the dark blue channel remains. If minor wave 5 is incomplete, that channel should not be so strongly breached.
Within minute wave ii, minuette wave (c) is just 0.09 points longer than 1.618 the length of minuette wave (a).
This wave count requires a new high above 2,111.05 for confirmation. Classic technical analysis has reduced the probability of this wave count. The probability is low. Low probability is not the same as no probability; this wave count still illustrates the risk to any short positions here.
At this stage, a new high above 2,077.52 would invalidate the main hourly wave count and provide some confidence in this alternate.
BULL ELLIOTT WAVE COUNT
WEEKLY CHART
Click chart to enlarge.
Within primary wave C downwards, intermediate wave (2) is seen as an atypical double zigzag. It is atypical in that it moves sideways. Double zigzags should have a clear slope against the prior trend to have the right look. Within a double zigzag, the second zigzag exists to deepen the correction when the first zigzag does not move price deep enough. Not only does this second zigzag not deepen the correction, it fails to move at all beyond the end of the first zigzag. This structure technically meets rules, but it looks completely wrong. This gives the wave count a low probability.
This part of the structure is highly problematic for the bull wave count. It is not possible to see cycle wave IV as complete without a big problem in terms of Elliott wave structure.
Cycle wave II was a shallow 0.41 zigzag lasting three months. Cycle wave IV may be a complete shallow 0.19 regular flat correction, exhibiting some alternation with cycle wave II.
At 2,500 cycle wave V would reach equality in length with cycle wave I.
Price remains below the final bear market trend line. This line is drawn from the all time high at 2,134.72 to the swing high labelled primary wave B at 2,116.48 on November 2015. This line is drawn using the approach outlined by Magee in the classic “Technical Analysis of Stock Trends”. To use it correctly we should assume that a bear market remains intact until this line is breached by a close of 3% or more of market value. In practice, that price point would be a new all time high which would invalidate any bear wave count.
This wave count requires price confirmation with a new all time high above 2,134.72.
While price has not made a new high, while it remains below the final bear market trend line and while technical indicators point to weakness in upwards movement, this very bullish wave count comes with a strong caveat. I still do not have confidence in it.
DAILY CHART
Click chart to enlarge.
If the bull market has resumed, it must begin with a five wave structure upwards at the daily and weekly chart level. That may today be complete. The possible trend change at intermediate degree still requires confirmation in the same way as the alternate hourly bear wave count outlines before any confidence may be had in it.
If intermediate wave (2) begins here, then a reasonable target for it to end would be the 0.618 Fibonacci ratio of intermediate wave (1) about 1,920. Intermediate wave (2) must subdivide as a corrective structure. It may not move beyond the start of intermediate wave (1) below 1,810.10.
In the long term, this wave count absolutely requires a new high above 2,134.72 for confirmation. This would be the only wave count in the unlikely event of a new all time high. All bear wave counts would be fully and finally invalidated.
TECHNICAL ANALYSIS
WEEKLY CHART
Click chart to enlarge. Chart courtesy of StockCharts.com.
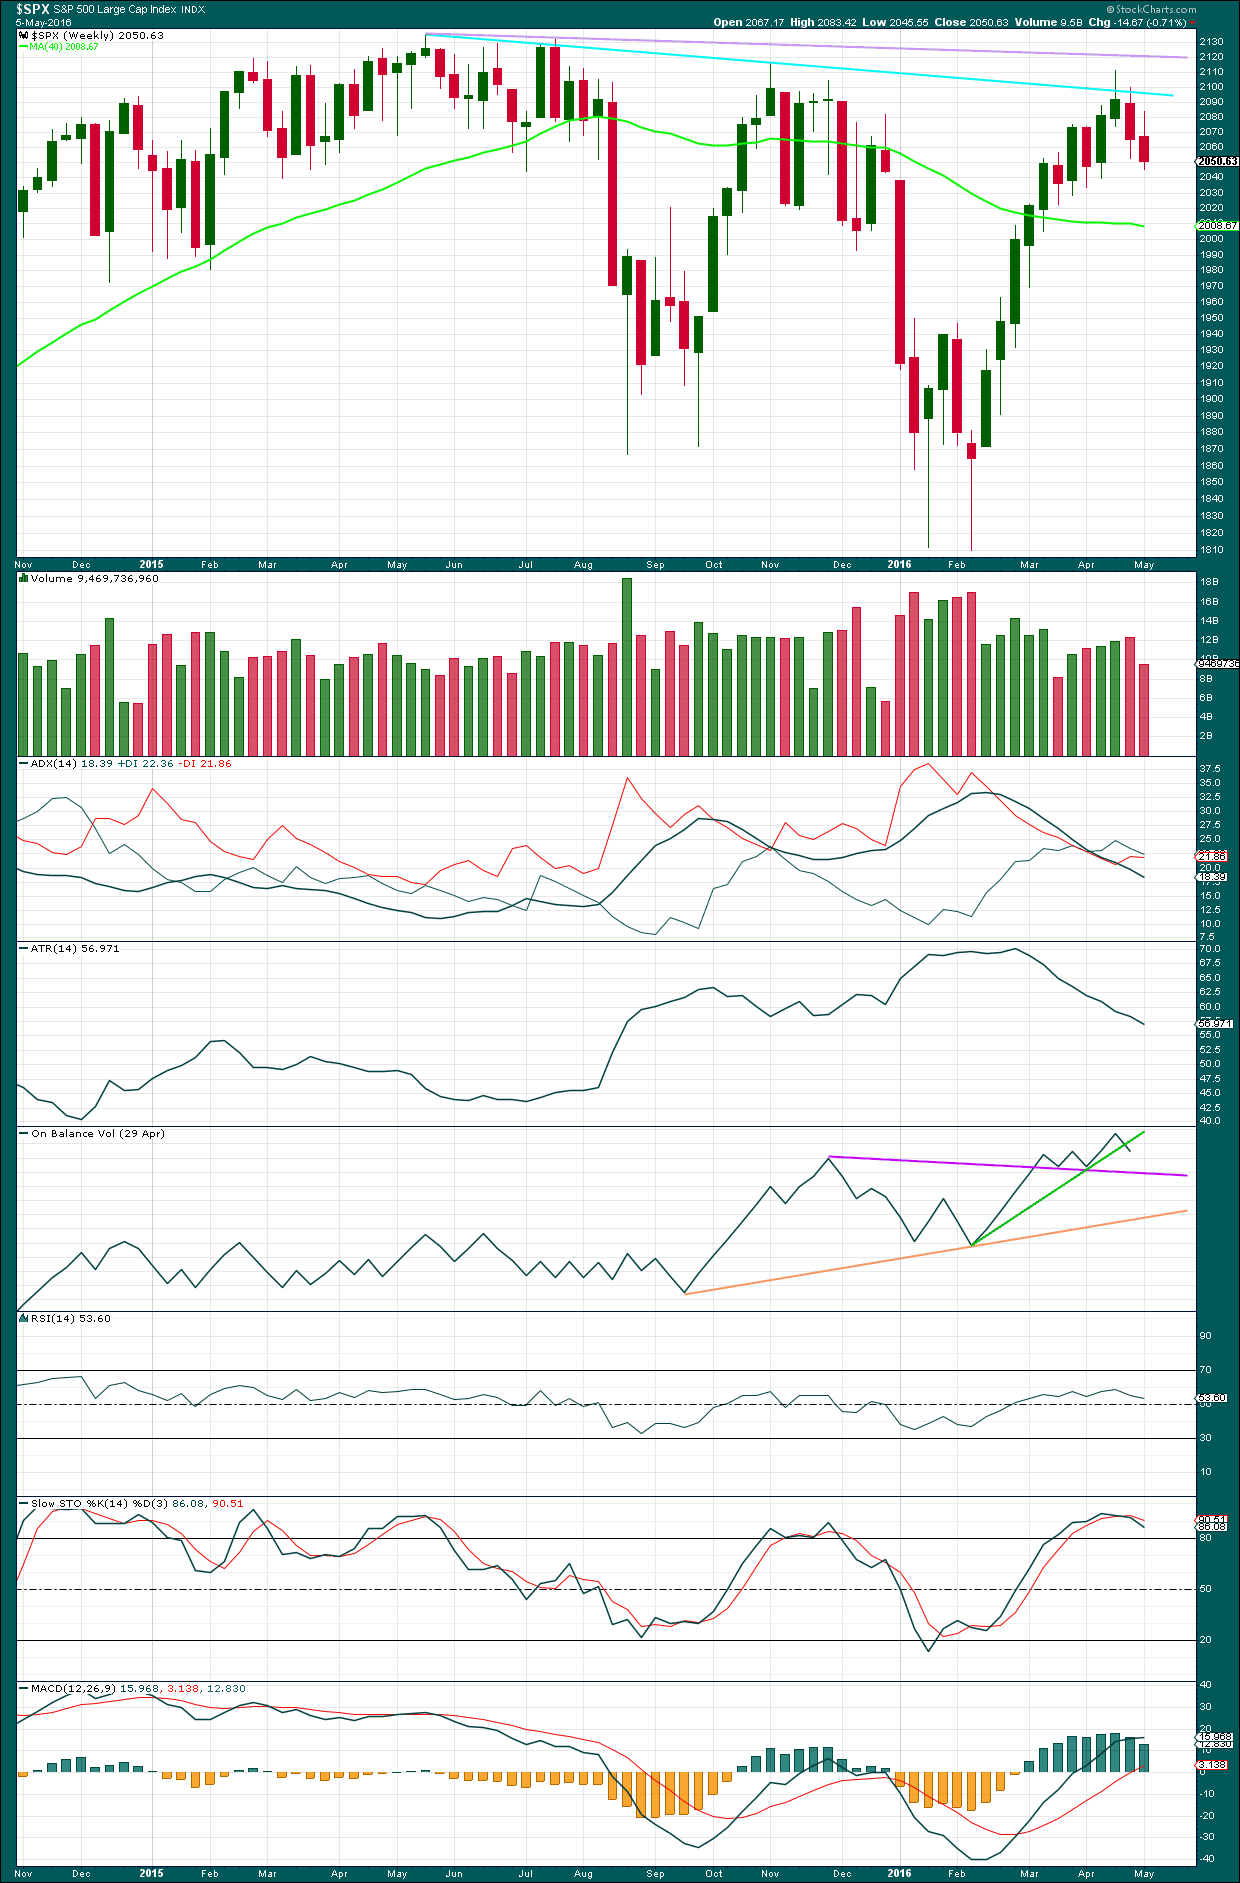
We have a bearish engulfing candlestick pattern at the end of last week. This has occurred at the round number of 2,100 which increases the significance. Volume on the second candlestick is higher than volume on the first candlestick, which further increases the significance. That it is at the weekly chart level is further significance.
Engulfing patterns are the strongest reversal patterns.
This is a very strong bearish signal. It adds significant weight to the expectation of a trend change. It does not tell us how low the following movement must go, only that it is likely to be at least of a few weeks duration.
There is a weak bearish signal from On Balance Volume at the weekly chart level with a break below the green line. A stronger bearish signal would be a break below the purple line. OBV looks bearish.
There is hidden bearish divergence between Stochastics and price at the last high and the high of November 2015. Stochastics has moved further into overbought territory, but this has failed to translate into a corresponding new high in price. Price is weak. MACD exhibits the same hidden bearish divergence.
After a period of declining ATR, it should be expected to turn and begin to increase.
DAILY CHART
Click chart to enlarge. Chart courtesy of StockCharts.com.
Volume data on StockCharts is different to that given from NYSE, the home of this index. Comments on volume will be based on NYSE volume data when it differs from StockCharts.
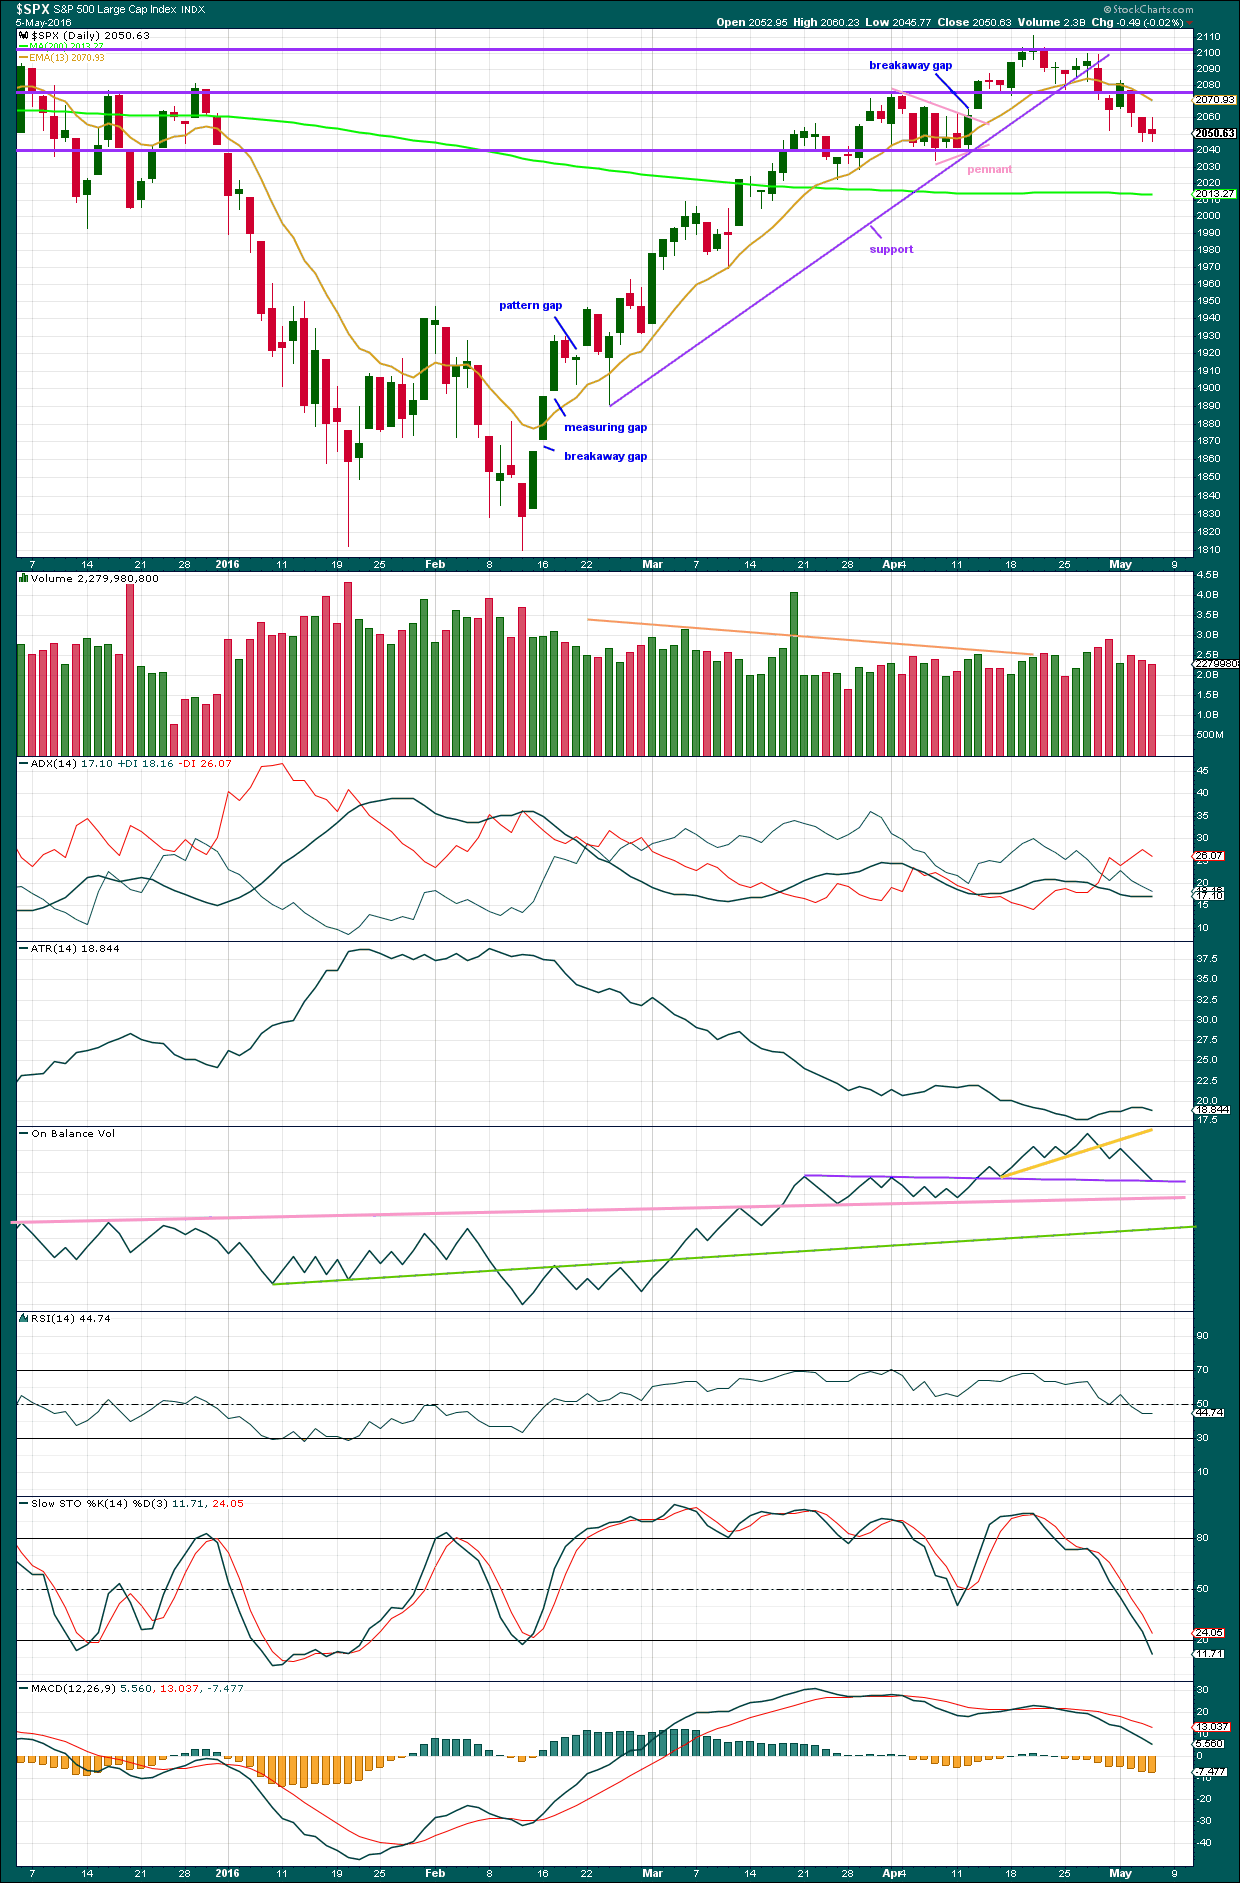
The decisive breach of the purple support line strongly indicates a trend change for the S&P.
For the first two downwards days, volume increased as price fell. Volume for these two days is stronger than any prior day back to 4th of March (ignoring the options expiry date of 18th March). This is significant. As price rose to the last high on 20th April, it came with light and declining volume. Now volume shows an increase as price falls.
For the last two days in a row, price has fallen overall but volume is declining. The market may fall of its own weight, but this does indicate some caution short term. A small bounce as expected from the Elliott wave count may resolve this. An upcoming larger bounce for a second wave correction at minor degree would certainly resolve this.
Price is finding some support just above the horizontal support line at 2,040.
ADX is above 15 and slightly increasing. ADX is indicating a downwards trend may be beginning.
ATR may overall agree as it looks like it may be beginning to turn up after a long period of decline.
On Balance Volume is today giving a strong signal. It has come down to find support at the purple line. This line is almost horizontal, repeatedly tested and has been held for a wee while now. It offers reasonable technical significance. This may serve to hold price up and prevent a new low tomorrow. OBV may be expected to find support here before any break through may be attempted. A break by OBV below the purple or pink lines would be a strong bearish signal, particularly the pink line.
A new green line is added to OBV. It may find some support when it gets down to that line.
RSI is just below neutral. There is plenty of room for price to fall.
Stochastics is entering oversold but this oscillator may remain extreme for periods of time during a trending market. Its best use in a trending market is for divergence to indicate trend weakness.
MACD is indicating increasing downwards momentum.
VOLATILITY – INVERTED VIX DAILY CHART
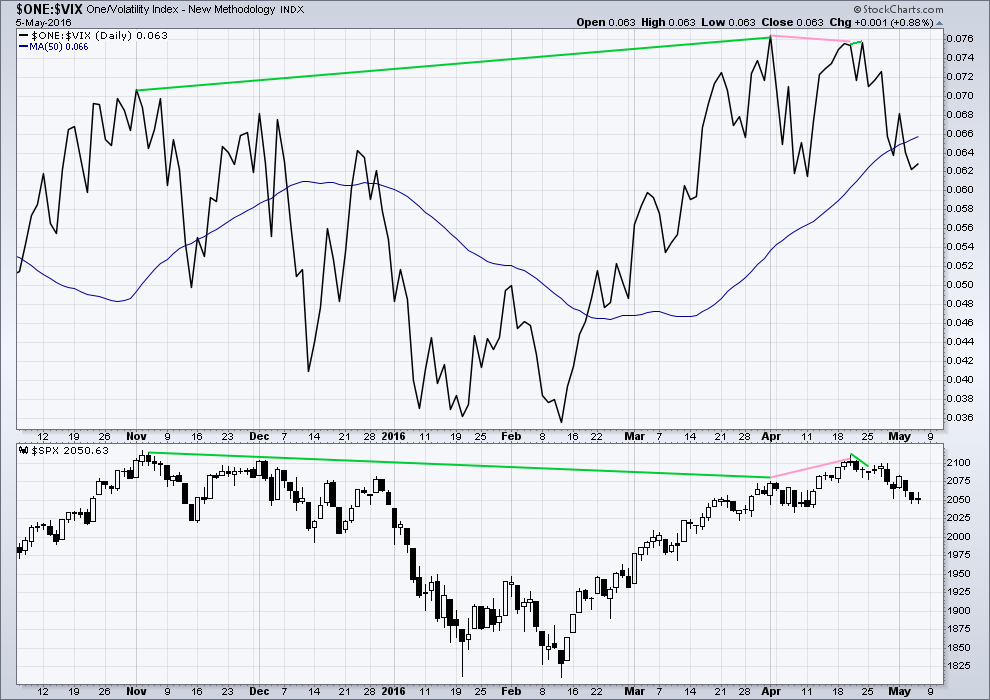
Click chart to enlarge. Chart courtesy of StockCharts.com.
Volatility declines as inverted VIX climbs. This is normal for an upwards trend.
What is not normal here is the divergence over a reasonable time period between price and inverted VIX (green lines). The decline in volatility is not translating to a corresponding increase in price. Price is weak. This divergence is bearish.
Price made a new short term high, but VIX has failed to make a corresponding high (pink lines). This is regular bearish divergence. It indicates further weakness in the trend.
BREADTH – ADVANCE DECLINE LINE
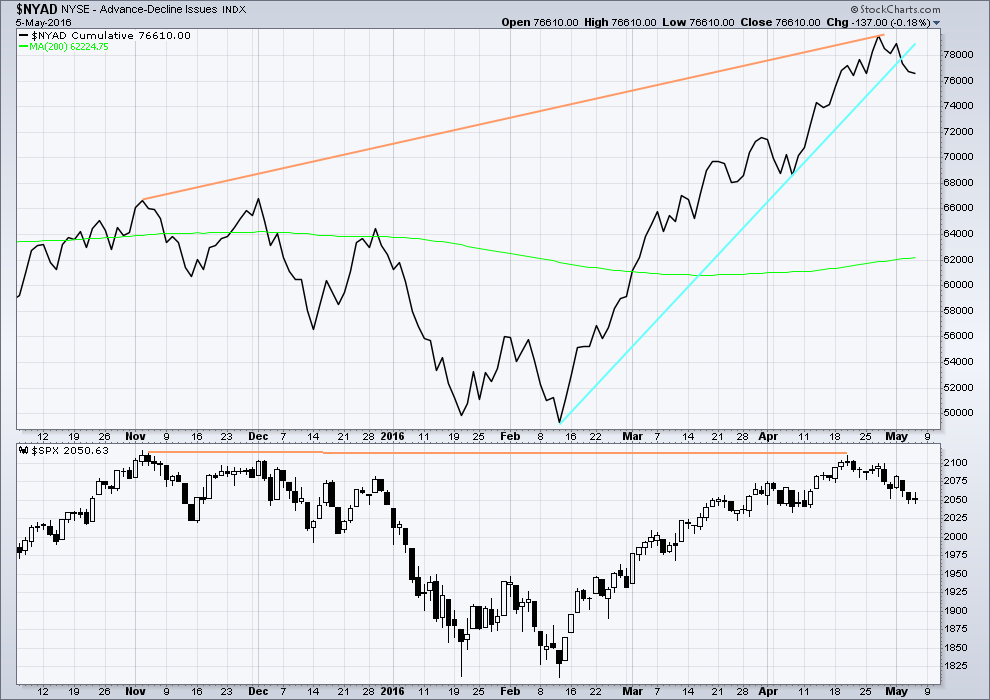
Click chart to enlarge. Chart courtesy of StockCharts.com.
With the AD line increasing, this indicates the number of advancing stocks exceeds the number of declining stocks. This indicates that there is breadth to this upwards movement.
From November 2015 to now, the AD line is making new highs while price has so far failed to make a corresponding new high. This indicates weakness in price; the increase in market breadth is unable to be translated to increase in price (orange lines).
The 200 day moving average for the AD line is now increasing. This alone is not enough to indicate a new bull market. During November 2015 the 200 day MA for the AD line turned upwards and yet price still made subsequent new lows.
The AD line is now declining and has breached a support line (cyan). There is breadth to downwards movement; more stocks are declining than advancing which supports the fall in price.
SENTIMENT – COMMITMENT OF TRADERS (COT)
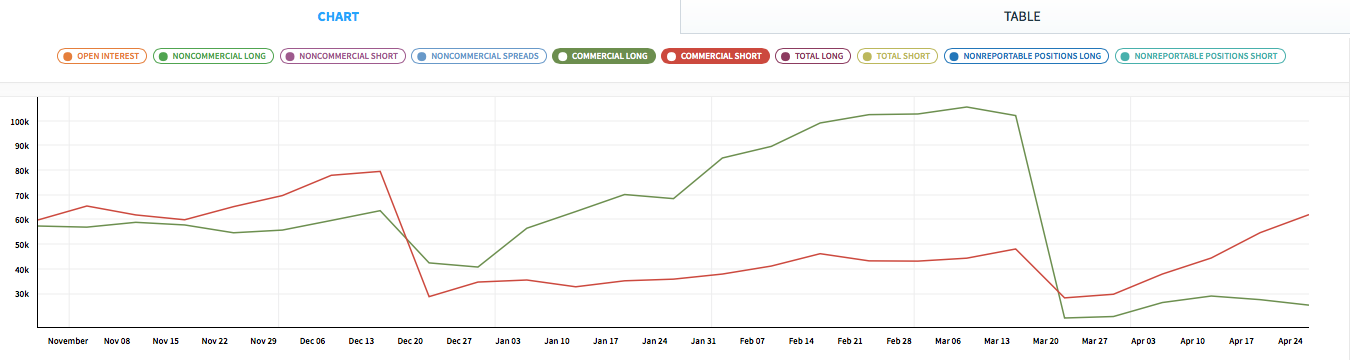
Click chart to enlarge. Chart courtesy of Qandl.
This first COT chart shows commercials. Commercial traders are more often on the right side of the market. Currently, more commercials are short the S&P than long. This has increased last week while long positions have decreased. This supports a bearish Elliott wave count, but it may also support the bullish Elliott wave count which would be expecting a big second wave correction to come soon. Either way points to a likely end to this upwards trend sooner rather than later. Unfortunately, it does not tell exactly when upwards movement must end.
*Note: these COT figures are for futures only markets. This is not the same as the cash market I am analysing, but it is closely related enough to be highly relevant.
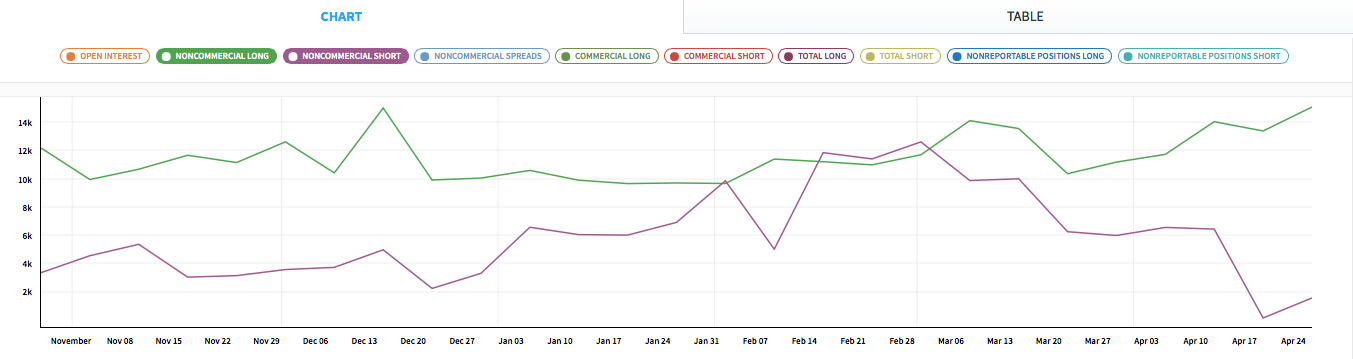
Click chart to enlarge. Chart courtesy of Qandl.
Non commercials are more often on the wrong side of the market than the right side of the market. Currently, non commercials are predominantly long, and increasing. This supports the expectation of a trend change soon.
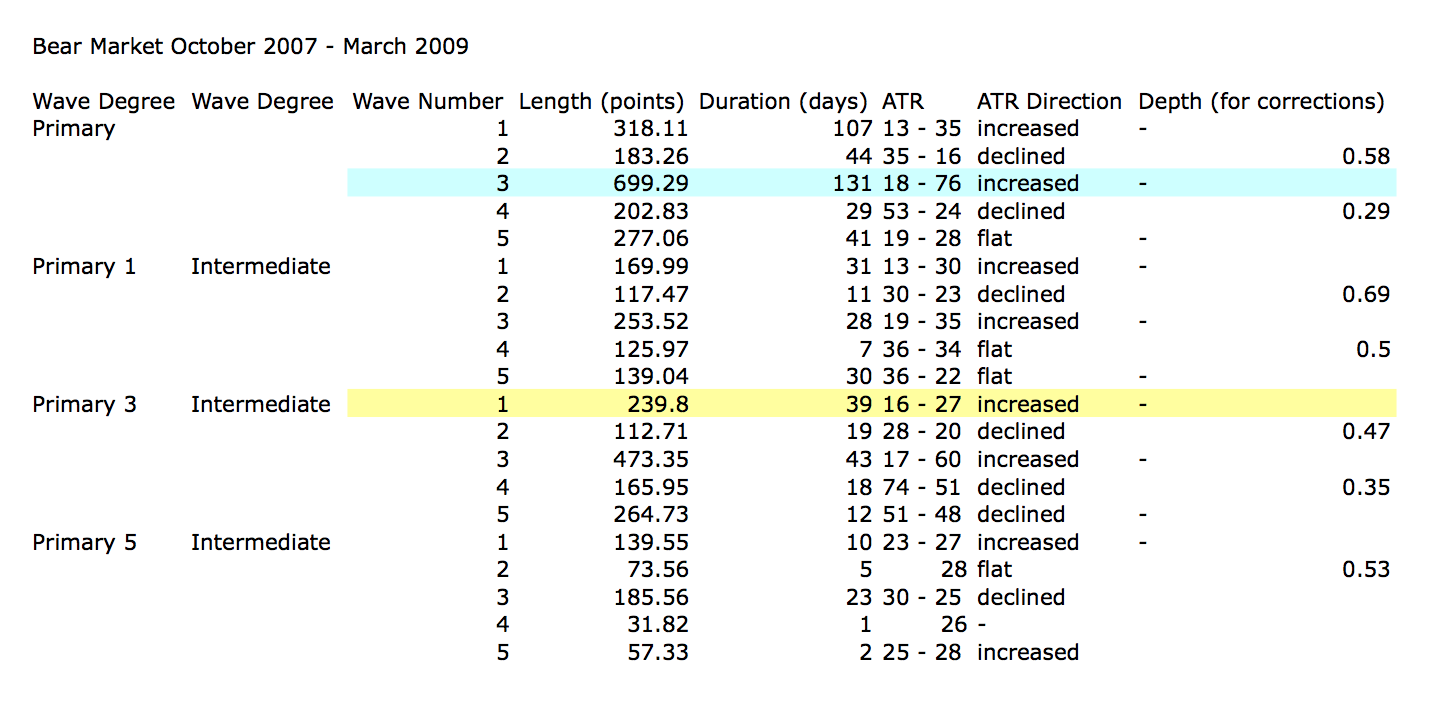
ANALYSIS OF LAST MAJOR BEAR MARKET OCTOBER 2007 – MARCH 2009
Click to enlarge.
In looking back to see how a primary degree third wave should behave in a bear market, the last example may be useful.
Currently, the start of primary wave 3 now may be underway for this current bear market. Currently, ATR sits about 19. With the last primary degree third wave (blue highlighted) having an ATR range of about 18 to 76, so far this one looks about right.
The current wave count sees price in an intermediate degree first wave within a primary degree third wave. The equivalent in the last bear market (yellow highlighted) lasted 39 days and had a range of ATR from 16 – 27.
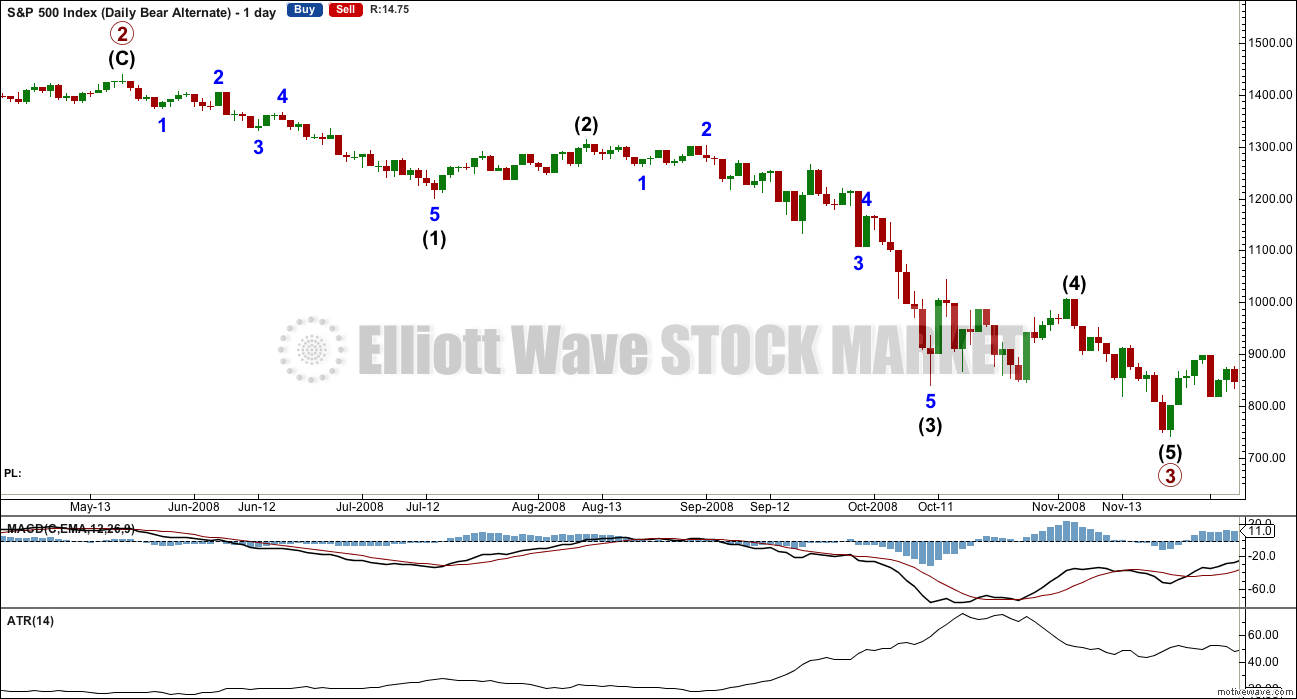
Click chart to enlarge.
This chart is shown on an arithmetic scale, so that the differences in daily range travelled from the start of primary wave 3 to the end of primary wave 3 is clear.
Primary wave 3 within the last bear market from October 2007 to March 2009 is shown here. It started out somewhat slowly with relatively small range days. I am confident of the labelling at primary degree, reasonably confident of labelling at intermediate degree, and uncertain of labelling at minor degree. It is the larger degrees with which we are concerned at this stage.
During intermediate wave (1), there were a fair few small daily doji and ATR only increased slowly. The strongest movements within primary wave 3 came at its end.
It appears that the S&P behaves somewhat like a commodity during its bear markets. That tendency should be considered again here.
This chart will be republished daily for reference. The current primary degree third wave which this analysis expects does not have to unfold in the same way, but it is likely that there may be similarities.
DOW THEORY
I am choosing to use the S&P500, Dow Industrials, Dow Transportation, Nasdaq and the Russell 2000 index. Major swing lows are noted below. So far the Industrials, Transportation and Russell 2000 have made new major swing lows. None of these indices have made new highs.
I am aware that this approach is extremely conservative. Original Dow Theory has already confirmed a major trend change as both the industrials and transportation indexes have made new major lows.
At this stage, if the S&P500 and Nasdaq also make new major swing lows, then my modified Dow Theory would confirm a major new bear market. At that stage, my only wave count would be the bear wave count.
The lows below are from October 2014. These lows were the last secondary correction within the primary trend which was the bull market from 2009.
These lows must be breached by a daily close below each point.
S&P500: 1,821.61
Nasdaq: 4,117.84
DJIA: 15,855.12 – close below on 25th August 2015.
DJT: 7,700.49 – close below on 24th August 2015.
Russell 2000: 1,343.51 – close below on 25th August 2015.
To the upside, DJIA has made a new major swing high above its prior major high of 3rd November, 2015, at 17,977.85. But DJT has so far failed to confirm because it has not yet made a new major swing high above its prior swing high of 20th November, 2015, at 8,358.20. Dow Theory has therefore not yet confirmed a new bull market. Neither the S&P500, Russell 2000 nor Nasdaq have made new major swing highs.
This analysis is published @ 08:50 p.m. EST.
Thank you very much for your earlier analysis *Olga*. I tried to take a high risk ride up wave 4; that didn’t work out as i got in at practically the top of wave A. You helped me take emotion out of the trade and to trade with reason and a plan.
No worries – glad it worked out for you 🙂
And… that’s all folks!
I’m off surfing. 3-4ft glassy, no wind, nice peeling waves.
Time to play!
Happy surfing… 🙂
Enjoy!
Thx for afternoon update. Definitely adds clarity.
Kevin
Gold COTs:
Commercials long 116,644 commercials short 411,545
Change long 199 short 54,992
weak into the close…wasn’t expecting this…may end with a doji
Volume quite low so not that many buyers. We will probably see final run up on Monday have a repeat of the “Turn-around Tuesday” we have been seeing the last few weeks. Have an awesome week-end everyone!
Good morning everybody 🙂
Happy days. The market is behaving as expected. This looks so far like a common expanded flat for minute iv.
Minuette (b) is a 1.42 length of minuette (a). Just over the maximum common length of 1.38 but within allowable conventional range of 2.
At 2,063 minuette (c) = 1.618 X minuette (a). As per Olgas calculation already, thanks Olga!
That would see minuette (c) avoid a truncation and the structure be a common expanded flat rather than a rare running flat.
The next higher target may be the 0.382 Fibonacci ratio at 2,066.
When this is done then a fifth wave down.
Monday may also print a green candlestick or maybe a doji. Possibly a red candlestick with a long upper wick if this correction ends more quickly.
The alternate is invalidated. Yay. One less chart to update, one in which I didn’t have confidence.
Beautiful! Showing excellent proportion with minute two as well.
And alternation.
We didn’t see any alternation in intermediate (B) down. There sure was something off and odd about that wave down.
So far this new wave down is behaving itself.
Awesome. ) we took out 2039 giving price confirmation / confidence. 2) we are about to complete a five wave impulse early next week. All other data with these confirm that Primary 3 has started. Awesome.
Have a great weekend everyone.
As I am thinking about it the price break we had today. For channel breaks Lara requires one full candle outside of and not touching the channel line. If I recall properly, for at least some price points in t he past, she has required a close below not just and intraday.
Lara, please clarify this for us. I am guessing you would cover it anyway.
Yes, a channel break should be by a full candlestick not touching.
But I’m not sure which channel you’re referring to? The pink channel on the hourly chart? Or the blue channel on the daily chart?
Elliott wave invalidation points will always be by any amount at any time frame, not a close.
Magee trend lines should be breached by 3% or more of market value on a closing daily basis.
Dow Theory requires a new high or low on a daily closing basis.
I think that about covers it all?
Hi Lara,
Thanks so much for your very helpful insights. What is the general target you have for this final fifth wave down? Are you still looking in the 2012ish range or higher? Thank you.
I can’t give you a target for the fifth wave because I don’t know where it starts.
Because the fourth wave isn’t over yet.
I can only give you an expected length of the fifth wave for now.
The more I look at this..the more I see this. What if 2039 was the ACTUAL end of wave v of 3? and now we’ve JUST started Wave 4 with the 2039 low? Would support the bullish case the other technicals are pointing to short term.
Or am I totally off base here?
Possible.
The way to tell is the structure of the last move down: is it a three or a five?
If it’s a three then it’s a B wave of an expanded flat and it’s part of minute iv.
If it’s a five then it’s part of the last wave of minute iii down.
Expanded flats are very common structures. Because their B waves make a new price extreme they are the sneakiest fakiest (yes spell check, it’s word) of all the B waves IMO. Horrible things.
Thanks for the input Lara 🙂 Muchly appreciated. You’re service is like a paid education and investing service put together 🙂
🙂 We aim to please
A quick check of the 5 min chart:
The wave down to todays low will fit very well as a double zigzag. So it fits well as a three.
At first glance it also looks good as a five, but when you try to fit that in it has to see a running flat for the fourth wave. That’s a very rare structure and it hasn’t turned up before or after a VERY strong move, so the probability is very low.
Conclusion:
It will fit as either a three or five but is more likely by quite a wide margin to be a three.
In my experience UVXY exhibits capitulation spikes at the end of third waves down. The price action seems inconsistent with the conclusion of a third wave.
Gotcha! Thanks 🙂
Still think we have one more pop higher to avoid a truncation – possibly in W4 of (c) now – might even only be W4 of (extended) 3 of C with W4 & W5 of C still to go.
I’m outta here – have a great weekend everybody. Next week should be exciting!! 🙂
Bye Olga, and thank you again for sharing your counts with everybody.
Just gone above the upper base channel, so it seems this move means business. Got a buy order set @ UVXY 15 – can’t watch the last hour of action as need to go out (got gigs now every Fri & Sat until NYE – great to be back on stage 🙂 )
Ohhh! You’re a musician? SO AM I! 😀
Verne is also 😉 . We’re all dark horses on here 🙂
Verne plays bass (I think??), I play keys. We’ll have to start an EWSM band 🙂 🙂
(ft. Lara’s happy dance!)
Let’s do it! 🙂
I am a vocalist. One of my favorite music genres is the blues. I am from Chicago.
I love it all man! Somewhat partial to jazz fusion….
you should see me play air guitar..
lol 🙂 I think we can all imagine that Doc!
But if there is a serious lack of co-ordination between your air guitar, and Laras happy dance I fear we would only get gigs in the nut house!
does that mean Im in the band?
a captive crowd for sure
I have the musical ability of a cabbage. I’ll be the appreciative audience 🙂
I play Saxophone! WE HAVE A TRIO! What kind of music?:)
My band plays modern stuff (Calvin Harris, David Guetta, Rihanna etc). We do Proud Mary (Tina Turner) as an encore though – there’s sax in that.
Great instrument BTW!
Youtube link? 🙂
Very close… 🙂
Filled at 15.49 ….
I am expecting a vicious reversal off this spike from the triangle, hoping for 15.50, at 15.85 so far …. 🙂
2043 my current line in the sand. We should get below 15 if this move up gets a move on.
We need to break out of the base channel from todays low if there is any chance of that. Price just about to have a confrontation with the upper base channel – it should blast straight through it if this is a C wave.
Lots of red flags for the bulls, not the least of which is inter-market divergences…
UVXY bouncing off 15.80 level.
Will wait for 18.00 without stink bid fill…
If wave (c) up goes to 2063ish area, UVXY might be sub 15…
And then, what a ride down that would be (up for UVXY) specially with price confirmation today. 🙂
Wouldn’t 2063 likely over-throw the channel?
That would be an ideal entry, it it can make it that far.
Yep – (presuming it happens in next session or today, otherwise it would be well over)
Not too often one gets these fat pitches right over the center of the plate… 🙂
Interesting..
Obama: Trump has ‘long record that needs to be examined’
Obama says Clinton and Sanders will have to talk at some point about way forward
Obama: I will not comment on Trump’s tweets for next six months
I guess they are worried that an outsider might expose their little secrets…
Bolsheviks and the Mensheviks unite!
Succeed to reach here with (c) ?
If this mornings low was the end of B, then C would be 1.618*A @ 2063 and avoid a truncation.
More interestingly, @ 2.618 fib C would reach 2077 – so kiss the W1 low perfectly. I would absolutely love for that to play out – incredibly good entry point (so it probably wont 🙁 ).
It needs to get a wiggle on though if that’s the plan.
2063 would also fill the gap down from May4th closing price…
Just unsure if Mr. Market has enough oomph to get up there atm.
When did wave 4 end, or has it?
See my chart below – I don’t think it has but caution is warranted as we are getting lower lows in 5 wave structures and moves up in 3s – so the market could well be breaking down.
Above 2051.62 I’d have more confidence that W4 is not yet over – until that point the market might be on borrowed time.
In any case – we just had price confirmation of the main bear count – so any bounces should be seen as an opportunity to get positioned short at a discount.
Updated chart – below 2031 should be discarded imho (as B would be more than 2x A)
just broke 2039.74 SPX
Yep – main count confirmed 🙂
Bought UVXY 50% position – think I will be able to get other 50% at better price.
This might still be a B wave but not willing to be totally out of the game now we’ve confirmed with price.
UVXY still red
Not for long…not for long… 🙂
Well, I am off to read what will probably be my last report just arriving in my inbox from the “other guys” on their view of what is going on in the markets. Cheerio!
What do they reckon?
Buy, buy, buy?
🙂 🙂
Preferred count still is minor one up off Feb 11 lows, minor two down now underway. Alternative is intermediate two at at April 20 highs. I wish their subscribers trading the preferred count all the best… 🙂
The market is breaking down….failure to move any higher after that sharp reversal very bad for the bullish case imo now that we have taken out this morning’s lows.
Lara,
Are you still thinking 2012ish for this next wave down?
2012 is still my target – it is where Minute (iii) = 2.618 length Minute (i).
No. When minute iv is over then I can calculate a target for minute v.
I can’t do that because I don’t know where it starts.
2,012 was for minute iii to end, and it didn’t reach that target.
Mr Market is getting increasingly schizo! Certainly not boring atm.
1min RSI (& UVXY) still suggesting price wants to bounce
It sure looks like a few players beat you to executing their Unicorn shorts! 🙂
If we clear 18 this morning I will happily join the other side of that trade…
It seems there are alot of people piling in short UVXY (let’s see how that works out) – I’m happy with the discount.
2042.35?
It occurs to me that the the banksters have already lost the 2050 dogfight….maybe 2000 will bite the dust today…
Green candles on on minute looking really anaemic….bears starting to flex some muscle…
My chances of getting filled at 15.50 starting to look like slim and none, and think slim just left the premises…it seems we have a pretty hard floor at around 16.00…
A “C” wave up should see a penetration to the downside imo but it looks like the beast is coiling for a leap upwards…
Here we go…three up…
Olga if you are going to short the Unicorn, better get on it…! 🙂
I’ll probably wait and do my W4/W1 trade – I feel it might be picking up pennies in front of a steam roller atm.
If we dive down in a wave c now, then I might be tempted. We’re still too far away from this mornings lows atm (which would be my stop)
I just entered short and IB refused (none available)!!! Arrrrghhhh
OK – just bought a small position SSO with a stop at todays low.
Stop moved up to 2044.22 (we might be in W4 of this small C wave now – but price already travelled past 76.4 fib so I’m gettin suspicious)
Stopped out with a very small loss
Current decline clearly corrective…we are probably going higher in the near term…
I will be taking advantage of this move up to place short term trades in preparation for final wave down…
I *might* short UVXY – not decided yet. It’s a bit of an animal 🙂
Second thoughts I’ll just stay 0% – it’s as good as being long (as it’s not short!).
I’m such a ckicken 🙂 🙂
Better than being a chicken in somebody’s pot! 🙂
Market not following the C up script it seems.
Are we looking at a prelude to a breakdown?!
Five up off this morning’s low…we need to take out 2051.53 to confirm impulse up…
I don’t see that on a 5 min or 1 min chart
Yep – I can also count 5 up on 1min.
Atm 2049.45 is first confirmation that this tiny move down is corrective.
In tiny wave c atm I think. As usual UVXY gave us the heads up this morning.
Joseph are you wearing your glasses? 🙂
Yep!
Opening stink bid of a couple grand of Unicorns at 15.50
That possible second wave correction looking like a combination…quite long…
I count it as three up even though there are more than three waves.
Could be – maybe very short A wave.
EDIT: Odds of it being a 5 just increased with that move above 2049.45 imho (though move down could be counted as a 5 down with an expanded flat up – fun all this 1m stuff eh… 🙂 )
On 15sec (!!! 😉 ) chart it does look alike an ABC with a long c wave though.
Is it correct that for a flat for minute iv we need to exceed the top of minuette a at 2060.23?
Yeah – otherwise it would be a rare running flat (which can happen when the down pull of the next wave is significant).
EDIT2 – I just saw that B did travel more than 100% of A – so it would be a rare running flat if it was truncated 🙂 . Initially for some reason I didn’t think it did.
Not necessarily…
You were right 🙂
2039 has held so far. SPX moving up strongly against opening trend. It may be that minuette b has completed at today’s low.
LOL…futures down almost 10 handles and UVXY is red in premarket….
Crazy vehicle to trade.
$DJC DOW Jones Composite is setting session lows as I type this message.
Everything will follow lower.
Any Bounce Will Fade….. by 10:30am or earlier.
I agree we are going to see a strong move sometime today. We could see a massive wave C up to trap a few bulls over the week-end. I am taking a pass on any move up unless I can scalp it intra-day….
Futures took out 2039.74 but rather muted. Either wave b moving a bit lower or minute five down is going to be brief…
The ES Equivalent of SPX 2039 is ~ 2033… So no SPX 2039 was not yet taken out.
Futures… ES has NOW taken out the SPX equivalent of 2039…. with an ES low of 2030.50
Thanks Joseph. The jobs report was not supportive of interest rate hikes or the thought that the economy is doing well. The market’s initial reaction is negative.
I am not sure I am fully accepting the current main or preferred bear count where minor 1 needs a final push lower for a fifth wave. It is just not ‘looking right’ to me. But I am no wave counter. I just do not see the market as ready for a strong correction by minor 2. I have and will hold my positions with a trailing stop to see what happens as we approach 2030.
PS – Good morning to all. I can so easily forget my manners ruffian that I am!
What did we learn today? We learned that China is now arresting anyone (Professional Economists) who puts out a GDP forecast that is lower than Official Government estimates.
How in the world if you are a sane logical person can you believe any number put out by the Chinese Government and how can you invest in anything that is related to China’s growth prospects. You have to be completely delusional to do so!!!!
That includes the world economy & any nation that sells into China.
Rodney,
Agree that FED will now use the job report to delay the interest rate hike but the risk is if they skip June, next meeting will be too close to the election date. Additionally, lower job creation and lack of sustainable economy recovery are much bigger than just the interest rate fear. I think we are likely to see threats of negative rate coming out of FED now…watch the run on the banks if that through catches fires…
Take out your CASH now before the rest of the people wake up to what this really means.
Anyone who supports negative rates should be thrown out of office… fired from their decision making positions and basically have their citizenships revoked! OR thrown into prison for theft because that is essentially what negative rates are!!!!
ES has it own wave structure so it is a bit more complex than just comparing equivalent price points. As you saw from subsequent action, the point was clearly made… 🙂
Nonetheless, very tempting to jump to the short side based on pre-market activity but these knee-jerk reactions ought not to be trusted…smart to wait and see…
Yea… it’s leading the SPX!
But I thought you were all about the Price???
ES & SPX track and at the moment ES has about a 6 point price track lower than SPX at any moment in time.
Vern,
The Market Makers need to protect their position before the chaos hits the markets. I will not be surprised to see market below 2012 given the payroll report. All that money pumped into the markets and what have they got to show for it..a big fat nothing.. $14 trillion down the drain with no returns that matter to average citizen. The fact can not be kept hidden for long JMHO
Yep. I think that is the big story. The incredible amount of pumping that has been going on,( and actually in the absence of any real selling pressure) with nothing to show for it. We may see another pop but I think when it breaks it’s going to break hard. Transports already heading South in a big way, and so is small caps…
Good Day, wanted to share potential candle pattern for today which is making me feel a little uneasy for tomorrow….
Matching Low – Bullish Reversal Pattern
Pattern: reversal
Reliability: high
Identification
A long black day is followed by another black day with equivalent closes both days.
The Psychology
In a downtrend or during a pullback within an uptrend, a long black day occurs signaling the bears being in control. The stock gaps up the next day but then sells off to close at the same level as the previous day. The more times a stock can successfully test and hold a low, the higher the chance a reversal will occur once the seller become exhausted. Strength the following day with volume would confirm the pattern. see link for more details
http://www.leavittbrothers.com/education/candlestick_patterns/bull/matching_low_bullish.cfm
The first wave count expects upwards movement to a max of 2077. Isn’t this candle pattern just confirming that move to 2077?
Perhaps, the candle pattern suggests that the reversal experienced was just a pull back in a upward bullish trend pattern and that the bullish trend will now continue. I’m thinking today’s candle is more of a doji which invalidates the pattern. I get the feeling Friday is going to be a very interesting day.
The fundamentals in no way shape or form support a bullish cause… + the debt default cycle is soon to enter its acceleration stage.
One small candlestick pattern isn’t enough of a bullish picture to expect a bull market to continue though. On it’s own it’s a weak signal. The first candle has a small range, its not a long black candle. And the second as you rightly note is a doji.
Two lows about the same point in two days isn’t much of a bullish signal. Now if there were other signals / indicators which also are bullish, then it would have weight.
Looking for other bullishness currently: the decline in volume is concerning for the last three days as price fell. That’s bullish, short term.
The slight decline in range today is also bullish. Short term.
I give a lot of weight to On Balance Volume and it has strong support. Again, bullish short term.
This bullishness could very well be resolved by minor wave 2 up, especially if it’s deep.
It is telling us that the downwards trend is weakening a little.
But it is not telling us that the trend remains up. The support line breach on the TA chart tells us the trend has changed to down, and ADX agrees.
So the trend is the same, until proven otherwise. Currently mid term the trend is down, until it’s not. A new high above 2,111.05 would prove it’s not.
Thanks Lara, that’s the conclusion I was looking for.
turd again,, happy cinco de mayo
Hi
Good afternoon.