
Upwards movement was expected for the short term from both hourly Elliott wave counts.
Summary: The probability that the upwards wave is over and the next wave down has begun is very high indeed. If the bear wave count is right (and it is supported by technical analysis), the target for primary wave 3 is at 1,423. In the short term, another second wave correction is either over now or should be very soon. A third wave down should follow.
To see last published monthly charts click here.
To see how each of the bull and bear wave counts fit within a larger time frame see the Grand Supercycle Analysis.
To see detail of the bull market from 2009 to the all time high on weekly charts, click here.
New updates to this analysis are in bold.
BEAR ELLIOTT WAVE COUNT
WEEKLY CHART
Click chart to enlarge.
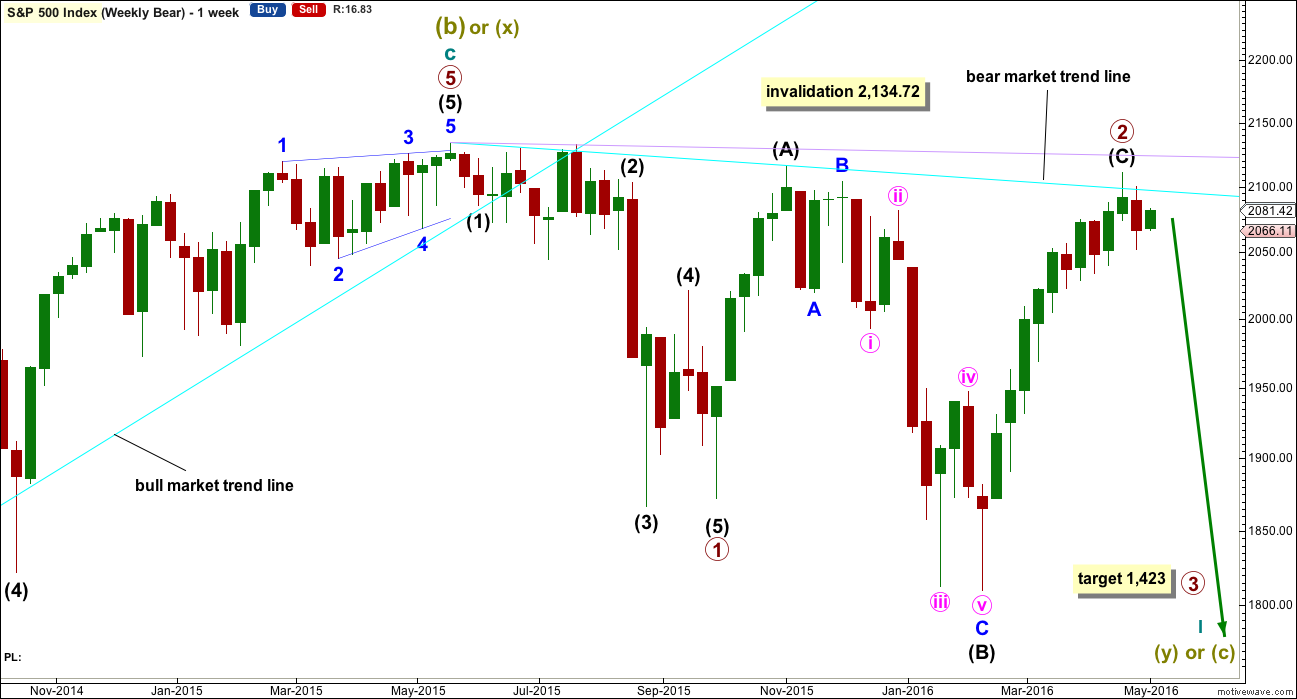
This bear wave count fits better than the bull with the even larger picture, super cycle analysis found here. It is also well supported by regular technical analysis at the monthly chart level.
Importantly, there is no lower invalidation point for this wave count. That means there is no lower limit to this bear market.
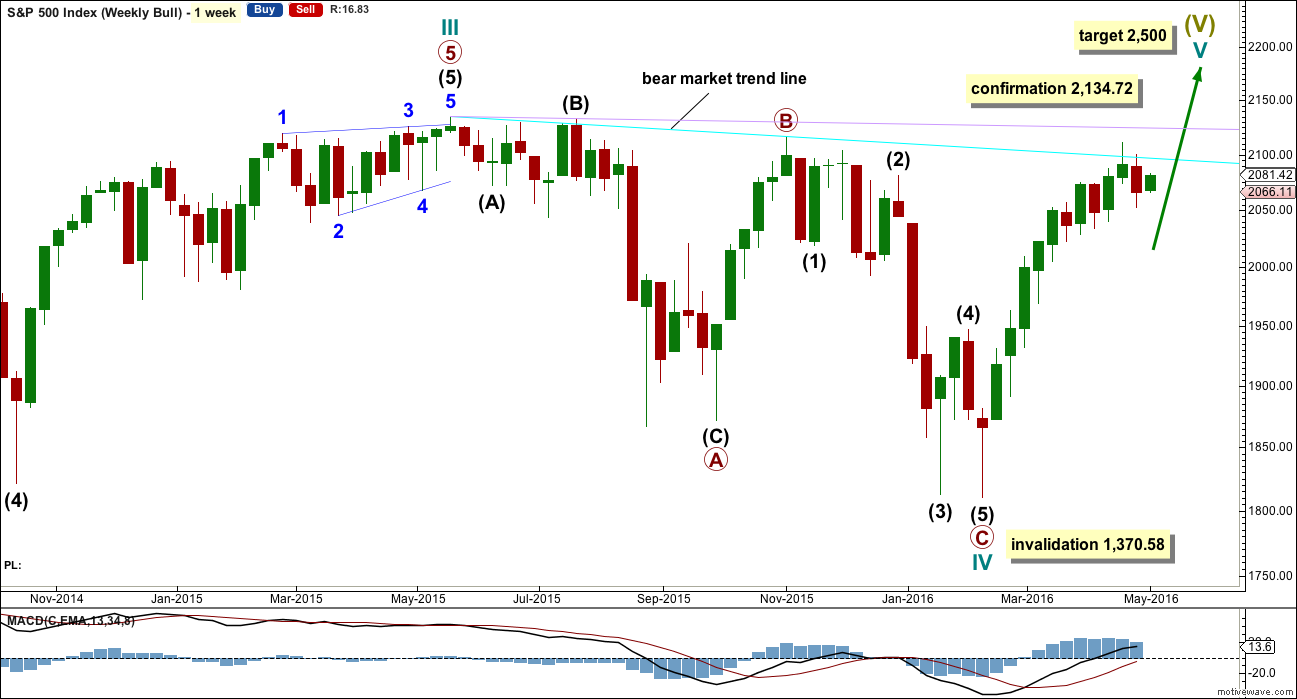
Primary wave 1 is complete and lasted 19 weeks. Primary wave 2 is either over lasting 28 weeks, or it may continue for another one or two weeks.
The long upper shadow on last week’s green weekly candlestick is bearish. Last week completes a bearish engulfing candlestick pattern.
Primary wave 2 may be complete as a rare running flat. Just prior to a strong primary degree third wave is the kind of situation in which a running flat may appear. Within primary wave 2, intermediate wave (A) was a deep zigzag (which will also subdivide as a double zigzag). Intermediate wave (B) fits perfectly as a zigzag and is a 1.21 length of intermediate wave (A). This is within the normal range for a B wave of a flat of 1 to 1.38.
It is possible but highly unlikely that primary wave 2 could yet move a little higher. If it does, then intermediate wave (C) should end above 2,116.48 to avoid a truncation. Primary wave 2 would then be a very common expanded flat.
Primary wave 2 may not move beyond the start of primary wave 1 above 2,134.72. When there is some price confirmation that primary wave 2 is over, then the invalidation point may be moved down to its end. Price is the ultimate determinator. This is the risk while we do not have final price confirmation.
I am choosing to not publish the alternate bear wave count as of today. It does not fit for DJIA and is unlikely to unfold for the S&P as that would see these two markets diverge, which is unlikely. I will follow the alternate bear wave count. If it looks reasonably possible, I may publish it again.
DAILY CHART
Click chart to enlarge.
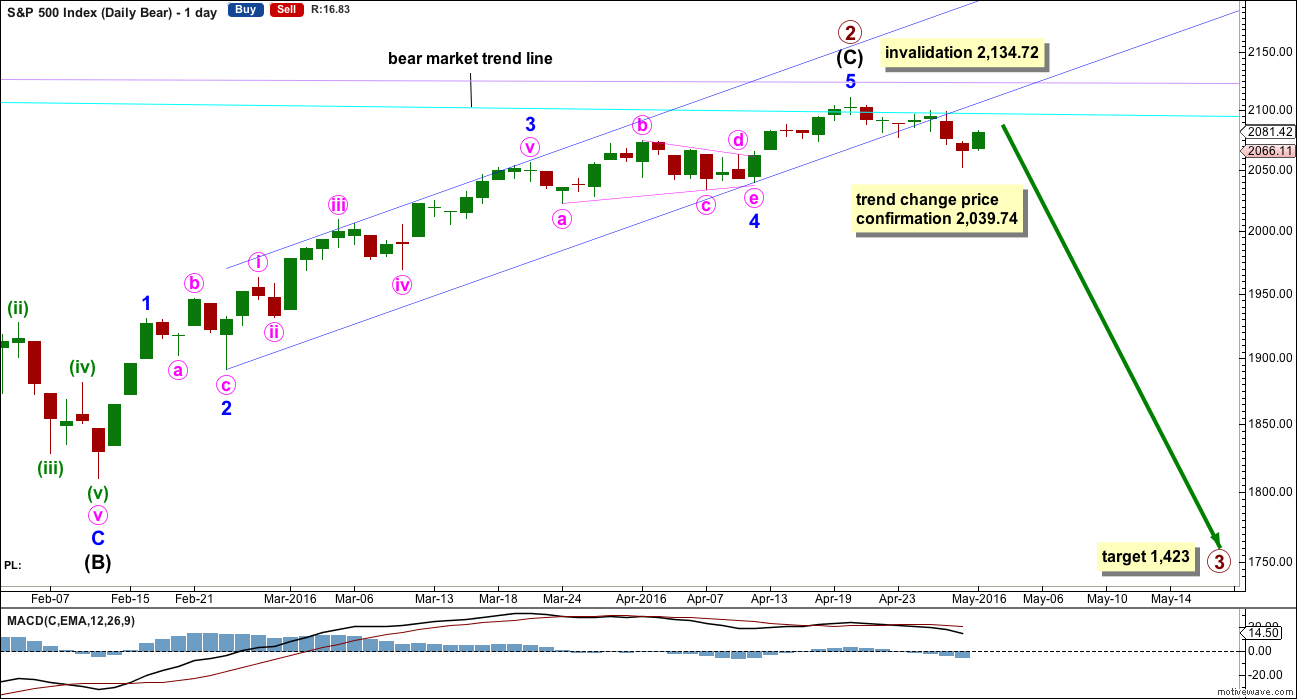
Intermediate wave (A) fits as a single or double zigzag.
Intermediate wave (B) fits perfectly as a zigzag. There is no Fibonacci ratio between minor waves A and C.
Intermediate wave (C) must subdivide as a five wave structure. It may be a complete impulse.
If intermediate wave (C) is over, then the truncation is small at only 5.43 points. This may occur right before a very strong third wave pulls the end of intermediate wave (C) downwards. Price confirmation of a trend change would come with a new low below 2,039.74.
The next wave down for this wave count would be a strong third wave at primary wave degree. At 1,423 primary wave 3 would reach 2.618 the length of primary wave 1. This is the appropriate ratio for this target because primary wave 2 is very deep at 0.91 of primary wave 1. If this target is wrong, it may be too high. The next Fibonacci ratio in the sequence would be 4.236 which calculates to a target at 998. That looks too low, unless the degree of labelling is moved up one and this may be a third wave down at cycle degree just beginning. I know that possibility right now may seem absurd, but it is possible.
Alternatively, primary wave 3 may not exhibit a Fibonacci ratio to primary wave 1. When intermediate waves (1) through to (4) within the impulse of primary wave 3 are complete, then the target may be calculated at a second wave degree. At that stage, it may change or widen to a small zone.
Draw the channel about the impulse of intermediate wave (C) using Elliott’s second technique: draw the first trend line from the ends of the second to fourth waves at minor degree, then place a parallel copy on the end of minor wave 3. Minor wave 5 may end midway within the channel. The channel is now breached decisively at the daily chart level. This provides some reasonable confidence in a trend change.
Because expanded flats do not fit nicely within trend channels, a channel about their C waves may be used to indicate when the expanded flat is over. After a breach of the lower edge of the channel, if price then exhibits a typical throwback to the trend line, then it may offer a perfect opportunity to join primary wave 3 down. At this stage, price may not move high enough to touch the dark blue trend line. It may find strong resistance at the cyan bear market trend line which is now just below 2,100.
Within minor wave 5, no second wave correction may move beyond the start of its first wave below 2,039.74. A new low below 2,039.74 could not be a second wave correction within minor wave 5, so at that stage minor wave 5 would have to be over. This would confirm a trend change.
Primary wave 1 lasted 98 days (not a Fibonacci number). Primary wave 2 may have lasted 140 days.
HOURLY CHART
Click chart to enlarge.
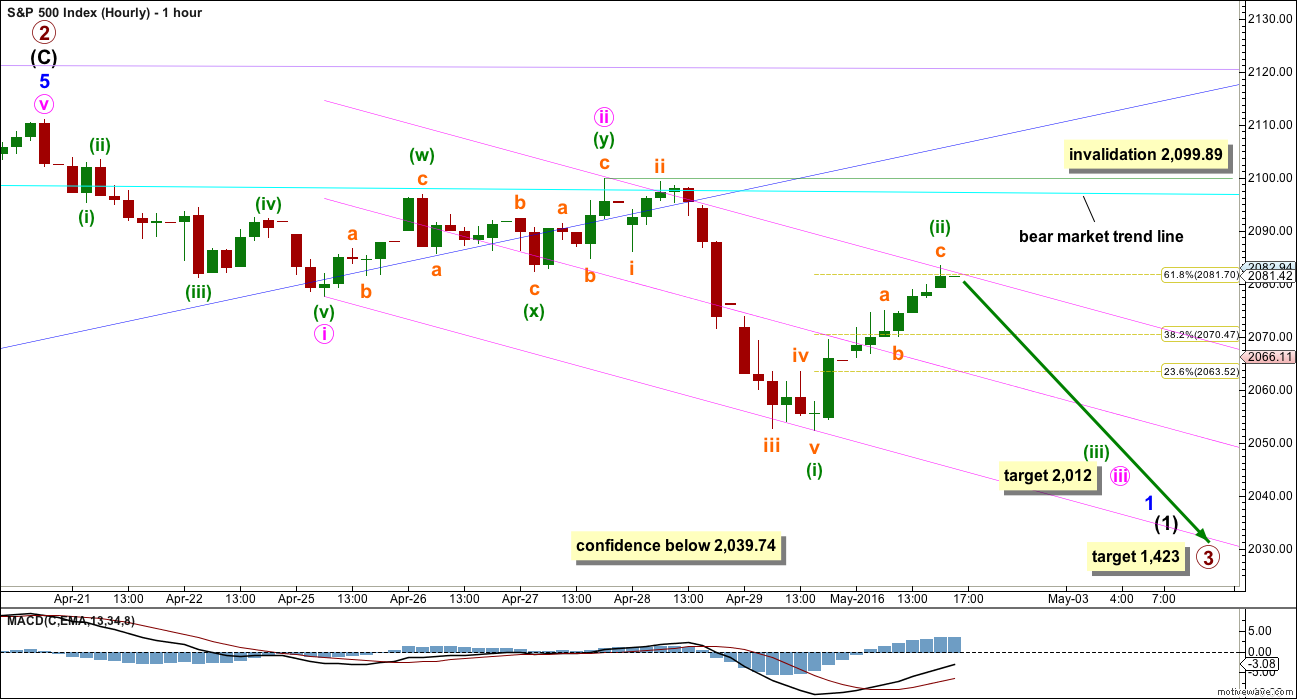
So far to the downside there is not a complete five wave impulse. Minor wave 1 still needs minute waves iv and v to complete.
Minute wave iii looks like it is extending. At 2,012 it would reach 2.618 the length of minute wave i. If this wave count is right, then this short term target may be met in a very few days.
Minuette wave (ii) is now a deep zigzag, close to the 0.618 Fibonacci ratio of minuette wave (i). Upwards movement may find resistance here at the upper edge of the channel which is now correctly termed an acceleration channel.
If minuette wave (ii) continues higher tomorrow, then it may find resistance at the bear market trend line which is copied over from the weekly and daily charts and now sits just below the round number of 2,100. If price does continue higher to that line, the market may offer an exceptionally low risk high reward opportunity.
Trading Advice:
Firstly, expect surprises now to be to the downside. If I am wrong, it will be with targets not low enough and corrections expected but not turning up or being more shallow than expected. Look at the big picture, the weekly chart. Any entry point about here may be profitable within a week most likely. Risk reward ratios are at this stage very high indeed. Stops may now be set just above 2,111.05. There is another second wave correction to come for minor wave 2.
In the short term, this looks like a good entry point for a short trade. As always, manage risk to your account. Sometimes I am wrong. The risk of losses to your account must be accepted and managed.
Do not risk more than 3-5% of equity on any one trade. Always use a stop loss order to protect your account.
ALTERNATE HOURLY CHART
Click chart to enlarge.
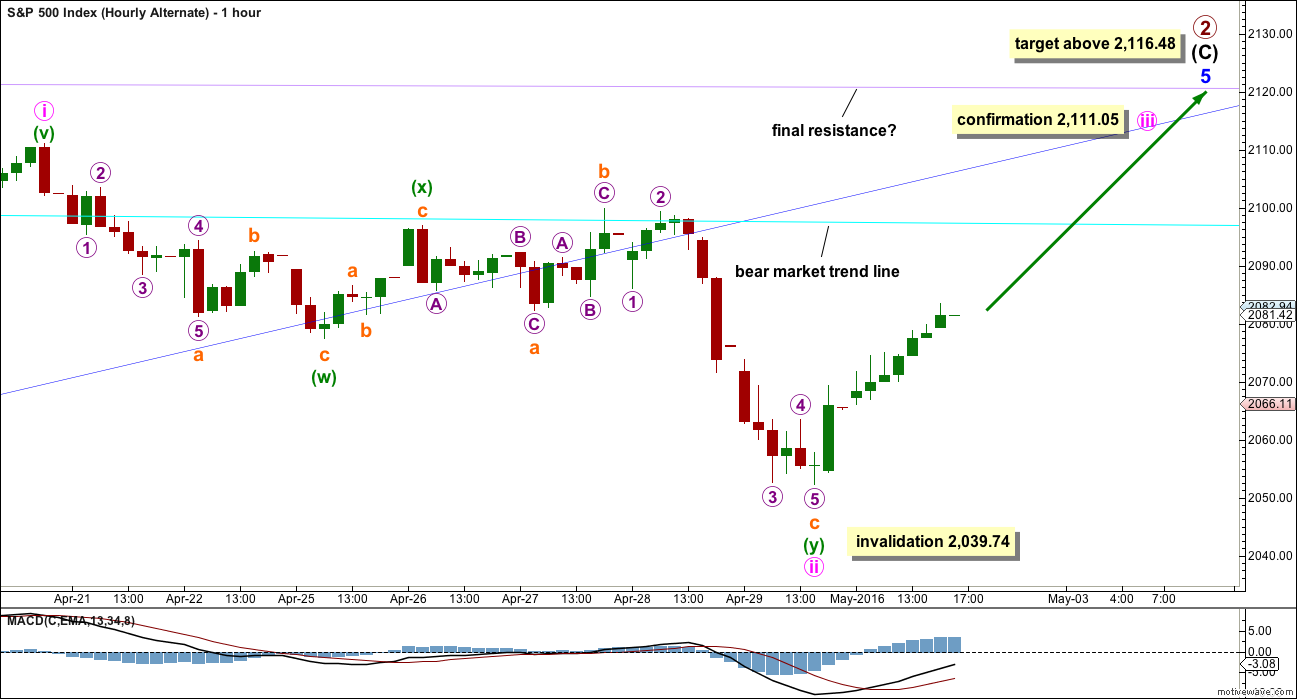
It is still just possible that primary wave 2 may not be complete. Intermediate wave (C) may yet be able to move above 2,116.48 to avoid a truncation and a rare running flat.
The degree of labelling within minor wave 5 is moved down one degree. The upwards wave to the last high may be only minute wave i within minor wave 5.
Minute wave ii may not move beyond the start of minute wave i below 2,039.74.
Minute wave ii is seen here as a double combination, but it no longer looks right. The second structure in the double is technically an expanded flat, which is okay. But it is deepening the correction, giving the whole structure of minute wave ii a downwards slope where it should be just sideways.
The first structure in the double labelled minuette wave (w) is a zigzag. The double is joined by a three, a simple zigzag in the opposite direction labelled minuette wave (x).
The second structure is an expanded flat labelled minuette wave (y). Both of subminuette waves a and b subdivide as threes, as they must for a flat. Subminuette wave b is a 1.21 length of subminuette wave a. This is over the requirement of 1.05 for an expanded flat, and within normal range of 1 to 1.38 for a B wave within a flat.
Subminuette wave c is a complete impulse and has no Fibonacci ratio to subminuette wave a.
This wave count requires a new high above 2,111.05 for confirmation. Classic technical analysis has reduced the probability of this wave count. The probability is low. Low probability is not the same as no probability; this wave count still illustrates the risk to any short positions here.
BULL ELLIOTT WAVE COUNT
WEEKLY CHART
Click chart to enlarge.
Within primary wave C downwards, intermediate wave (2) is seen as an atypical double zigzag. It is atypical in that it moves sideways. Double zigzags should have a clear slope against the prior trend to have the right look. Within a double zigzag, the second zigzag exists to deepen the correction when the first zigzag does not move price deep enough. Not only does this second zigzag not deepen the correction, it fails to move at all beyond the end of the first zigzag. This structure technically meets rules, but it looks completely wrong. This gives the wave count a low probability.
This part of the structure is highly problematic for the bull wave count. It is not possible to see cycle wave IV as complete without a big problem in terms of Elliott wave structure.
Cycle wave II was a shallow 0.41 zigzag lasting three months. Cycle wave IV may be a complete shallow 0.19 regular flat correction, exhibiting some alternation with cycle wave II.
At 2,500 cycle wave V would reach equality in length with cycle wave I.
Price remains below the final bear market trend line. This line is drawn from the all time high at 2,134.72 to the swing high labelled primary wave B at 2,116.48 on November 2015. This line is drawn using the approach outlined by Magee in the classic “Technical Analysis of Stock Trends”. To use it correctly we should assume that a bear market remains intact until this line is breached by a close of 3% or more of market value. In practice, that price point would be a new all time high which would invalidate any bear wave count.
This wave count requires price confirmation with a new all time high above 2,134.72.
While price has not made a new high, while it remains below the final bear market trend line and while technical indicators point to weakness in upwards movement, this very bullish wave count comes with a strong caveat. I still do not have confidence in it.
DAILY CHART
Click chart to enlarge.
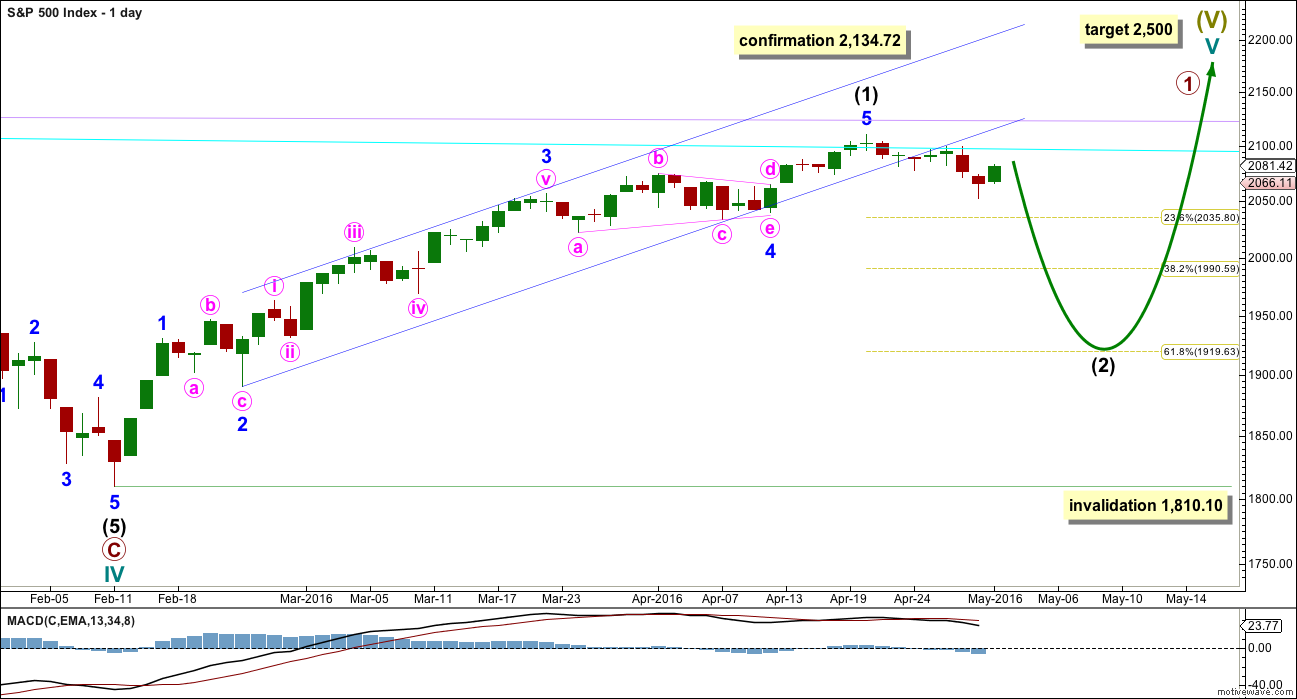
If the bull market has resumed, it must begin with a five wave structure upwards at the daily and weekly chart level. That may today be complete. The possible trend change at intermediate degree still requires confirmation in the same way as the alternate hourly bear wave count outlines before any confidence may be had in it.
If intermediate wave (2) begins here, then a reasonable target for it to end would be the 0.618 Fibonacci ratio of intermediate wave (1) about 1,920. Intermediate wave (2) must subdivide as a corrective structure. It may not move beyond the start of intermediate wave (1) below 1,810.10.
In the long term, this wave count absolutely requires a new high above 2,134.72 for confirmation. This would be the only wave count in the unlikely event of a new all time high. All bear wave counts would be fully and finally invalidated.
TECHNICAL ANALYSIS
WEEKLY CHART
Click chart to enlarge. Chart courtesy of StockCharts.com.
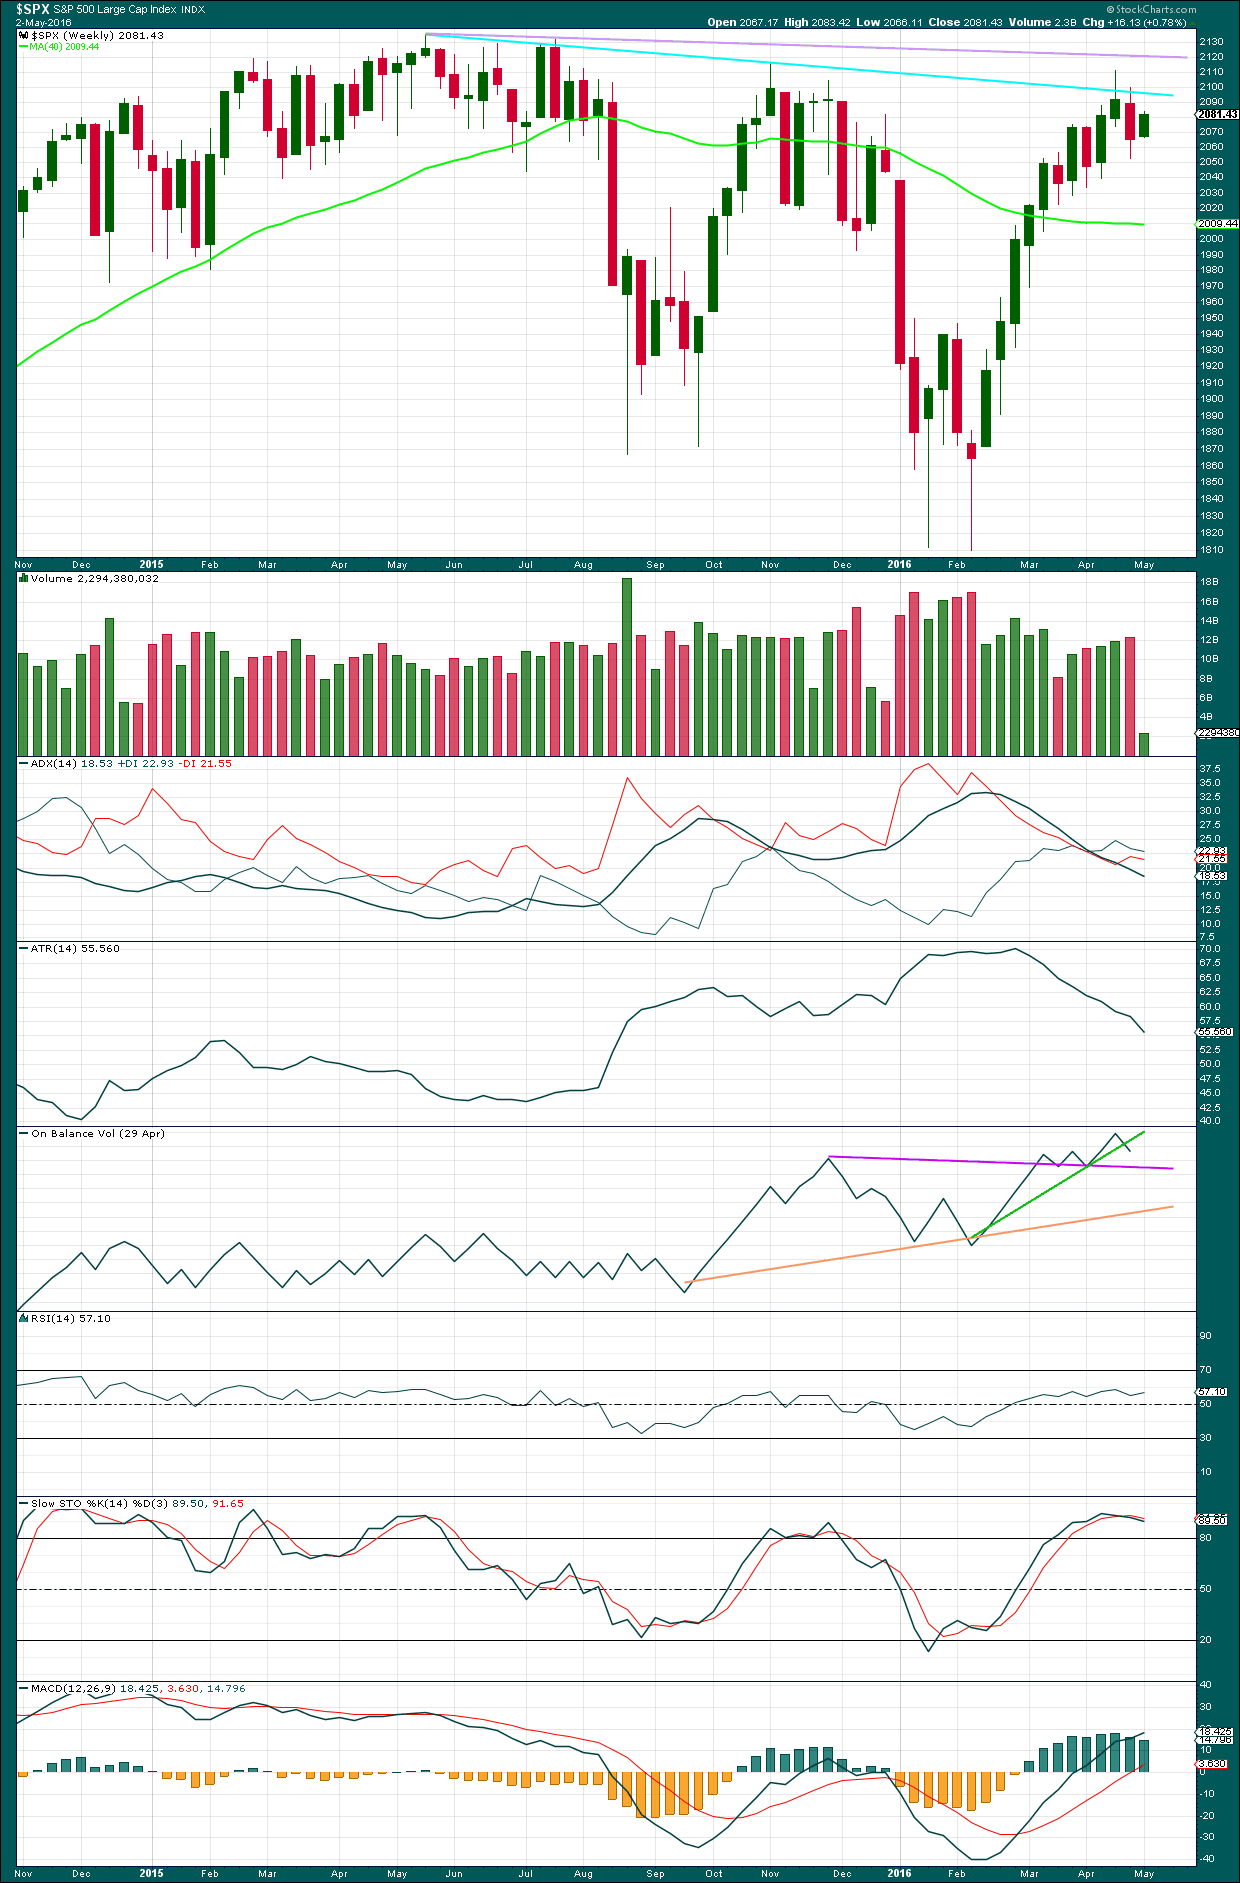
We have a bearish engulfing candlestick pattern at the end of last week. This has occurred at the round number of 2,100 which increases the significance. Volume on the second candlestick is higher than volume on the first candlestick, which further increases the significance. That it is at the weekly chart level is further significance.
Engulfing patterns are the strongest reversal patterns.
This is a very strong bearish signal. It adds significant weight to the expectation of a trend change. It does not tell us how low the following movement must go, only that it is likely to be at least of a few weeks duration.
There is a weak bearish signal from On Balance Volume at the weekly chart level with a break below the green line. A stronger bearish signal would be a break below the purple line. OBV looks bearish.
There is hidden bearish divergence between Stochastics and price at the last high and the high of November 2015. Stochastics has moved further into overbought territory, but this has failed to translate into a corresponding new high in price. Price is weak. MACD exhibits the same hidden bearish divergence.
After a period of declining ATR, it should be expected to turn and begin to increase.
DAILY CHART
Click chart to enlarge. Chart courtesy of StockCharts.com.
Volume data on StockCharts is different to that given from NYSE, the home of this index. Comments on volume will be based on NYSE volume data when it differs from StockCharts.
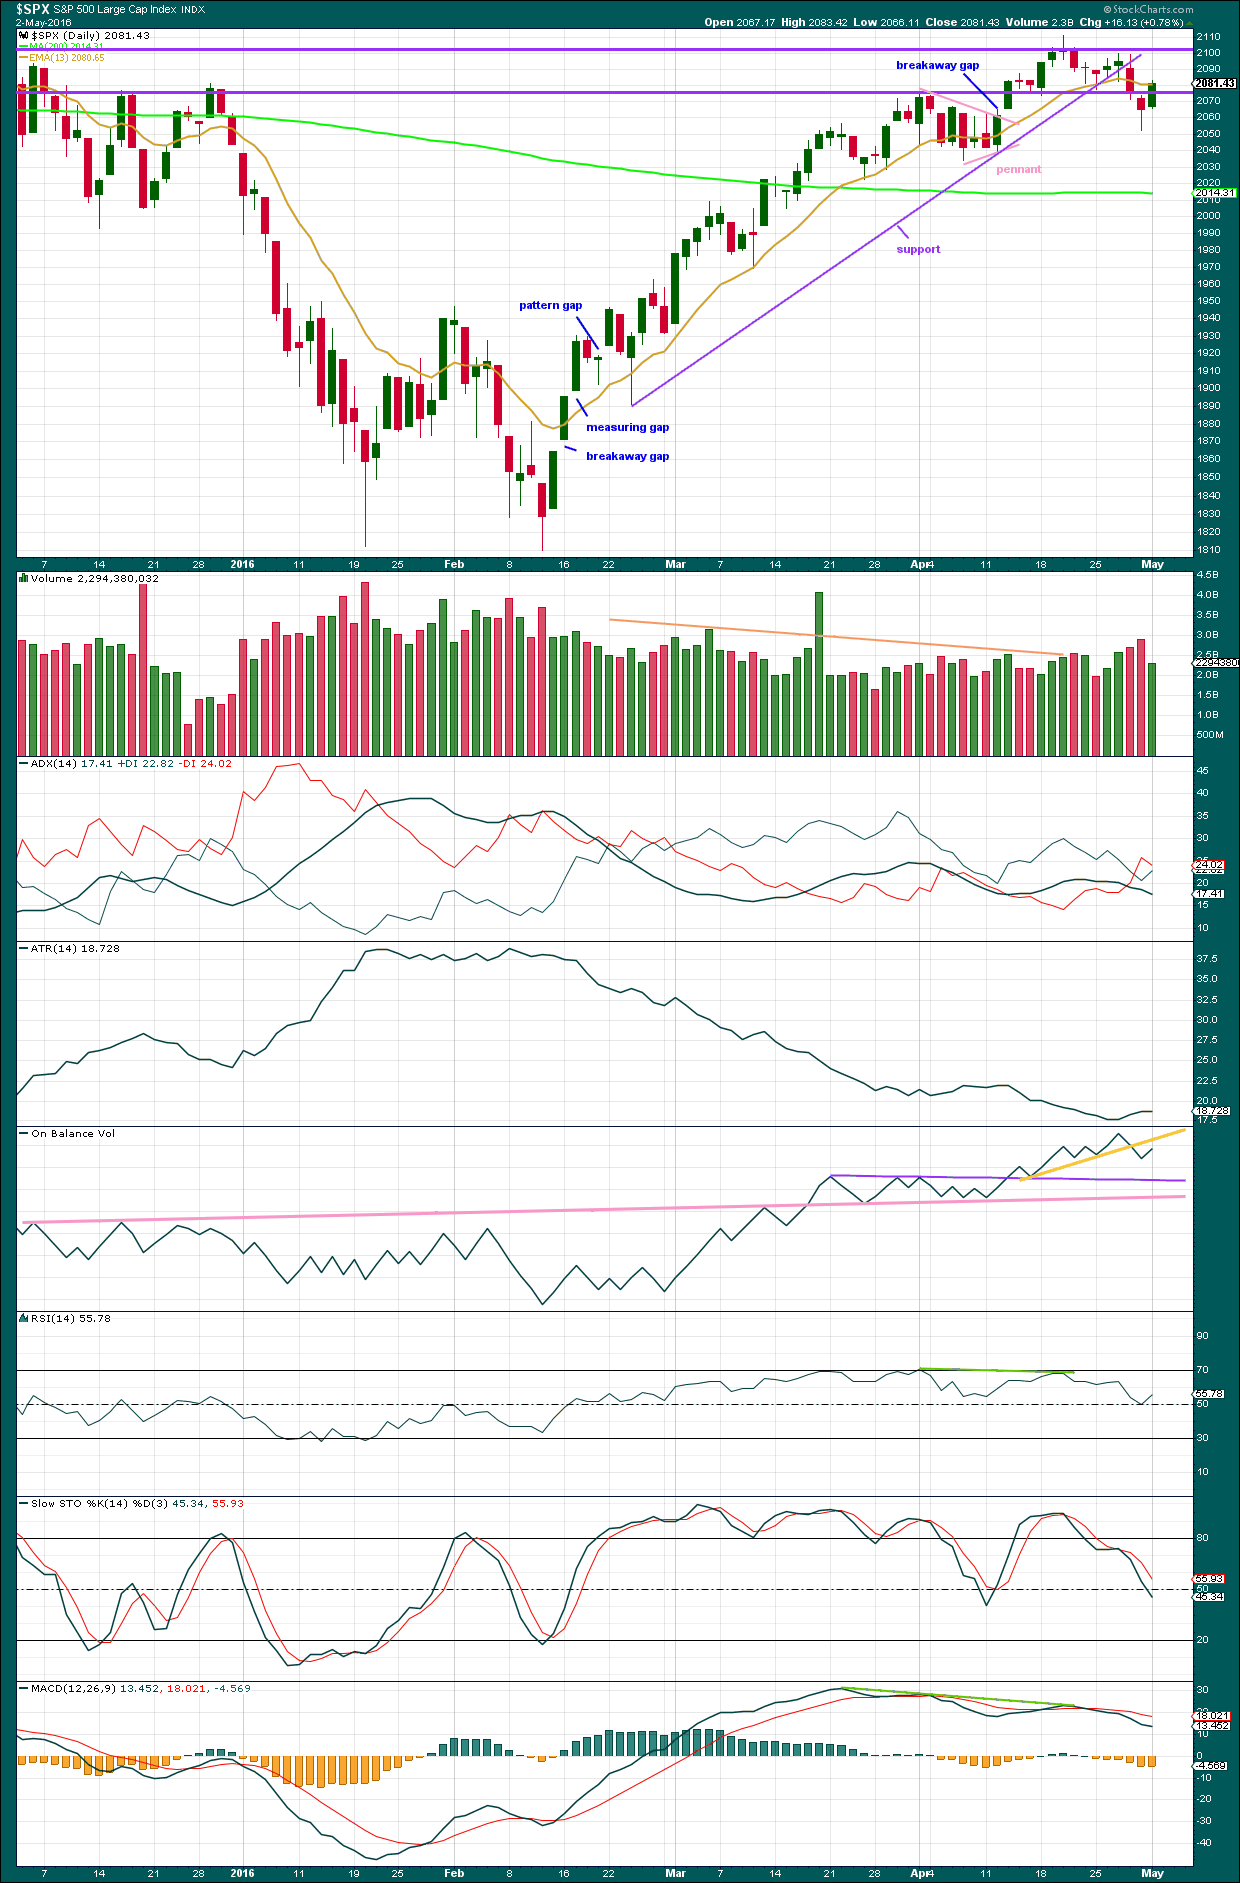
The support line is clearly and decisively breached. This strongly indicates the S&P has seen a trend change.
Two days in a row of falling price come on increasing volume. Both days have volume higher than all prior upwards days right back to 7th March. This looks like a downwards break below support. Now a small upwards day has lighter volume. The rise in price for Monday was not supported by volume, so it is suspicious. This supports the main hourly wave count.
Price may come up to test the round number support / resistance at 2,100. This looks possible today because price has closed above the lower support / resistance line at 2,080.
The 200 day moving average has flattened off after showing a very slight increase. It is again indicating the bear market is intact. There has been no new major swing high, so the last wave up from February to April is likely to be fully retraced.
An Evening Doji Star candlestick pattern is completed at the last high. This is a reversal pattern and offers some support for expecting a high is in place. The fact that this pattern has occurred at the round number of 2,100 is more significant. There is light volume on the first candle in the pattern and heavier volume on the third candle in the pattern. This increases the probability of a reversal.
On Balance Volume is giving a bearish signal with a break below the yellow line. This is decisive, but the line does not have strong technical significance. A stronger signal would come with a break below the purple or pink lines.
ADX is indicating a trend change with the +DX line crossing below the -DX line. If the ADX line now turns up, it would be indicating a new downwards trend.
ATR may beginning to turn up. After a long period of declining, ATR should be expected to again show an increase. It is important to note that ATR declined while price moved higher for over 40 days. This is not normal for a trending market. There was something wrong with that wave up. If it was a bear market rally and not a new bull market, then declining ATR makes more sense.
Neither of RSI, MACD nor Stochastics are extreme. There is plenty of room for this market to fall.
INVERTED VIX DAILY CHART
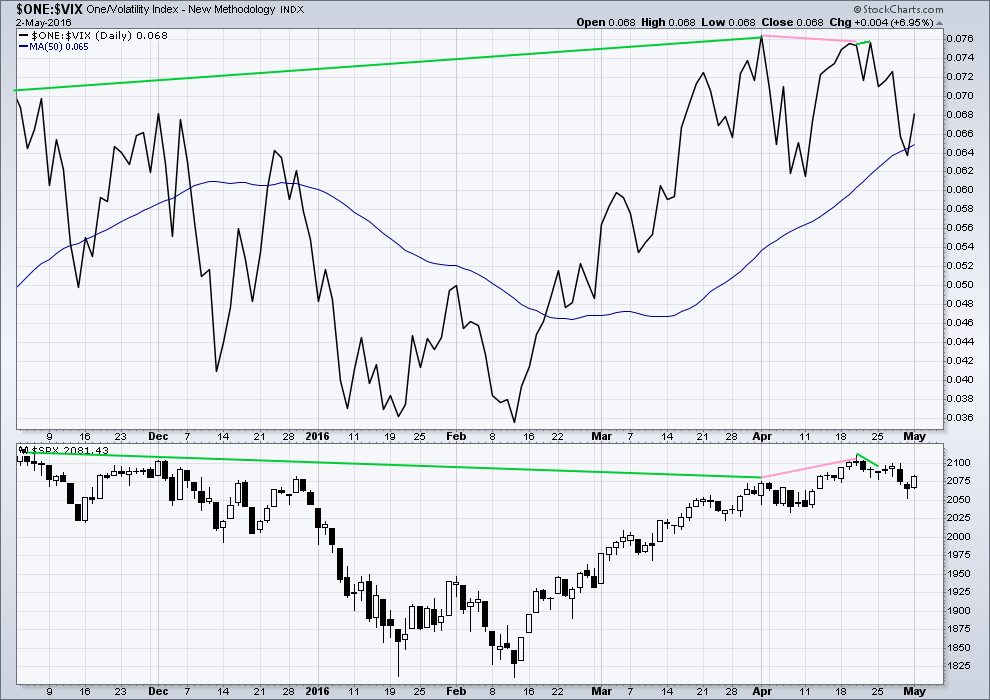
Click chart to enlarge. Chart courtesy of StockCharts.com.
Volatility declines as inverted VIX climbs. This is normal for an upwards trend.
What is not normal here is the divergence over a reasonable time period between price and inverted VIX (green lines). The decline in volatility is not translating to a corresponding increase in price. Price is weak. This divergence is bearish.
Price made a new short term high, but VIX has failed to make a corresponding high (pink lines). This is regular bearish divergence. It indicates further weakness in the trend.
ADVANCE DECLINE LINE

Click chart to enlarge. Chart courtesy of StockCharts.com.
With the AD line increasing, this indicates the number of advancing stocks exceeds the number of declining stocks. This indicates that there is breadth to this upwards movement.
From November 2015 to now, the AD line is making new highs while price has so far failed to make a corresponding new high. This indicates weakness in price; the increase in market breadth is unable to be translated to increase in price.
It remains to be seen if price can make new highs beyond the prior highs of 3rd November, 2015. If price can manage to do that, then this hidden bearish divergence will no longer be correct, but the fact that it is so strong at this stage is significant. The AD line will be watched daily to see if this bearish divergence continues or disappears.
The 200 day moving average for the AD line is now increasing. This alone is not enough to indicate a new bull market. During November 2015 the 200 day MA for the AD line turned upwards and yet price still made subsequent new lows.
COMMITMENT OF TRADERS (COT)
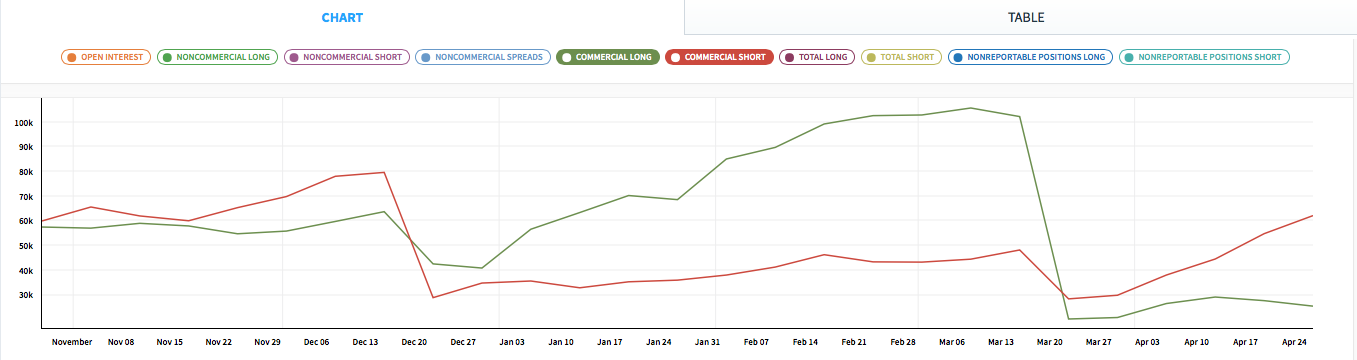
Click chart to enlarge. Chart courtesy of Qandl.
This first COT chart shows commercials. Commercial traders are more often on the right side of the market. Currently, more commercials are short the S&P than long. This has increased last week while long positions have decreased. This supports a bearish Elliott wave count, but it may also support the bullish Elliott wave count which would be expecting a big second wave correction to come soon. Either way points to a likely end to this upwards trend sooner rather than later. Unfortunately, it does not tell exactly when upwards movement must end.
*Note: these COT figures are for futures only markets. This is not the same as the cash market I am analysing, but it is closely related enough to be highly relevant.
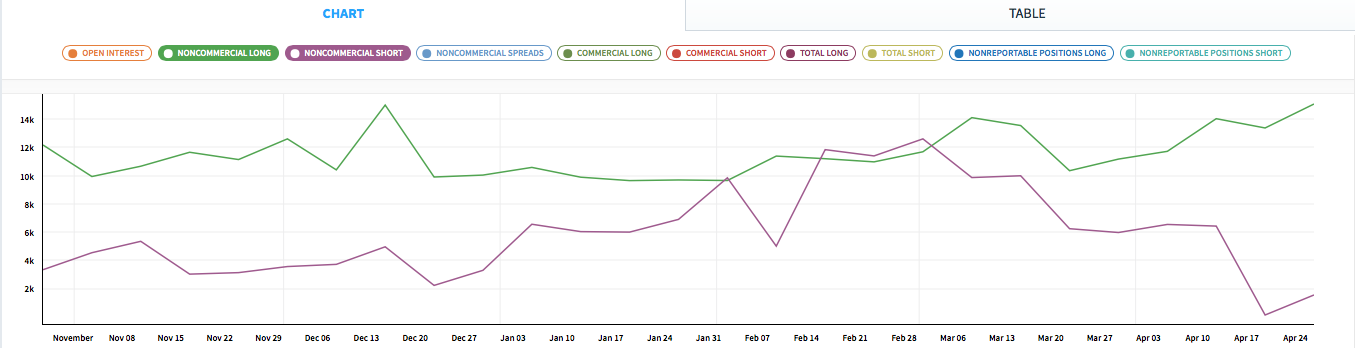
Click chart to enlarge. Chart courtesy of Qandl.
Non commercials are more often on the wrong side of the market than the right side of the market. Currently, non commercials are predominantly long, and increasing. This supports the expectation of a trend change soon.
DOW THEORY
I am choosing to use the S&P500, Dow Industrials, Dow Transportation, Nasdaq and the Russell 2000 index. Major swing lows are noted below. So far the Industrials, Transportation and Russell 2000 have made new major swing lows. None of these indices have made new highs.
I am aware that this approach is extremely conservative. Original Dow Theory has already confirmed a major trend change as both the industrials and transportation indexes have made new major lows.
At this stage, if the S&P500 and Nasdaq also make new major swing lows, then my modified Dow Theory would confirm a major new bear market. At that stage, my only wave count would be the bear wave count.
The lows below are from October 2014. These lows were the last secondary correction within the primary trend which was the bull market from 2009.
These lows must be breached by a daily close below each point.
S&P500: 1,821.61
Nasdaq: 4,117.84
DJIA: 15,855.12 – close below on 25th August 2015.
DJT: 7,700.49 – close below on 24th August 2015.
Russell 2000: 1,343.51 – close below on 25th August 2015.
To the upside, DJIA has made a new major swing high above its prior major high of 3rd November, 2015, at 17,977.85. But DJT has so far failed to confirm because it has not yet made a new major swing high above its prior swing high of 20th November, 2015, at 8,358.20. Dow Theory has therefore not yet confirmed a new bull market. Neither the S&P500, Russell 2000 nor Nasdaq have made new major swing highs.
This analysis is published @ 09:47 p.m. EST.
FYI
I haven’t forgotten about Nasdaq. Will do today.
S&P to be published very shortly…
Good morning everybody. Quite the chatter house this place is today!
If I miss any questions anyone has asked me below then please repost at the top of comments.
Updated chart. Another 1-2. That makes three.
The pink channel is an acceleration channel. As price makes new lows we’ll keep redrawing it. When minute iii is one it will be an Elliott channel to show us where minute iv may find resistance.
I’m slightly concerned about the lack of momentum to subminuette i. Tomorrow has to print a strong red candlestick for confidence.
It looks like upwards corrections are finding resistance at the pink trend line. So if price touches that again it may offer another good entry point for a short. BUT as always, I may be wrong. Here minuette (ii) could move higher as a double zigzag. While price hasn’t made a new low below 2,052.28 (the end of minuette (i) ) that is entirely possible. Risk is still at 2,099.89.
It always feels so counterintuitive to open a short when price has been moving up. It’s one of the hardest things to do. It got me. I hesitated a bit yesterday, then had to go out and didn’t open my short until I got home and price had turned. How annoying. But still, only a few points in the bigger scheme of things won’t matter in a couple of weeks.
It would help if I remembered to upload the chart wouldn’t it 🙂
Looking at all those overlapping waves of the last two hours I find it hard to believe that subminuette (ii) is finished. Bet we head up a little bit at the open to finish it.
Yep. We will probably hit the top of that channel for a final micro C wave up…
Yep, entirely possible.
Lara, I’m actually glad to hear that you yourself were a little uncertain about that trade. It highlights something important. You are our resident expert. If you are a little uncertain it shows that none of us can ever be certain about a trade either. No matter how much you analyze (or how many analysts you read) there is always inherent uncertainty; the markets are never predictable beyond a certain point. And that is really why risk management is so important.
I’ve been an analyst for longer than a trader.
My trading experience is small compared to many of the members here. Only a few short years compared to decades.
And so I’m the resident Elliott wave expert, and reasonably proficient with regular technical analysis. But I’m not the expert trader here.
I have the firm opinion that analysis skills and trading skills are quite different.
I can pick a few high probability low risk trade set ups for you, like breakout from consolidation followed by retest of support / resistance, that I have learned during my CMT reading. I can pick a few EW setups too.
But be aware, I am most definitely not the resident expert trader.
My CMT reading does give me an edge, and I’ve learned enough and paid enough $$ in losses now to know that risk management is THE most important aspect of trading. And so I completely agree with you there.
I does seem to have more mo than sub-min 1 of minuette one. Tomorrow should see things heat up a bit…
Final SPX Volume:
631.385 Million Today… not final yet.
599.422 Million Yesterday
And yesterday was the highest since March 7th. The current main bear count continues to look better and better each day.
Nice. That adds confidence.
SPY (S&P ETF) volume:
Today: 104.7 million
Yesterday: 62.2 million (lowest volume day of 2016)
here is the SPY daily with volume profile…you can see the anemic volume yesterday
Bulls simply trying to achieve a moral victory as they will get nowhere near a positive close.
An enormous amount of capital being expended to attain it…the trashing around today means they are conceding an ass-kicking tomorrow…
Huge cash dumps into the close being swatted away by the bears…this should get interesting shortly…
RSI Div on the 1 min – move down soon needs to prove itself or may well end up being an X wave with another leg higher on the cards imho.
Below 2057.85, price proves the move up from 2054.76 is corrective beyond any reasonable doubt imho.
Someone is still buying atm, albeit there is clearly also a smell of blood that the bears are latching onto.
100% Certain Volume to exceed yesterday… maybe by a lot.
Bull – Bear battle!
Incredible. This is a line in the sand.
I was fearing the EOD melt up… oh wait, there it is.
@$#&
Dam about to break. We should take out this morning’s lows before the close and get our gap and go tomorrow to finish minor one down intra-day…
30 minutes to go…my money is on that not happening (taking out today’s low)…i hope i’m wrong but lots of lower wicks on the 5 minute candles.
lot of volume stepping in (to the downside)….let’s get there Vern!!!!
Well Barry you were right…we will see what tomorrow brings… 🙂
This is soooo boring!
I don’t know about you, but this is much better than watching and waiting for where primary 2 or minor 2 would end… lol
Lets see if the action picks up. Hope!
If 2063 is taken out to the downside, the eye of this hurricane could be happening soon. Oh, I’m sorry. In NZ they are called typhoons. If 2063 stands, we have one more leg up above 2069+.
Partial bail point moved down to 2066.57 after that move below 2062.58 just now.
Should be better than break even on my last purchase – albeit UVXY doesn’t always play fair.
Cyclones.
Typhoons are in Asia.
In the South Pacific we call them cyclones. I love them. They send good swells to surf 🙂
Price just come back to kiss the lower trendline – Lara’s favourite setup 🙂
If it’s good enough for Lara!….. So added another 10% – up to 80%!
Will possibly bail on some of my position if we go above 2069.21, and seek a slightly better entry. We might still see a double zig zag to take us up a bit higher.
At this stage it’s not really much of a concern.
Here is my SPX hourly…right into the 50% retracement – lines not drawn perfectly (fidelity program stinks)…but directionally correct
1,2 + 1,2 on hourly… I don’t know what else to call it.
All the Indexes look exactly the same today on the 5 min chart.
Volume is higher today than yesterday and appears to be accelerating as the day goes on. this part removed.
Thanks for sharing Barry – I’m liking that volume profile. Hopefully that last red volume bar will go a bit higher soon, otherwise this move down might turn out to be wave X of a larger WXY double zig zag.
Wave W (or the whole ABC) looks done to me now. Base channel breached.
BTW – when I say ‘this move down’ I’m always talking very short term (unless I state otherwise) – so ‘this move down’ means from the 2069.25 high just now, not yesterdays minuette (ii) high.
Everyone who follows 1min / 5min action knows my time horizon – everyone else please ignore me 🙂
Purchased UVXY – now @ 70%.
We just perfectly kissed the 50% fib retrace – might be going for the 61.8 (2072.45) or 76.4 (2076.64).
Even a gap fill wouldn’t suprise me with this market so keeping a bit of powder dry.
Price currently trying to escape the upper base channel of the move from todays lows on the 1min
You are becoming quite the precision trading machine! Nice timing.
I’ve got a bit of dry powder I am saving for a few more UVXY calls once we clear 20 for my 10X trade….
We still might not be done whilst price remains in the base channel.
If we make another higher high the move from 2054 will count as a 5 (making the move from 2054 possibly a C wave with what I thought was an ED being AB of an expanded flat). That’s only if we get one more higher high short term – it might already be done.
Lower trendline of base channel then 2061.29 (Poss Wave A high) would be first confirmations this leg up is over.
Anyway.. it’s all corrective atm.
50% re-tracement in area of 2068….
C = 1.618*A also @ 2068 🙂
It’s done enough to be the whole bounce now (rather then just Wave A) imho
1-2, 1-2, 1-2
The screws are being tightened. The coil is undergoing increasing of tension. When it springs, we go through 2039. My guess.
Dear Beginners to Elliott Wave analysis. A warning:
Listening to all this conversation about 1 minute and 5 minute chart patterns and waves etc., could prove detrimental to your sanity. If you are just learning EW, stick with the hourly charts until you know more. Then move to the five minute if you want. Finally, if you want to challenge your sanity engage in 1 minute EW analysis.
Do not say you have not been warned. At this point of the day I sometimes I read this blog for many minutes and it all becomes confusing. So I let it go in one ear and out the other for the sack of my dog and family. They need me to retain my mental capacities whatever I have left.
(New members please also note I like laughter and to have fun. No better way that to laugh at myself.)
That’s assuming you have sanity to challenge.
I consider myself immune 🙂
Wazzat??!! 🙂
Rodney – try teaching your dog EW (start with daily charts of course).
All of a sudden 1min EW analysis doesn’t seem that insane at all 😉 🙂
True story (twitch)….
Second 5 wave structure (wave c) of a zig zag from todays low just completing I think.
I’m expecting that this is wave A of a larger ABC, albeit if this correction is very shallow then this might be the whole wave.
Might extend a bit whilst price remains above 2061.31
3,3,5 off the lows..
*edit* Just saw Joseph’s comment and I agree…
Series of 1, 2’s followed by a,b,c. is what I see. All corrective. Looking at 5 min. chart.
O.K. Now looking more like a W2 up….
Hi Lara,
First time subscriber and first time to post. I am new to EW analysis so I appreciate your candid, thorough updates. I do have a quick question:
You have given a potential target for this current down wave (2012). What are the signs/signals that you look for to signal the next 3 wave up is starting?
A trend line or channel breach after the structure of the third wave may be seen as complete.
DAX also had a big move down then traded sideways for the rest of the session. It seems US markets following suit….
Looking quite weak for a wave two bounce; could four be continuing?
Looks like that was a fourth wave of sub-min three and sub-min two now just getting started…
If that was an ending diagonal down to todays low, then I can count 5 down from 2083. If so then this bounce could be Sub-Minuette (ii) with 61.8 fib target of 2072.45.
That is totally unconfirmed at this point (I might have rushed the ED count). We should expect suprises to the downside rather than to the upside.
I’m certainly not trading any bounces, just using them to get more short (I know you know that, but there may be others here that don’t – I’ll stop pointing that out now!).
EDIT – Sorry you’re right – it is sub-minuette (I originally though it was minuette). I forgot we’d moved it all down one degree. I have altered my above comment.
Think we might be due a bounce up soon (please nobody trade based on my short term comments – the regular guys here already know better!)
Poss ending diagonal completing right now. Could also be a series of overlapping 1,2s that are about to dive lower (hence why nobody should trade it – just go with the trend which is down!). Above 2061.80 increases confidence a bounce has arrived.
I’m looking to add to my short position on a bounce, hence my interest in one.
I see… a series of 1,2’s. But… who knows???
Yep could well be – surprises to the downside!
Good advice. I think the first good opportunity for a counter-trend trade will not come until minor two up…
Anyone heard anything more about the PR default?
It is really a head-scratcher how the market seems to be completely ignoring the implications… 🙁
They defaulted on $422 Million.
I think they have an even payment due in June or July.
AC NJ avoided default… but in June has a $2 Billion payment due. They have no idea how they will come up with that money.
Illinois/Chicago aren’t far behind.
Illinois hasn’t even had a budget for over a year. Lots of unfunded pensions. Still borrowing at junk ratings. Once things get to this point there are no solutions other than restructuring.
Yep. I live in Illinois and it has been amazing watching the politicians get themselves ever deeper in the mire. I feel sorry for all those folk expecting the state to honor its comittments in the form of pension payments. I hope they have a plan B…
Yeah, Illinois resident too. No plan B, just kicking the debt down the road till implosion occurs. I don’t know who would buy their bonds issues. Chicago collapsing would make Detroit’s BK look like a walk in the park.
The Federal Reserve without telling anyone.
Sorry I mixed up the stories…
Puerto Rico and its agencies owe $2 billion July 1, including $805 million in GO Bonds. There is no way they are going to make this July payment in full… impossible!
AC NJ:
“Financially, we’re running on fumes,” the mayor told reporters Monday.
But, the mayor noted, the city has about $240 million in bonded debt, has only about $6 million in money on hand, and will run out of cash possibly by next month if the state doesn’t provide aid. He said he can’t guarantee the city will be able to make the next debt payment due in June.
AC NJ: The city’s June obligations total $1.6 million, according to Moody’s.
I heard they are going to have to decide whether to pay their interest, or pay their firemen and police…
I know which option I’d go with!
Mathematically most of the debt is never going to be repaid (though I am no expert on US states)
Everyone needs to just default already, get the pain over with and allow room for new grass to grow.
In Florida I have often seen the Fire Service out at traffic lights collecting money – I initially presumed they were collecting for charity but it was to shore up their own finances!!
That is Orange County (FL) I am talking about (which has some of the most profitable tourist attractions in the world). If they are struggling there then god only knows what is going on in other states / counties.
Not seen the Police doing it – I read that they just confiscate (i.e. steal) what they need without bothering to ask.
Detroit restructured and it has done well. Actually a pretty vibrant scene there now. Take the harsh medicine and move on.
The first to take the pain should come out best imho. Greece is having a hard time but at least there is still money around to bail them out – who will bail out everyone else???
They should either short the S&P or buy some UVXY. They should be able to make a payment come July…
Que sera…sera!! 🙂
Volume higher today than yesterday at this time 11:24AM
This corrective action looks & feels like it may break lower at an moment.
The banksters are putting up one helluava fight against this potential quadruple third wave down….some things never change… 🙂
UVXY locked on the North star so far…something’s gotta give….!
Monster cash dump! Who exactly are those morons??!!
It is quite rare to see VIX, VXX, and UVXY all trading at or near the same price. That usually means there’s gonna be some serious changes!! 😀
What, reverse split time?
Naah! Not likely unless it (UVXY) trades substantially under ten….more like that UVXY outpaces the others to the upside…
A few more of those UVXY bears are about to get a notice of dues now due…
Yep…C up still unfolding. I forgot one degree. Next should be sub-min three of minutette three of minute three of P3…
Of Minor 1 of Intermediate 1 of P3 😉
More degrees than a 90 year old student 🙂
No kidding! 🙂
Trading tactics: I’m in my positions / wagons until we see the end of intermediate 1 or 1950 thereabout whichever comes first. Then it is time to unload most if not all wagons and give the horses a rest. I do not like to trade second waves or b waves. Depending on the size they are great for a mental rest period before the next wave with the trend begins.
Sub-min one of minuette three complete; we should see a shallow corrective sub-min two up…to be followed by triple thirds methinks…
That was quick…if it is indeed done, this is the way a P3 down should comport itself, all business, no bull_ _ _t 🙂
…or maybe that was just B of an ABC….?
How corrective can a b wave be? Do we just have to go below minute wave i to know that ABC has completed.
B in and expanded flat can and usually does travel more than 100% of A – after 2x A it is very unlikely the correct labelling so should be discarded, but does not break any rules. B in a running triangle also travels more than 100% of A.
BTW – Learning EW takes years – even when you know all the rules, seeing the various possible counts and knowing what is more probable takes a long time. You’ve just got to keep at it and after a while it will start to make sense in real time (I’ve been using EW for trading for over 5 years and I’m still learning).
The main thing is that we now know that (ii) is corrective so you can quite confidently short the market if it goes higher knowing that the market should turn around and your position become profitable at some point.
This is why I don’t trade options – the situation I point out in the paragraph above needs time in order to work.
Thanks Olga, everyday is a school day as they say 🙂
One of the things I always wondered when I started using EW is: does it really work?
The answer is yes it does – but it is not a crystal ball. At best it provides very high probability outcomes and at worst quite alot of equal probability possibilities, the latter being those times you should SOH (sit on hands!)
You are definitely the senior analyst after Lara… 🙂
Dunno about that but cheers anyway mate 🙂
Long time ago I gave up trying to become a pro at EW counting. That is why I came to this site. I did not realize at the time how good a teacher Lara would be for me. Not only that, but I had no idea Olga would be here teaching day in and out. I have learned so much and it has been by osmosis. Thanks Lara and Olga and all the rest who share TA etc. I keep learning and it is fun to me, mostly when it is also profitable.
Agreed.
I sneaked in a short yesterday @ 2081 to limit risk with 2102 stop
Olga,
I’m having trouble seeing the count. From 10:15 to now it looks like a triangle or zig-zag sloping downward. Is that minuette ii? I would have thought ii would have been more of an upwards move. Any clarification you can/want to offer would be so helpful. Thanks!
I’m looking for a bounce for an opportunity to short, but I haven’t seen anything I feel good about.
That word “feeling” in your comment is something to consider.
When we have a trend confirmed (and we can have some reasonable confidence with this trend, at least short / mid term) then the best entry is at the end of a small countertrend movement.
As traders that is psychologically the hardest thing to do. To enter when price has just corrected and is moving against the trend. It feels wrong. It won’t feel good.
Trying to cancel emotion and trade according to rules. Figure out your high probability / low risk setups and follow that. Manage risk.
If it doesn’t feel good then reduce position size until it feels okay. Reduce risk.
Long-time subscriber here, first time comment…
What’s our expectation that $SPX will want to return to fill this morning’s small gap?
If it’s a breakaway gap then don’t expect it to be filled. If it’s a pattern gap then it may be filled.
There is a myth out there that gaps will be / must be filled. It’s not correct. It depends on what type of gap. And that’s open to interpretation.
It’s my interpretation that it’s a pattern gap because S&P has essentially been moving sideways. But if it’s the last pattern gap in the pattern it may not be filled. And looking at what the other indices are doing at this time (strongly lower, new lows) it looks like a downwards breakout is imminent.
A couple of market makers ganged up to shake me out of my IBB short position yesterday…looks like they are having second thoughts about that manouervre this morning…
UVXY is being a bit sluggish – should be over 18 on a move down like this.
A few of ’em may have covered from the 16 basing area but most of them have not and probably won’t until we are down another 25 SPX points. The folk from the 20 area are not even thinking about it….yet! 🙂
A good plunge would do the trick…
regarding UVXY..i was thinking the same thing
We will know when they start covering and going long when we see a few consecutive gaps up on very high volume. It could take minor three down to do it…
Gidyap! 🙂 🙂 🙂
I think the next stop will be the 2000 pivot which the banksters are going to do their utmost to defend and usher in a minor two bounce…
Minuette (iii) will be 1.618 (i) @ about 2007.
I’m not too fussed as long as we go below 2039 in the near future.
Should now be in Minuette (iii) of Minute (iii) so should have a tail wind now.
I was just thinking that, just watching Lara’s education videos, so if we are in minute iii down we should have iv correction and v down before we start a minor 2 bounce. All gets a bit confusing still for me but I think I’m following!
Yep. You’ve got it there.
Market just passed under wave b @ around 2068.97 proving the move up from Friday was 3 waves. We might only have had wave A of an ABC, but I think it is probably complete. I will be adding to my UVXY position on any bounce now that this move is proven.
Also strengthens the case for the main bear count imho.
FWIW, thought I would post today’s cycle analysis. Take with a grain of salt though given the impending primary 3, but it might help with a potential plan. The cycles look like a drop to pivot lows, a choppy recovery up then the crash.
I am no EW expert (thats why I’m here 🙂 but I’ve traded for a good long time, and normally the S&P tops tend chop and grind a bit before they cut loose to the downside. Of course, these aren’t normal times 🙂
Thanks David – I’m no expert on cycles but very much appreciate the heads up
Yeah. The sweet spot is going to be intermediate three of P3, probably sometime in the fall. I think minor two up is going to be relatively quick but intermediate two of P3 is going to be a long slow Summer grind…
Yep.
Only once we’ve passed the middle may it start to feel… fast.
We still have second wave corrections to come. Minor 2. Intermediate (2).
And then what about cycle II?
And cycle III !!!! That one will be the craziest of all. Probably won’t be able to short that though. That will be capital preservation time.
I was thinking last night how often do we see a Primary 3 down. Some of us have been waiting for this moment for a long time. It has seemed so very elusive and tried our patience for months on end. It has been eight years in the making and it will all come undone in less than two, perhaps in less than one year.
Anyone here old enough to remember 1987?
Yes… Lost a ton! That was in fact a crash!
Yeah, a shocker. Talk about a plunge…
Margin calls + Options expired worthless = Huge Loss… Between that & 2000… still writing off vs gains & -3000 on each & every tax return since.
I avoided 2007-2009 as I saw that MTG blow up coming… moved all retirement funds to Index Annuities in 2006 – didn’t play short… not enough capital and what I had did not want to risk. It’s different now though.
I can score in two ways now Big Gains & Big Tax Free Gains as I can finally wipe out capital loss carry forwards. At least that is the hope!
Yeah, I have some carry overs too, esp from a couple of nasty BKs from longs gone wrong (GT Advanced Technology for one).
Hope this year eats away a good amount of them.
Metromedia Fiber Network was the worst of many Tech long positions that had gone bad. Up to the qtr. before BK had $1.2 Billion in cash on the Balance Sheet. I still don’t understand where all that went. Bogus accounting???
I thought I was the only one with continuing $3,000 per year capital gains loss.
I still have the date of that crash on my calendar an annual reminder, so it comes up every year.
I was in my last year of high school in 1987 and I remember it well. All the girls (girls school) were chattering about it, many families lost a lot of money. It dominated our media and conversation.
It was absolutely huge in NZ. A huge economic shock. To this day Kiwis don’t trust the stock market.
It took NZ a long time to recover from it.
Oh yea!
Well the pattern holds. It seems the banksters can now buy futures deep out of the red only one day at a time – a great tell I will continue to keep my eye on to signal future impending declines.
Hey Olga, I see from the pre-market you are going to be ahead by a full point on yesterday’s trade while I am going to have to make do with a lousy 0.70 cents and I want you to know I really resemble that! 🙂
(as an old college acquaintance with a penchant for the wrong word would say)
Yeah – let’s see how long it lasts!! 🙂
A moment of honesty….. I stupidly forgot I had a buy order set for a full 100% position at UVXY 15 – so my 10% order got filled and another 100% taking me to 140%!!!
UVXY then (yesterday) went down to around 14.70. Man was I sweating about that – these kind of mistaked with UVXY can get you killed.
I sold the 100% position when UVXY came back up at 15.05 – kinda wish now I had kept it (would have been **seriously** in profit) – but the risk management in me wouldn’t allow it!!
The only way to hit a home run in one at bat is to swing for the fences.
The only way to score a quick touchdown is to throw for the end zone.
You did the right thing in selling the 100% mistake. But isn’t it something when we so often look in the rear view mirror seeing what might have been.
Your nimbleness in managing your account blows my mind some times. I am too simple. It amazes me how you and others can keep track of all your strategies and especially positions.
Totally agree – but then, that rear veiw mirror can also be a dangerous thing imho. Mr Market uses that on people to lure them into thinking the same will happen in future – just before switching sides…
I feel the need to watch UVXY like a hawk. If I was trading something a little less volatile I’d relax a bit (afterall, the more you trade the more mistakes you’re likely to make), but UVXY is a wily old bird that demands the utmost respect!! 🙂
Luckily the EW pattern was close to completion so I could hold for a break even, otherwise I would have probably sold the mistake at a serious loss.
Really stupid mistake and not the first time (my favourite is setting a buy order instead of a sell when quickly trying to scalp a move)
I have unintentionally entered an order twice and filled it. I have a host of those mistakes. Doesn’t my computer know I am sometimes stupid? All my friends know.
lol 🙂 🙂
I hope at least newer traders learn something from our mistakes.
(albeit I never seem to learn from my own!)
My broker will prompt me for confirmation if it’s the exact same order within 60 seconds…
My broker don’t give a hoot!!
LOL 🙂
You guys really crack me up
I’ve done the same silly mistakes. I think we all have.
Nice to know we’re not alone and the experts are fallible too.
While waiting for the sweet spot of a third down, I manage my UVXY shares my selling deep in the money calls against the position at the end of impulses down. This nicely cushions the draw-down during corrective wave re-tracements. These covered calls will easily return 50 -80 % very quickly, especially if they are near dated, and I like to buy them back as soon as they have fallen 50%. You can really juice the trade by using the proceeds from the calls to buy UVXY puts while the market is correcting and use the profits to add to your UVXY holdings. This allows you to hold onto the shares for the ride all the way down, but make them work while you are waiting. These double and triple vertical trades are clearly not for everyone but you can generate some truly explosive returns when you learn how to trade ’em.
Tell me about it. A few days ago I went to sell a position from my order status (as opposed to position) window, forgetting that when you do that it automatically gives you a buy execution. I zigged when I meant to zagg and man I really hate that- a costly mistake, thankfully only a few contracts….
Yep – done that far too many times. And it is always at the worst possible time (market just turned the other way / EW invalidated short term from what you thought was playing out – hence the haste which causes such mistakes) – and so the loss on the mistake instantly racks up at speed!!
It is absolute madness, but I think I have probably lost more money in last 2 years due to mistakes like that than to actual trading.
Exactly!!! Really, really sucks, doesn’t it??!!! 🙂 🙂
Yeah, I saw that move down below 15 and was fairly confident we would not see a lower low at this second wave of lesser degree. As Rodney smartly pointed out, I had my eye on the top of that falling wedge and it just about hit it perfectly. I tend to have a bit of a trigger finger when I see these types of trades setting up and sometimes don’t wait for the referee’s gun…one of the dangers of trading a familiar beast. 🙂
Looks like we got a break of that 5 min channel, looking at my chart the resent decline could it still be a possible b wave decline and we could still be awaiting a wave c high? Just a maybe?
Yes, that’s what I thought too.
But then I figured that any entry about here should be good mid term. And the second wave has corrected to the 0.618 Fibonacci ratio, so the probability is good that it is over.
Doesn’t mean it has to be.
I’ve just added to my short position with my stop at 2,102.
A lot of savvy traders are watching 2039.74. If you think volume has ramped, just wait until we break that inflection point and watch it explode. After all, most traders are not gunslingers (like Olga and me! 🙂 ) , or sophisticated like Rodney, and are going to be conservative and wait for the confirmation before everybody and his parakeet jumps on the trade.
Here’s the interesting thing, we’ve been here before, and have had to endure the frustration of central bankster shenanigans in extending upward waves and keeping the bears at bay. Will this time be different? I think it will. Despite the happy-go-lucky blatherings of all the market perma-bulls touting SPX 2500 by the end of the year, the investing and trading crowd that have had that nagging feeling that the makret could be in serious trouble, are actually starting to smell it, trouble that is, and will conclude that something is rotting in Denamark, as it were. As we all know, sentiment tells the tale. We also know that the bankseters will not go “gently into that good night, and will continue to rage, rage, against the fading light.” This is going to result in some spectacular, violent, and swift declines as they fight tooth and nail. My advice is to ring the register early and often! Upward retracements could be long and deep. 🙂
I have been called a lot of things in my life and most of them are deserved. But I have never been called sophisticated. Now I am lifting my coffee cup with my pinkie pointing outwards and upwards. But thank you for what I perceive as a compliment.
With the VIX premarket up roughly 8%, your UVXY shares at 15 look like they will pay dividends starting today!
Lets take out SPX 2052 today!
Make sure you’re a sporting a ten carat on that pinky when you stick it out so it really gets noticed!! 🙂 🙂 🙂
Fourth balls. I am outta here!
Thanks Lara for the continued wonderful analysis. Great info on the two recent downs days having larger volume than any other day back to March 7th. I think that is significant so thanks for pointing it out.
If you did not read my previous post where I mention I am going on an expedition the first two weeks of July. I am counting on you to get the bulk of this move over by then. Thanks in advance.
Oh, by the way, how is the bear I brought back from the mountains doing? When you see him next, tell him I said “hello” but do it from a distance.
LOL
That bear is peeking and sneaking. He seems a bit shy. And if I see him I’m hiding. Fast.
Will do my best to get this show on the road by July. I think we have a pretty good shot.
Speaking of bears, here is another reason he is going to be feasting. I like Jim Rogers and think he is a pretty smart guy, but I have never understood his decision to uproot his family and move them all to China because he thought that was the country of the future.. That article makes a great case for PMs. Enjoy!
http://moneymorning.com/chinas-economic-slowdown-means-one-major-change-for-silver/?src=kitco3&test_id=1461870098
no no,,, you walked,, you are still in the game,, standing on first base
I wanted to be turd of the day, oops, third
You the man Thomas!
1st today!