
FTSE moved higher as expected. Targets for it to end were about either 6,453 or 6,518. So far price has reached up to 6,421.98.
Summary: FTSE is beginning to break below its trend channel, so FTSE may be turning. If the channel is breached, then the first target for a third wave would be at 3,796. The second target would be at 2,172.
MONTHLY ELLIOTT WAVE COUNT
Click chart to enlarge.
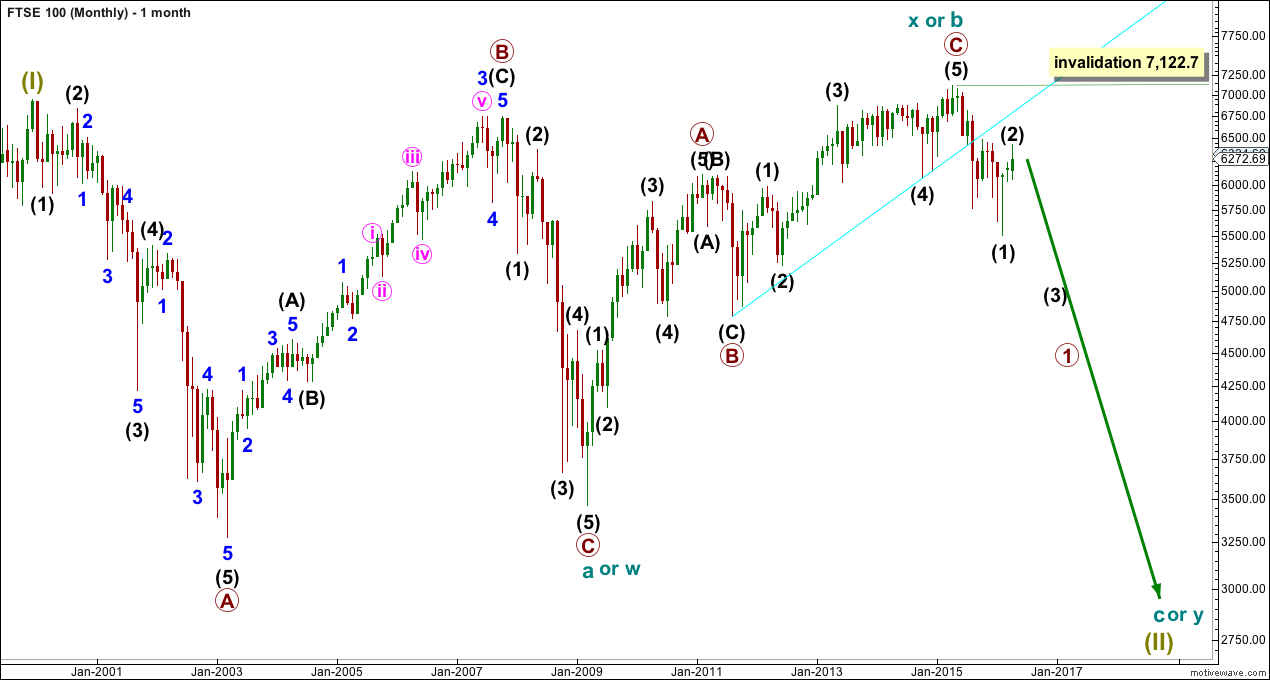
At the monthly chart level, FTSE is the clearest bear market.
The cyan trend line is drawn across the two major swing lows in the bull market which began on March 2009. This bull market trend line has been breached by a close well over 3% of market value, indicating a trend change from bull to bear.
The 200 day moving average is now declining (shown on the technical analysis daily chart at the end of analysis). Price has made a series of lower lows and lower highs. FTSE is in a bear market until proven otherwise.
From an Elliott Wave perspective, the downwards movement labelled intermediate wave (1) to the low in February 2016 has well overlapped back into the high labelled primary wave A of February 2011. This downwards movement may not be a fourth wave correction within an impulse unfolding upwards. So the prior wave up labelled cycle wave X or b must be over and it must be a three wave structure.
The cyan bull market trend line has provided resistance.
Super Cycle wave (II) is seen as either a large flat correction, a double flat or a double combination.
If Super Cycle wave (II) is a large flat, then within it cycle wave a was a regular flat and cycle wave b was a zigzag and 1.05 the length of cycle wave a. The length of cycle wave b indicates the most common type of flat, an expanded flat, may be unfolding. Cycle wave c downwards must subdivide as a five wave structure. Cycle wave c would be expected to end substantially below the end of cycle wave a at 3,460. At 1,477 cycle wave c would reach 1.618 the length of cycle wave a.
If Super Cycle wave (II) is a double flat, then the first flat in the double was a regular flat labelled cycle wave w. The double is joined by a three in the opposite direction, a zigzag labelled cycle wave x. Now a second flat correction should unfold sideways for cycle wave y. Cycle wave y would look similar to cycle wave w, with two large market crashes within it. It should end about the same level as cycle wave w at 3,460, so that the whole movement is a sideways structure.
If Super Cycle wave (II) is a double combination, then the second structure in the double for cycle wave y may be either a zigzag or a triangle. Either of these should reach down only to about the same level as cycle wave w at 3,460, so that the whole structure has a sideways look to it.
Of all these three options the simple expanded flat labelled cycle waves a-b-c is the most likely because expanded flats are very common structures.
WEEKLY ELLIOTT WAVE COUNT
Click chart to enlarge.
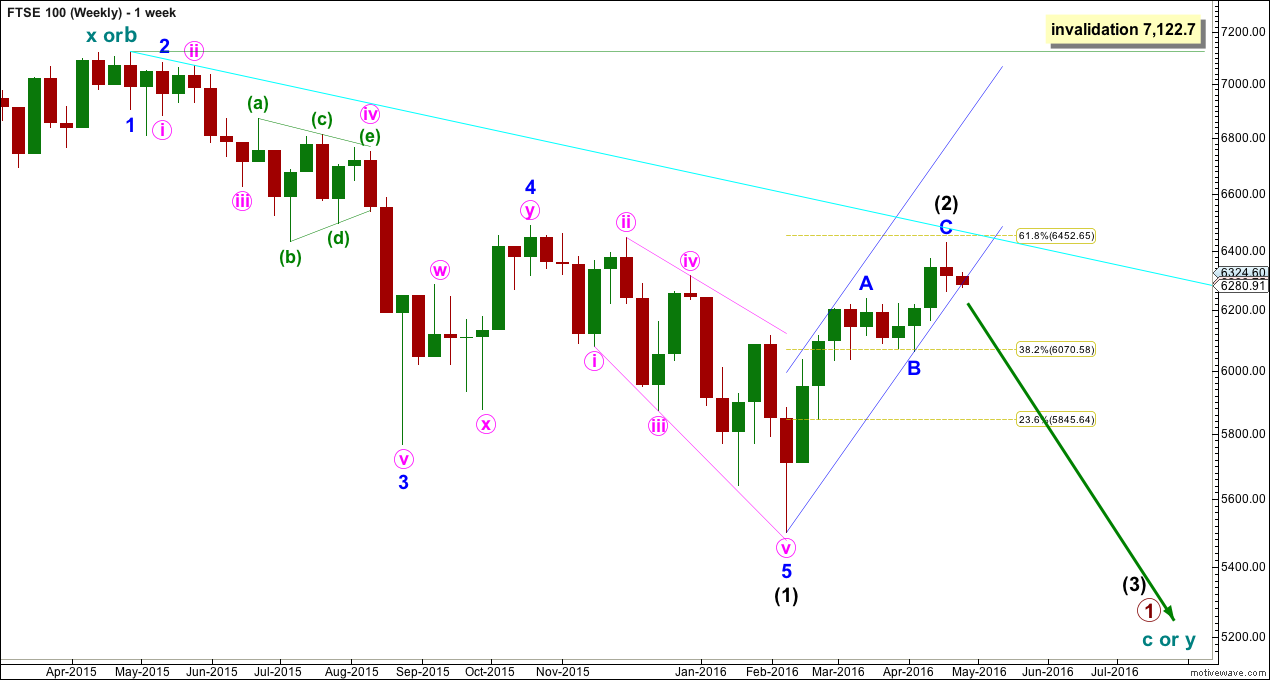
Intermediate wave (1) subdivides as an impulse. Intermediate wave (2) is subdividing as a zigzag. Only when the small blue channel about this zigzag is breached to the downside may confidence be had that it is over.
Intermediate wave (2) may not move beyond the start of intermediate wave (1) above 7,122.7.
DAILY ELLIOTT WAVE COUNT
Click chart to enlarge.
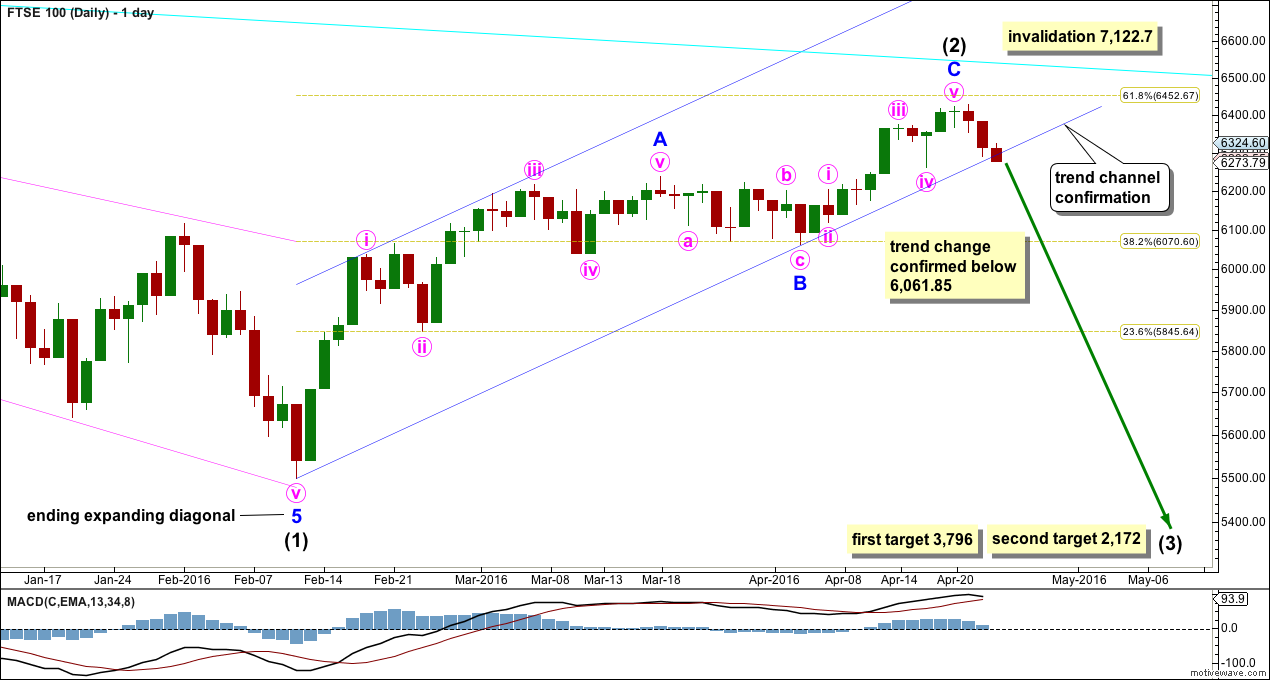
When the lower edge of the blue channel is breached by a full daily candlestick below the lower line and not touching int, that shall provide trend channel confirmation of a trend change for FTSE.
6,061.85 is the start of minor wave C. A new low below 6,061.85 could not be a second wave correction within minor wave C, so at that stage minor wave C would have to be over. A new low below 6,061.85 would provide strong confirmation that the bear market rally of intermediate wave (2) is complete.
The first target for intermediate wave (3) is at 3,796 where it would reach 1.618 the length of intermediate wave (1). If price gets to the first target and the structure is incomplete, or if price keeps falling through the first target, then the second target would be used. At 2,172 intermediate wave (3) would reach 2.618 the length of intermediate wave (1).
Intermediate wave (3) must make a new low below the end of intermediate wave (1) at 5,499.51.
TECHNICAL ANALYSIS
Click chart to enlarge. Chart courtesy of StockCharts.com.
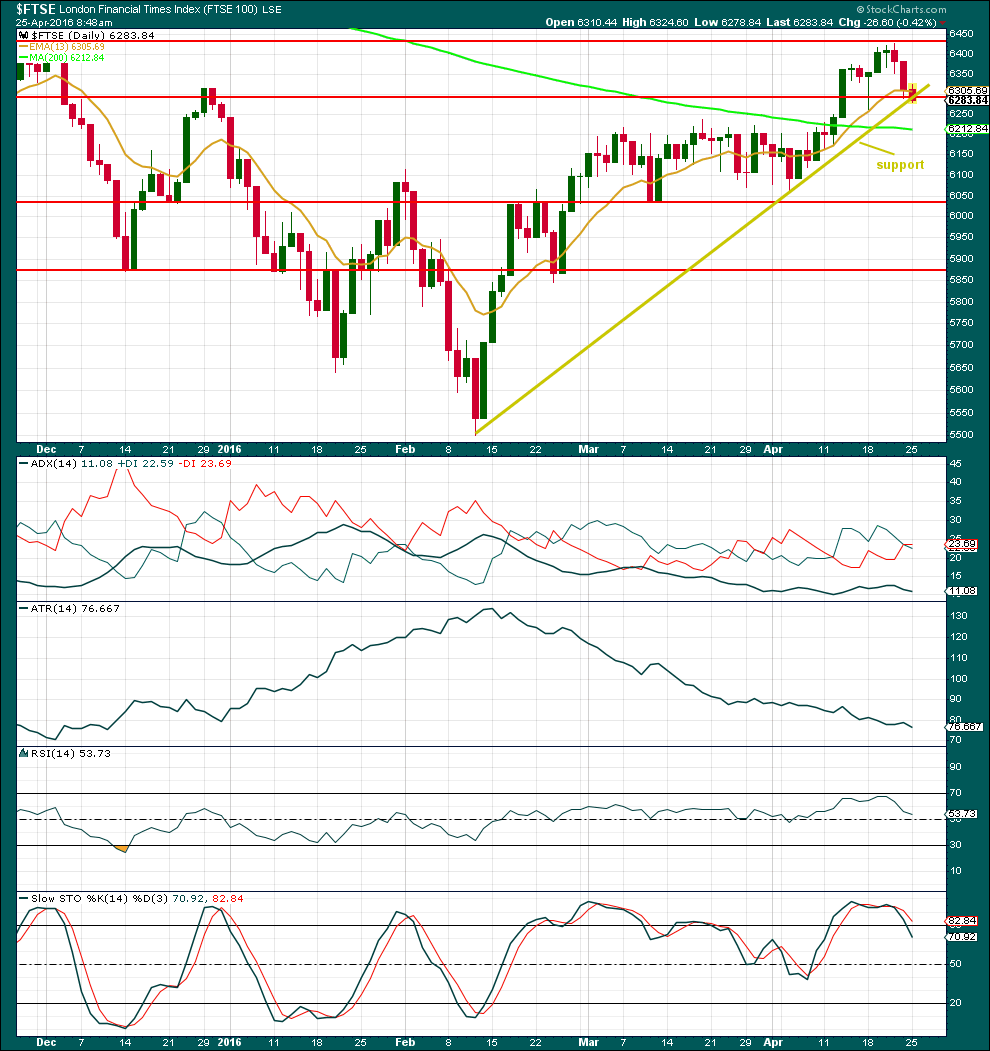
Neither Google / Yahoo data feed nor StockCharts provide volume data for FTSE. Comments on volume are taken from Yahoo Finance data.
Price comes on slightly declining volume as price rose higher for this bear market rally. Volume was not rising along with price, so the rise in price was not supported by volume and is unsustainable.
Price may be beginning to break below the support line for the rally. If that line is breached, it would indicate a trend change. This line is the same as the lower edge of the blue channel on the daily Elliott wave count.
There is an evening doji star at the high, but it is not perfect though as there is some overlap between the doji and the red candlestick. This is a reversal pattern.
ADX is declining indicating the market is not trending. The +DX and -DX lines are crossing over which is an early indication of a potential trend change. If ADX begins to increase and reaches over 15, it would signal a new downwards trend.
ATR declined during this rally. This is not normal for a trending market, so it indicates weakness.
RSI is neutral. There is room for price to rise or fall.
Stochastics is returning from overbought.
This analysis is published @ 04:18 a.m. EST.
0.38 retrace and the trend line seem to have held — trying a short, following your lead.. the set up is near ideal..
NAS100 is at least as good of a setup — your updated count would be very useful (just the chart/s fine).
Thanks!
Excellent.
That is my all time favourite low risk / high reward set up: breach of trend line, throwback.
You’ve got a good entry there. FTSE moving lower today should see your position nicely profitable already.
Here’s another idea: this is one of my risk management techniques. As soon as my position becomes reasonably profitable I move my stop to break even. That way if the market goes against me and if I’m wrong I don’t have a loss. Then I reanalyse and look for the next entry point.
Will update Nasdaq this weekend or later tonight.
No one wants to be first?
I’ve opened a very small short on FTSE.
Lets see how that goes.
Looks like FTSE closed below the trend line, now after hours is moving up to test the trend line.
Will it find resistance there? So far it looks like it may. A typical throwback?
My favourite entry opportunity! Stops can be set just above the trend line so quite close. If price doesn’t find resistance there and reenters the channel then something else may be going on… but if it finds resistance and moves lower it usually does so strongly.