
There are two hourly Elliott wave counts with very important differences. The alternate is entirely possible and outlines confirmation points and trend channels.
Summary: It is possible that a high is in place, but we should always assume the trend remains the same until proven otherwise. Assume the trend is up until there is confirmation that it is not. Assume price will move higher to end at least above 2,116.48 while it remains above 2,087.84. A new low below 2,039.74 would provide confidence that a strong third wave down is underway.
To see last published monthly charts click here.
To see how each of the bull and bear wave counts fit within a larger time frame see the Grand Supercycle Analysis.
To see detail of the bull market from 2009 to the all time high on weekly charts, click here.
New updates to this analysis are in bold.
BEAR ELLIOTT WAVE COUNT
WEEKLY CHART
Click chart to enlarge.
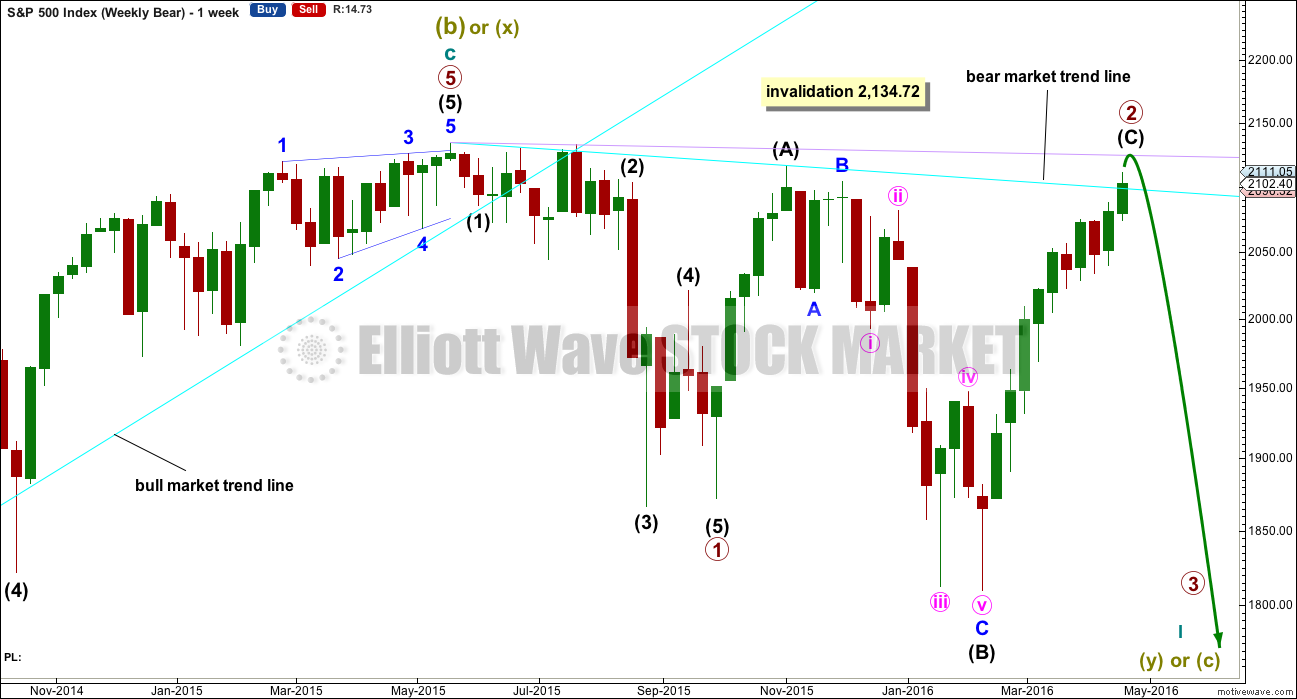
This bear wave count fits better than the bull with the even larger picture, super cycle analysis found here. It is also well supported by regular technical analysis at the monthly chart level.
Importantly, there is no lower invalidation point for this wave count. That means there is no lower limit to this bear market.
Primary wave 1 may be complete and may have lasted 19 weeks, two short of a Fibonacci 21. So far primary wave 2 is in its 28th week. It looks unlikely to continue for another 6 weeks to total a Fibonacci 34, so it may end either this week or possibly early next week. This would still give reasonable proportion between primary waves 1 and 2. Corrections (particularly more time consuming flat corrections) do have a tendency to be longer lasting than impulses.
Primary wave 2 may be unfolding as an expanded or running flat. Within primary wave 2, intermediate wave (A) was a deep zigzag (which will also subdivide as a double zigzag). Intermediate wave (B) fits perfectly as a zigzag and is a 1.21 length of intermediate wave (A). This is within the normal range for a B wave of a flat of 1 to 1.38.
Intermediate wave (C) is likely to make at least a slight new high above the end of intermediate wave (A) at 2,116.48 to avoid a truncation and a very rare running flat. However, price may find very strong resistance at the final bear market trend line. This line may hold price down and it may not be able to avoid a truncation. A rare running flat may occur before a very strong third wave down. That looks possible today. The whole structure is now complete down to the five minute chart level. The hourly alternate looks at this possibility that intermediate (C) is over today and truncated by 5.43 points. The truncation is small and acceptable.
If price moves above 2,116.48, then the new alternate bear wave count would be invalidated. At that stage, if there is no new alternate for the bear, then this would be the only bear wave count.
Primary wave 2 may not move beyond the start of primary wave 1 above 2,134.72.
DAILY CHART
Click chart to enlarge.
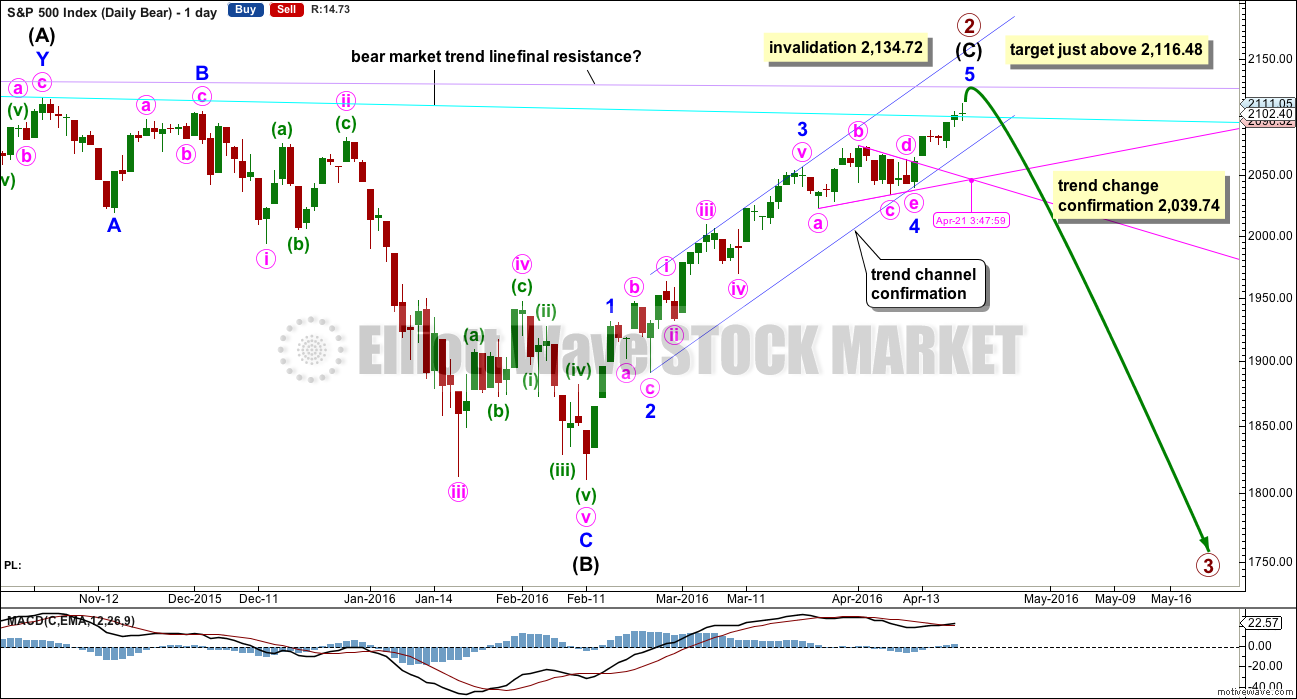
Intermediate wave (A) fits as a single or double zigzag.
Intermediate wave (B) fits perfectly as a zigzag. There is no Fibonacci ratio between minor waves A and C.
Intermediate wave (C) must subdivide as a five wave structure. It is unfolding as an impulse.
Intermediate wave (C) does not have to move above the end of intermediate wave (A) at 2,116.48, but it is likely to do so to avoid a truncation. If intermediate wave (C) is over at today’s high, then the truncation is small at only 5.43 points. This may occur right before a very strong third wave pulls the end of intermediate wave (C) downwards. However, it is unconfirmed today although this is possible. Confirmation is required.
The next wave down for this wave count would be a strong third wave at primary wave degree.
Minor wave 4 is a running contracting triangle. Extend the triangle trend lines out. The point in time at which they cross over sometimes sees a trend change; sometimes this is where the fifth wave to follow a fourth wave triangle ends. The point in time at which the triangle trend lines cross over is 21st April, tomorrow. This may be when primary wave 2 ends. This does not always work, but it works often enough to look out for it.
The target is for intermediate wave (C) to end just above the end of intermediate wave (A) at 2,116.48, so that a truncation is avoided.
Redraw the channel about the impulse of intermediate wave (C) using Elliott’s second technique: draw the first trend line from the ends of the second to fourth waves at minor degree, then place a parallel copy on the end of minor wave 3. Minor wave 5 may end midway within the channel. When this channel is breached by downwards movement, that will be the earliest indication of a possible end to primary wave 2.
Because expanded flats do not fit nicely within trend channels, a channel about their C waves may be used to indicate when the expanded flat is over. After a breach of the lower edge of the channel, if price then exhibits a typical throwback to the trend line, then it may offer a perfect opportunity to join primary wave 3 down. This does not always happen, so if it does in this case take the opportunity.
Within minor wave 5, no second wave correction may move beyond the start of its first wave below 2,039.74. A new low below 2,039.74 could not be a second wave correction within minor wave 5, so at that stage minor wave 5 would have to be over. This would confirm a trend change.
Price may find final resistance and end upwards movement when it comes to touch the lilac trend line.
HOURLY CHART
Click chart to enlarge.
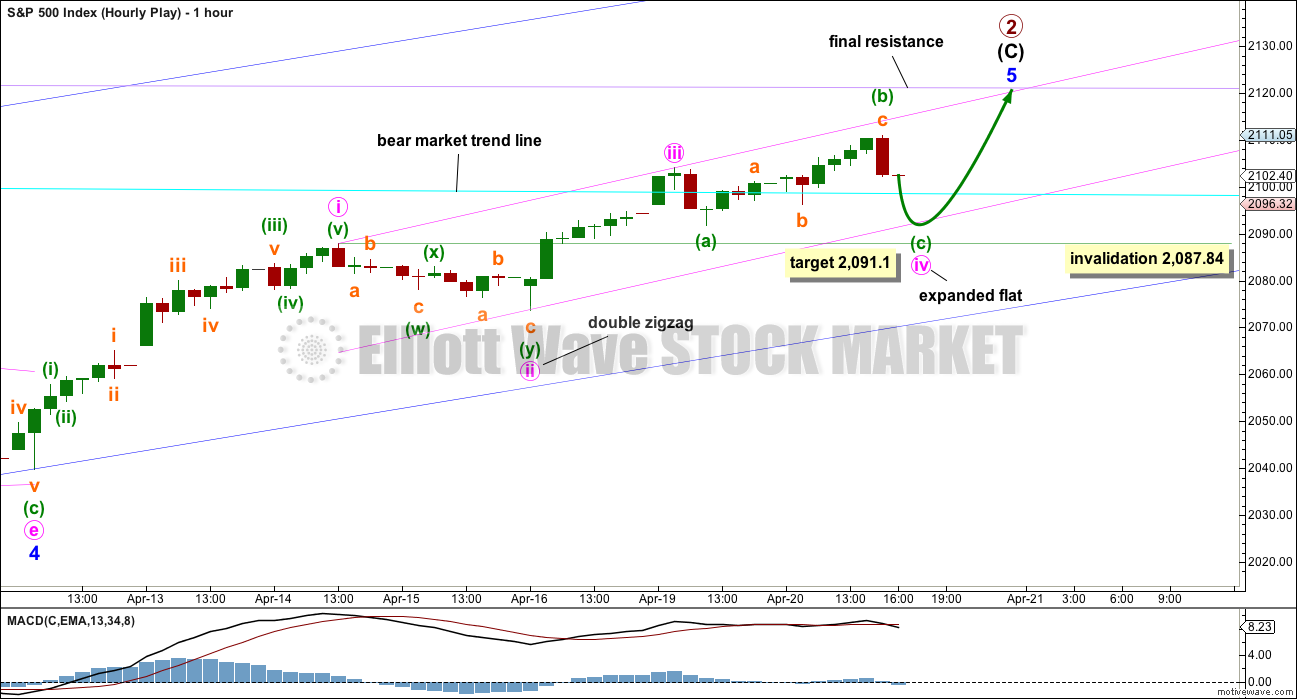
Minute wave iv may be an incomplete expanded flat. Within minute wave iv, minuette wave (b) would be a 1.57 length of minute wave a. This is longer than the normal range of 1 to 1.38, but less than the maximum convention of 2. (There is no Elliott wave rule for the maximum length of a B wave within a flat correction). I have seen plenty of expanded flats with B waves longer than 1.38 the length of the A wave, and a few with B waves longer than 2 times the length of the A wave.
At 2,091.10 minuette wave (c) would reach 1.618 the length of minuette wave (a). Minuette wave (c) would be extremely likely to end at least slightly below the end of minuette wave (a) at 2,091.67 to avoid a truncation and a very rare running flat. With all the weakness to this upwards movement, this is not the kind of situation where a running flat would show up.
When minute wave iv is complete, then minute wave v upwards would be required to complete the entire structure. It may end at the lilac trend line and would be likely to end at least slightly above 2,116.48, so that intermediate wave (C) avoids a truncation.
This could be complete tomorrow. It may continue for a further four sessions, limping slowly to an end, if primary wave 2 is to total a Fibonacci 144 sessions.
ALTERNATE HOURLY CHART

Click chart to enlarge.
The entire structure of primary wave 2 may now be complete. This alternate wave count expects a big trend change happened in the final hour of today’s session, so it absolutely requires some confirmation before any confidence may be had in it.
Ratios within intermediate wave (C) would be: minor wave 3 has no Fibonacci ratio to minor wave 1, and minor wave 5 (if it is over) would be 3.21 points short of 0.618 the length of minor wave 1.
Ratios within minor wave 5 would be: minute wave iii would be just 0.67 points longer than 0.618 the length of minute wave i, and minute wave v would be just 0.59 points longer than 0.618 the length of minute wave iii and just 1 point longer than 0.382 the length of minute wave i.
If the pink channel about minor wave 5 is breached by downwards movement, that would be first trend channel confirmation. But trend channel confirmation (particularly for small movements) by the S&P alone is not enough for confidence. The S&P has a tendency to form rounded tops, and in doing so it breaches channels yet continues in the prior direction to continue the trend. That could happen here.
A new low below 2,087.84 would invalidate the main hourly wave count and provide some price confidence in a potential trend change.
A clear and strong breach of the dark blue channel would provide further confidence in a trend change.
Finally, a new low below 2,039.74 would provide reasonable confidence in a trend change. The only question at that stage would be of what degree?
If primary wave 2 is over today, then the target for primary wave 3 would be 2.618 the length of primary wave 1 at 1,423. That is the appropriate Fibonacci ratio to use when the second wave correction is so very deep, and here primary wave 2 would be 0.91 the length of primary wave 1.
Primary wave 1 lasted 90 days (just one longer than a Fibonacci 89). Primary wave 2 may have lasted 140 days (four short of a Fibonacci 144). Primary wave 3 may be quick, but it still would have two sizeable corrections for intermediate waves (2) and (4) within it. An initial expectation may be for it to total a Fibonacci 144 or 233 days.
ALTERNATE WEEKLY CHART
Click chart to enlarge.
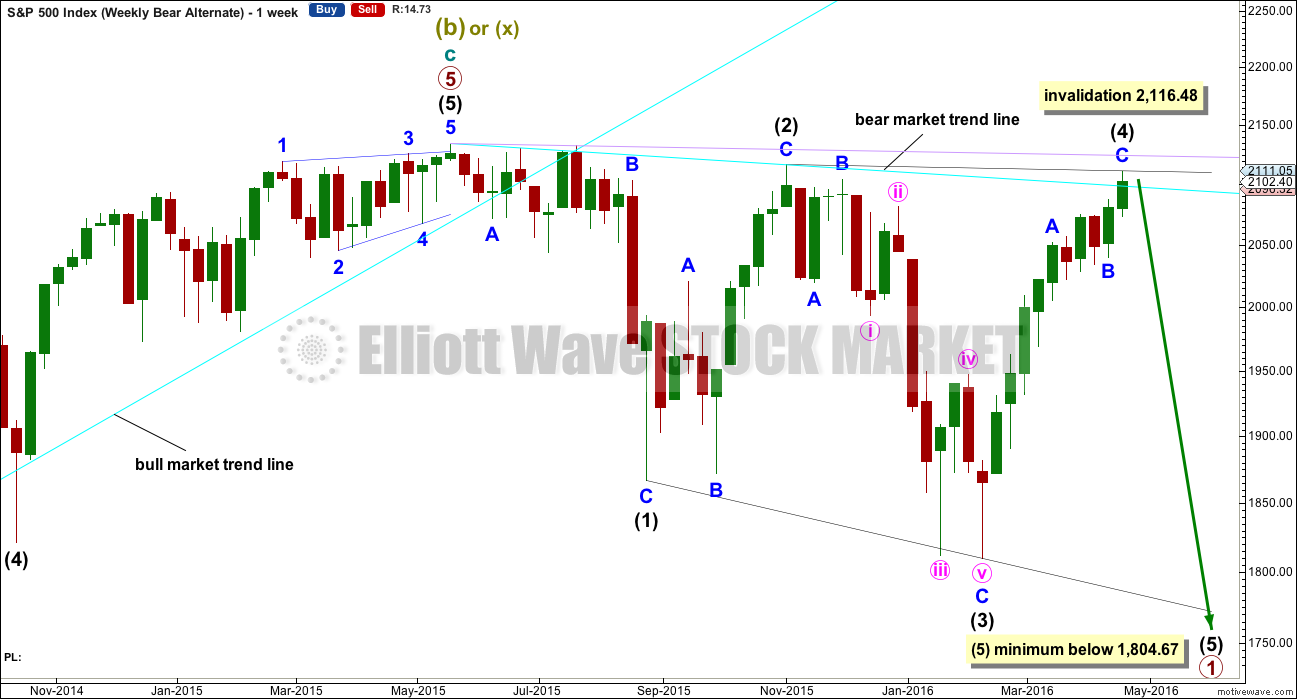
Primary wave 1 may subdivide as one of two possible structures. The main bear count sees it as a complete impulse. This alternate sees it as an incomplete leading diagonal.
The diagonal must be expanding because intermediate wave (3) is longer than intermediate wave (1). Leading expanding diagonals are not common structures, so that reduces the probability of this wave count to an alternate.
Intermediate wave (4) may continue higher now and may find resistance at the bear market trend line.
ALTERNATE DAILY CHART
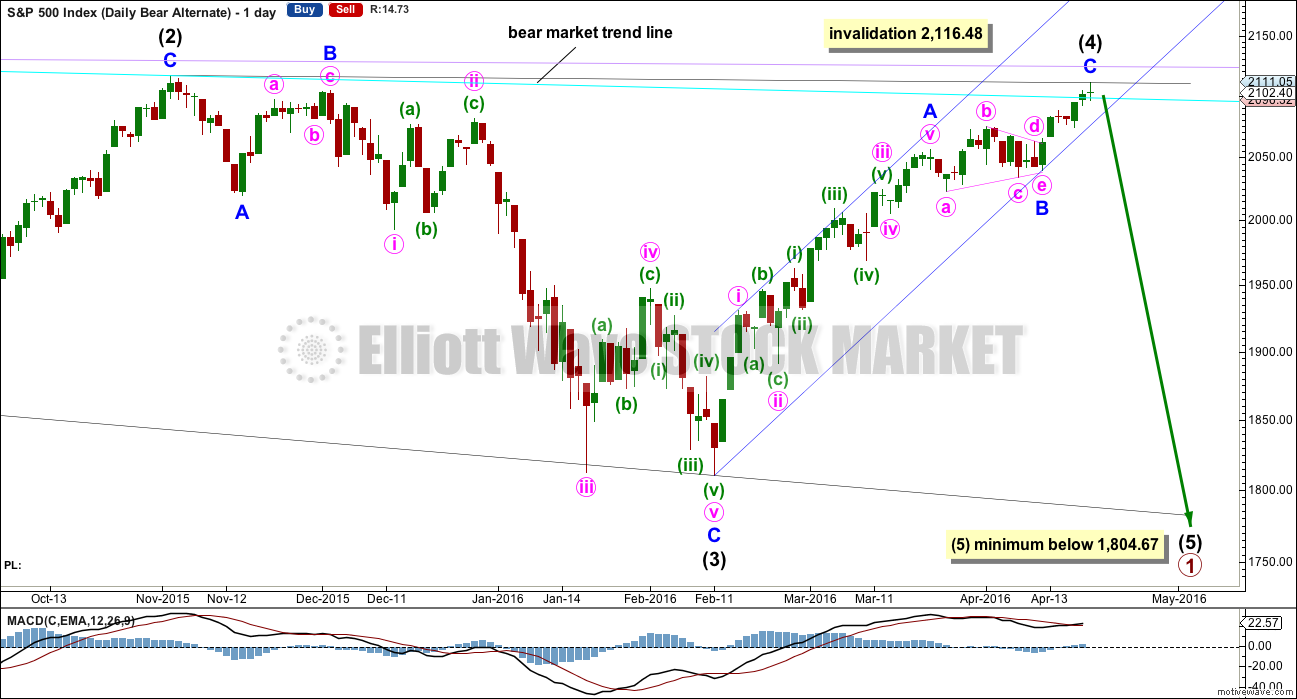
Click chart to enlarge.
Within a leading diagonal, subwaves 2 and 4 must subdivide as zigzags. Subwaves 1, 3 and 5 are most commonly zigzags but may also sometimes appear to be impulses.
Intermediate wave (3) down fits best as a zigzag.
In a diagonal the fourth wave must overlap first wave price territory. The rule for the end of a fourth wave is it may not move beyond the end of the second wave.
Expanding diagonals are not very common. Leading expanding diagonals are less common.
Intermediate wave (4) must be longer than intermediate wave (2), so it must end above 2,059.57. This minimum has been met. The trend lines diverge.
The triangle is seen as minor wave B. Intermediate wave (4) now has a clearer three wave look to it.
The structure of intermediate wave (4) may now be complete. Intermediate wave (5) must be longer than intermediate wave (3), so it must end below 1,804.67. Confirmation of the end of the upwards trend for intermediate wave (4) would still be required before confidence may be had in a trend change, in the same way as that for the main bear wave count.
BULL ELLIOTT WAVE COUNT
WEEKLY CHART
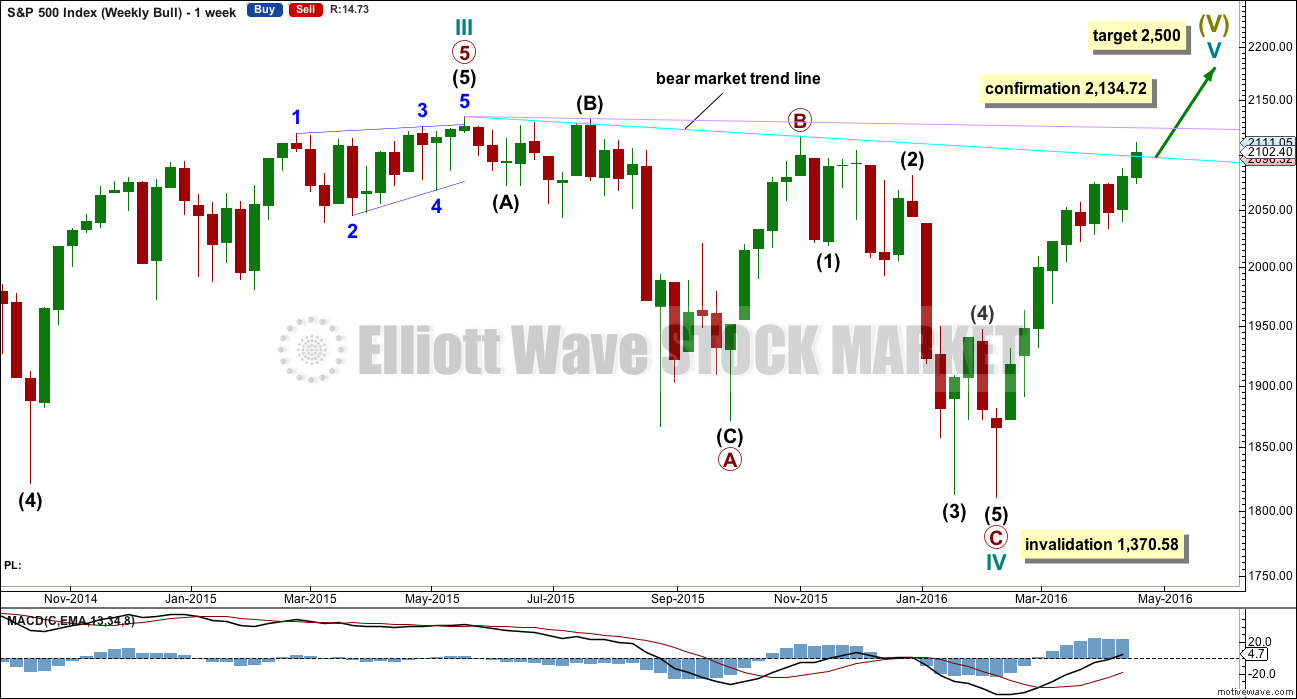
Click chart to enlarge.
Cycle wave II was a shallow 0.41 zigzag lasting three months. Cycle wave IV may be a complete shallow 0.19 regular flat correction, exhibiting some alternation with cycle wave II.
At 2,500 cycle wave V would reach equality in length with cycle wave I.
Price remains below the final bear market trend line. This line is drawn from the all time high at 2,134.72 to the swing high labelled primary wave B at 2,116.48 on November 2015. This line is drawn using the approach outlined by Magee in the classic “Technical Analysis of Stock Trends”. To use it correctly we should assume that a bear market remains intact until this line is breached by a close of 3% or more of market value. In practice, that price point would be a new all time high which would invalidate any bear wave count.
This wave count requires price confirmation with a new all time high above 2,134.72.
While price has not made a new high, while it remains below the final bear market trend line and while technical indicators point to weakness in upwards movement, this very bullish wave count comes with a strong caveat. I still do not have confidence in it.
DAILY CHART
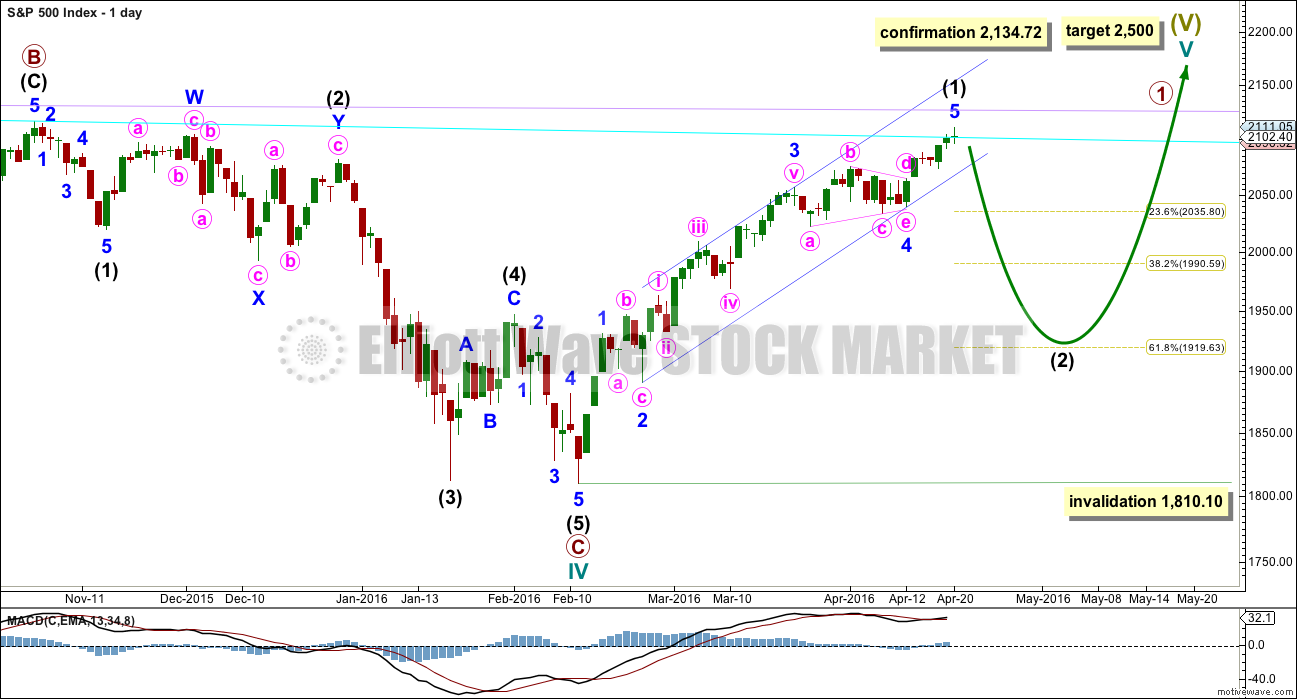
Click chart to enlarge.
Intermediate wave (2) is seen as an atypical double zigzag. It is atypical in that it moves sideways. Double zigzags should have a clear slope against the prior trend to have the right look. Within a double zigzag, the second zigzag exists to deepen the correction when the first zigzag does not move price deep enough. Not only does this second zigzag not deepen the correction, it fails to move at all beyond the end of the first zigzag. This structure technically meets rules, but it looks completely wrong. This gives the wave count a low probability.
If the bull market has resumed, it must begin with a five wave structure upwards at the daily and weekly chart level. That may today be complete. The possible trend change at intermediate degree still requires confirmation in the same way as the alternate hourly bear wave count outlines before any confidence may be had in it.
If intermediate wave (2) begins here, then a reasonable target for it to end would be the 0.618 Fibonacci ratio of intermediate wave (1) about 1,920. Intermediate wave (2) must subdivide as a corrective structure. It may not move beyond the start of intermediate wave (1) below 1,810.10.
In the long term, this wave count absolutely requires a new high above 2,134.72 for confirmation. This would be the only wave count in the unlikely event of a new all time high. All bear wave counts would be fully and finally invalidated.
TECHNICAL ANALYSIS
DAILY CHART
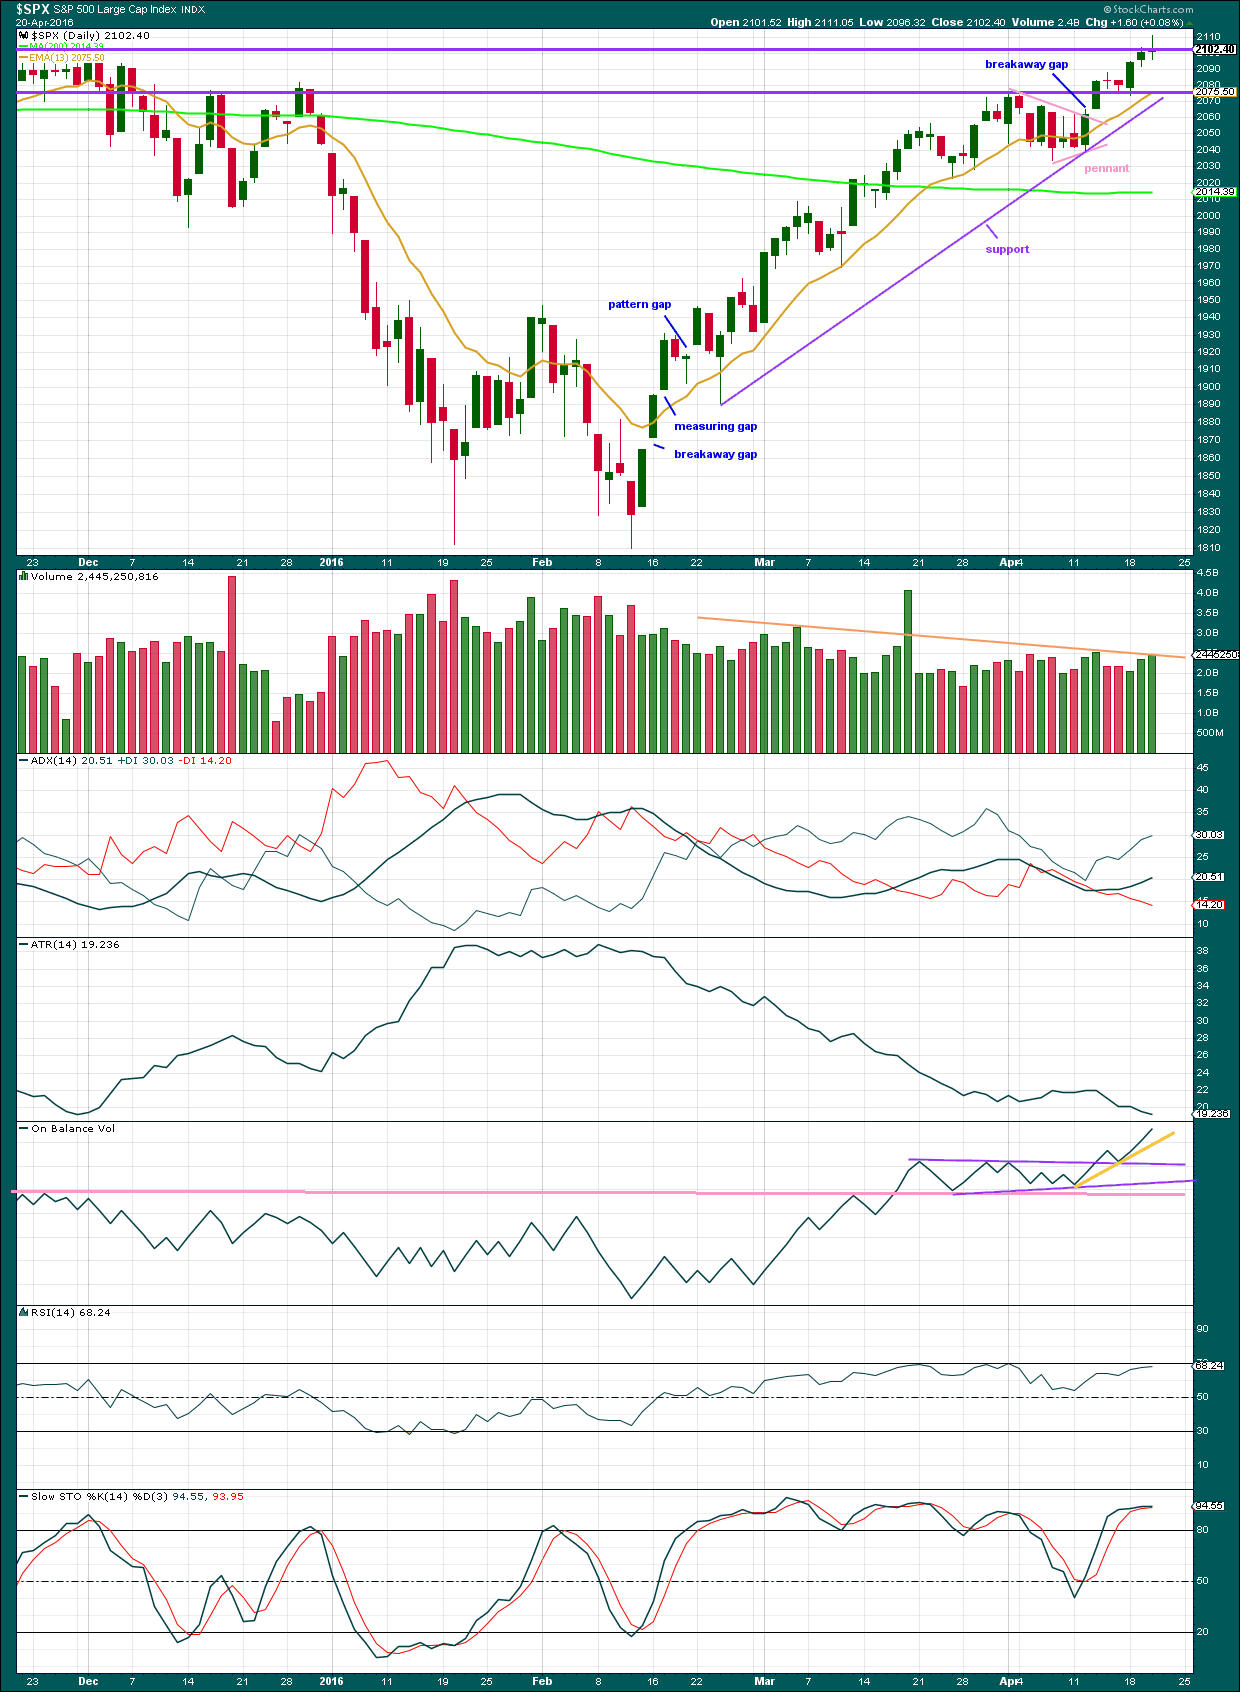
Click chart to enlarge. Chart courtesy of StockCharts.com.
Volume data on StockCharts is different to that given from NYSE, the home of this index. Comments on volume will be based on NYSE volume data when it differs from StockCharts.
Price has been trending upwards for 47 days. The 13 day moving average is mostly showing where downwards corrections are finding support. It looks like a small pennant pattern has completed and is followed by an upwards breakout with a gap and an increase in volume. The trend has resumed after a few days of consolidation. If a target for the movement to follow the breakout of the pennant pattern is used, based on the widest part of the pattern, then upwards movement would be expected to reach about 2,106. Today it has reached just under 5 points above this target calculation. A trend change or consolidation would be expected about here.
The gap has not been closed within a few days, so now it looks like a breakaway gap from the small pennant pattern.
Price found resistance and then support at the horizontal trend line about 2,080 and has bounced up from there. Price is finding some resistance about the sticky round number of 2,100. It has closed above this point for two days in a row, but only just. Wednesday’s small green doji indicates indecision, a balance of bulls and bears.
Price has moved higher on increasing volume for three days in a row. There is support for this rise in price from volume at least short term. However, overall, volume is overall declining as price has been rising for 47 days. This indicates weakness. The trend is not supported by volume, so it is unsustainable.
ADX is rising indicating the upwards trend has returned. ATR no longer supports ADX. ATR is declining.
ATR declined for most of this upwards trend. This is not normal for a trend and it indicates weakness.
On Balance Volume is giving a clear bullish signal, albeit a rather weak one. The clear break above the upper purple trend line supports the Elliott wave count short term in expecting more upwards movement. The signal is weak because the line is short held and only tested twice. However, it is close to horizontal, so it has some technical significance. OBV turned lower to test the upper purple line and has moved away, so the strength of that line is now reinforced.
OBV needs to break below the pink line for OBV to give a strong bearish signal, but before that happens breaks below the purple lines would provide weak bearish signals. A new very short term (and weak) yellow line is added today. A break below this line would be a weak bearish signal.
RSI has not managed to reach overbought during this trend. Price made a new high today within this current trend yet RSI has still not made a corresponding new high. There is now very slight divergence between price and RSI indicating weakness in price.
Stochastics also shows divergence with price. This also is indicating price is weak.
The purple support line is drawn using the approach outlined by Magee in the classic “Technical Analysis of Stock Trends”. Trend lines are simple and one of the more powerful technical analysis methods. When this purple line is breached by downwards movement (I define a breach as a full daily candlestick below and not touching the line), then it would indicate an end to this upwards trend and a new downwards trend. This line is drawn in the same way as the lower edge of the blue Elliott channel on the bear wave counts.
INVERTED VIX DAILY CHART
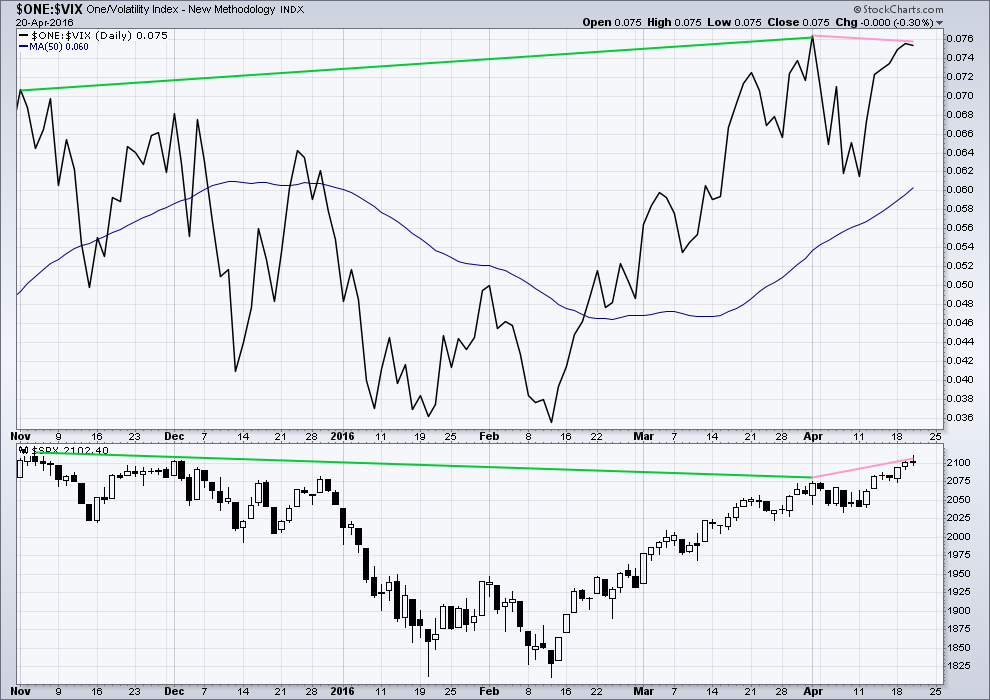
Click chart to enlarge. Chart courtesy of StockCharts.com.
Volatility declines as inverted VIX climbs. This is normal for an upwards trend.
What is not normal here is the divergence over a reasonable time period between price and inverted VIX (green lines). The decline in volatility is not translating to a corresponding increase in price. Price is weak. This divergence is bearish.
Price made a new short term high, but VIX has failed to make a corresponding high (pink lines). This is regular bearish divergence. It indicates further weakness in the trend.
Price today again made a new high and printed a green daily candlestick. Yet inverted VIX has declined and did not move up for the session. There is now a third short term divergence between price and VIX today.
BULLISH PERCENT DAILY CHART

Click chart to enlarge. Chart courtesy of StockCharts.com.
With this indicator measuring the percentage of bullish equities within the index, it is a measurement of breadth and not sentiment as the name suggests.
There is strong hidden bearish divergence between price and the Bullish Percent Index (orange lines). The increase in the percentage of bullish equities is more substantial than the last high in price. As bullish percent increases, it is not translating to a corresponding rise in price. Price is weak.
As price made a new short term high today, BP did not (pink lines). This is regular bearish divergence. It indicates underlying weakness to the upwards trend.
ADVANCE DECLINE LINE
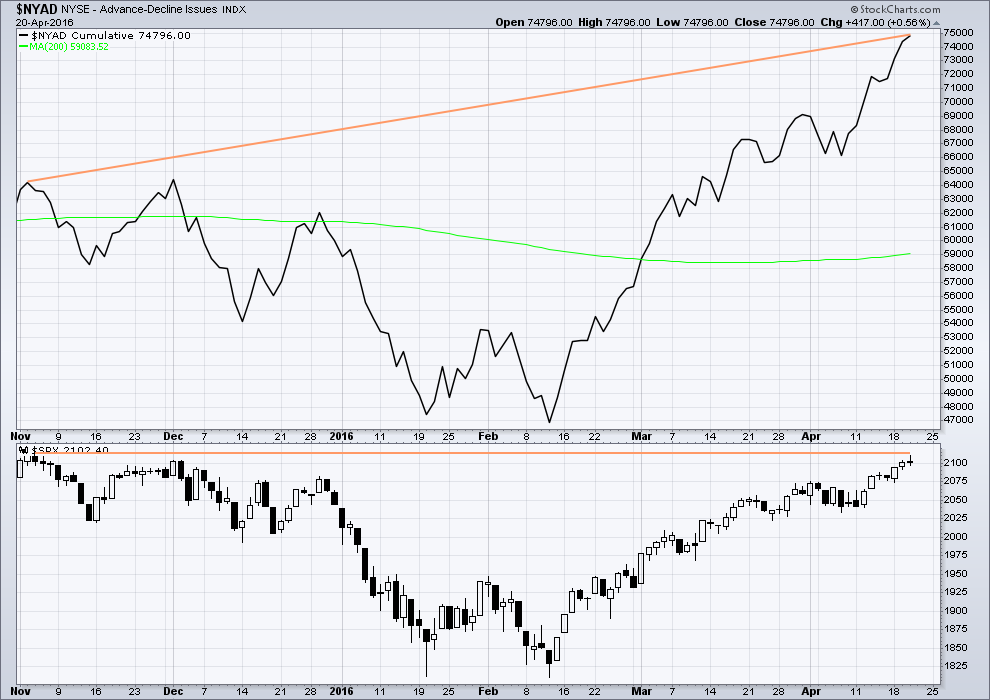
Click chart to enlarge. Chart courtesy of StockCharts.com.
With the AD line increasing, this indicates the number of advancing stocks exceeds the number of declining stocks. This indicates that there is breadth to this upwards movement.
From November 2015 to now, the AD line is making new highs while price has so far failed to make a corresponding new high. This indicates weakness in price; the increase in market breadth is unable to be translated to increase in price.
It remains to be seen if price can make new highs beyond the prior highs of 3rd November, 2015. If price can manage to do that, then this hidden bearish divergence will no longer be correct, but the fact that it is so strong at this stage is significant. The AD line will be watched daily to see if this bearish divergence continues or disappears.
The 200 day moving average for the AD line is now increasing. This alone is not enough to indicate a new bull market. During November 2015 the 200 day MA for the AD line turned upwards and yet price still made subsequent new lows.
COMMITMENT OF TRADERS (COT)
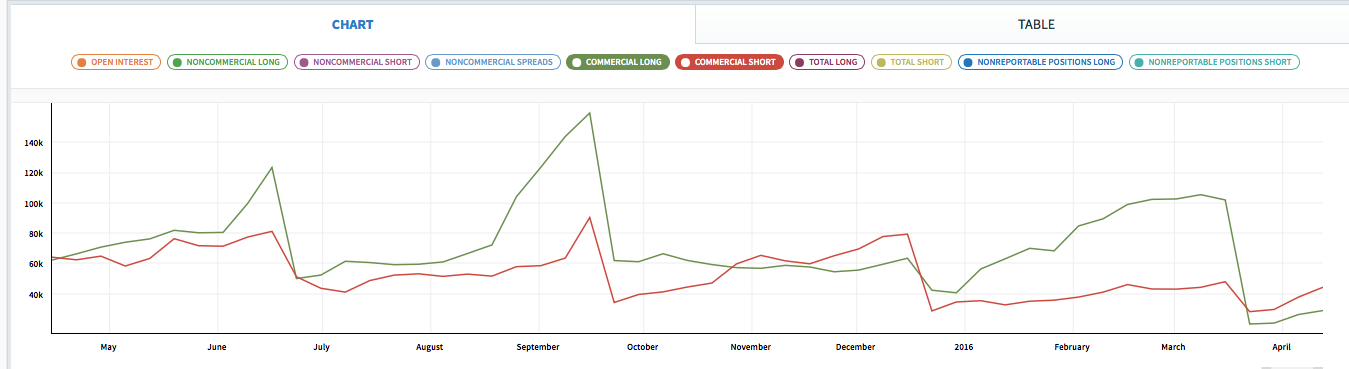
Click chart to enlarge. Chart courtesy of Qandl.
This first COT chart shows commercials. Commercial traders are more often on the right side of the market. Currently, more commercials are short the S&P than long. This supports a bearish Elliott wave count, but it may also support the bullish Elliott wave count which would be expecting a big second wave correction to come soon. Either way points to a likely end to this upwards trend sooner rather than later. Unfortunately, it does not tell exactly when upwards movement must end.
*Note: these COT figures are for futures only markets. This is not the same as the cash market I am analysing, but it is closely related enough to be highly relevant.
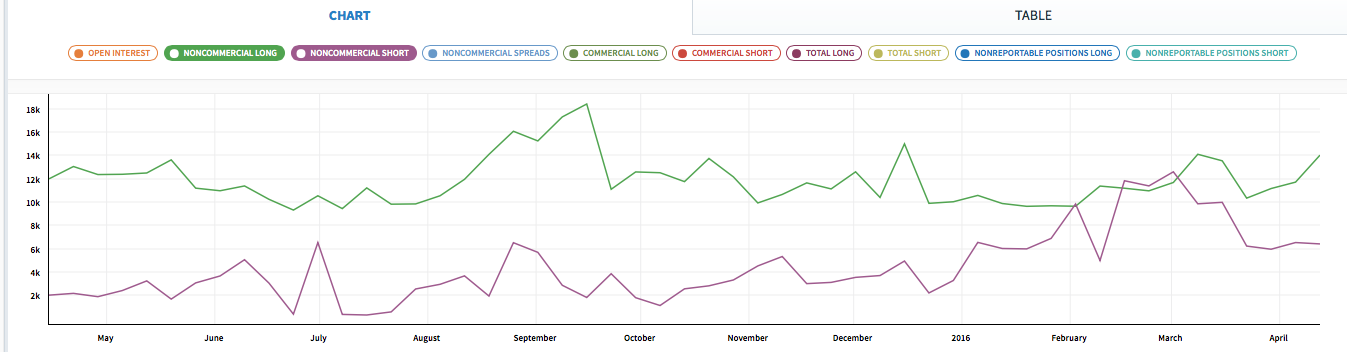
Click chart to enlarge. Chart courtesy of Qandl.
Non commercials are more often on the wrong side of the market than the right side of the market. Currently, non commercials are predominantly long, and increasing. This supports the expectation of a trend change soon.
DOW THEORY
I am choosing to use the S&P500, Dow Industrials, Dow Transportation, Nasdaq and the Russell 2000 index. Major swing lows are noted below. So far the Industrials, Transportation and Russell 2000 have made new major swing lows. None of these indices have made new highs.
I am aware that this approach is extremely conservative. Original Dow Theory has already confirmed a major trend change as both the industrials and transportation indexes have made new major lows.
At this stage, if the S&P500 and Nasdaq also make new major swing lows, then my modified Dow Theory would confirm a major new bear market. At that stage, my only wave count would be the bear wave count.
The lows below are from October 2014. These lows were the last secondary correction within the primary trend which was the bull market from 2009.
These lows must be breached by a daily close below each point.
S&P500: 1,821.61
Nasdaq: 4,117.84
DJIA: 15,855.12 – close below on 25th August 2015.
DJT: 7,700.49 – close below on 24th August 2015.
Russell 2000: 1,343.51 – close below on 25th August 2015.
To the upside, DJIA has made a new major swing high above its prior major high of 3rd November, 2015, at 17,977.85. But DJT has so far failed to confirm because it has not yet made a new major swing high above its prior swing high of 20th November, 2015, at 8,358.20. Dow Theory has therefore not yet confirmed a new bull market.
This analysis is published @ 01:04 a.m. EST on 21st April, 2016.
Its so early in the night, but as unlikely as it seems, the futures are slightly green at the moment… I really did think they would be modestly in the red with SBUX, MSFT, and GOOG all down big after hours. So maybe we’ll have the last leg up and another good shorting opportunity after all…
Ari
It is very surprising as this clearly shows the hidden hand manipulating the market. Unreal but still a lot of trading left before market open,
The 4:00PM futures close was 2085.50 and right now is 2084.00 so it’s slightly lower.
What you see as green is from the 5:10PM Futures Close. Futures reset to zero when it reopend at 6:00PM
Futures were as low as 2077.75… after Google & Msft earning came out.
They will fade again after Europe opens at 3:00AM.
Guess what, folks–all the FANG stocks except for Netflix are sharply lower in after hours trading, apparently on the heels of a disappointment in GOOG earnings. These are the stocks that have led the advance. Could this be the first gust before the hurricane?
Thomas,
Banksters are going to try to control the open to put a show that no matter how bad the earnings were, market doesn’t care or not feeling down. This will breakdown in a hurry as big gains over the last two months get booked before they become loss.
I see they are already trying to buy futures but waiting for tomorrow morning.
And as soon as I leave to get some sleep, it all happens.
The invalidation point needs to be passed during NY hours. Its the cash market I’m analysing here, not futures. After hours only impacts if it creates a gap on the open. Yesterday after hours moved lower, then higher, to open pretty close to the close.
That could happen again.
Meanwhile, I’m stopped out for a reasonable profit. I’ll take that and now wait for a short entry.
The expanded flat for minute iv still looks okay. The C wave will subdivide as a five on the five minute chart even though it doesn’t look perfect on the hourly. That’s okay. The S&P just doesn’t always have perfect looking fives and threes at all time frames, including daily.
little bears must get their proper hibernation
And that is why I waited to read the analysis before taking any more positions. Tomorrow presents another opportunity. I can smell the top. It is like ‘napalm in the morning’ as we will see a crash and burn. If this is a primary third down, it will be time to fasten the seat belts because it is not going to be pretty.
And it means I’m going to have to be up again tonight if I want to get a good entry point.
Not sure how much more of that I can manage…. as Doc says, little bears gotta hibernate
Not necessarily. It means you have to be up if you want to get the best entry point. From my perspective any entry point this week will be a good entry point. Nevertheless, I understand your sentiment.
I don’t like to enter prior to confirmation.
I’m very risk averse. I want to see that blue trend line breached before I try to enter short. And I don’t want to get up tomorrow and see the line breached, followed by a quick throwback and strong movement away from it.
That would be just typical.
SPX trading at 2085 after hours (using SPY/SPX) ratio……
SBUX also down 5% after hours along with MSFT and GOOG mentioned in previous posts. For now, SQQQ up 3% after hours, and so is UVXY…
Looks like a negative day tomorrow, unless futures change tonight…
Action around the pivots indecisive and injurious to the immediate bearish case. I now expect one more wave up before the real plunge commences. ‘Nite all!
I dont know Verne,, looks like tomorrow could gap down a bunch, of course that could change.
Large cap bull market leaders taking it on the chin – can’t see this market not selling off Friday.
I know. The banksters could still step in do a big cash dump for one more manic run higher. I wanted to see the pivots really demolished to day for a wave down at this degree so was a bit surprised by the pussy footing around. We may get a slow start to this juggernaut. If we stay down triple digits overnight I guess we could get a gap and go on volatility tomorrow, but I am still a bit cautious about the near term…keeping a teensy bit dry powder for now…
If it starts out slowly it may be a gift!
To have a nice entry point with the luxury of time
I have still not taken any more positions. the fact that 2087 did not fall is supportive to the idea of one more high. In any event, I have enough wagons loaded, enough skin in the game. I am waiting for some more confirmation / confidence points. I keep reminding myself, I am not trying to pick the top. If it breaks down, I am going to have a very good day!. If it moves up and my trading vehicle offers some good pricing, then I will fill some more positions. Right now, I feel like I am sitting pretty so to speak even though I prefer not to be called pretty!
surely , you dont want to be called pretty.. and not Shirley either
Oh you did it again doc. The original Airplane is a classic.
Is the top in? I can’t tell…
“You can tell me…. I’m a Doctor” 🙂 🙂
Google misses in earnings and revenue
Paid clicks misses and cost per clicks misses.
And that was after estimates were cut big.
Down $59
MSFT Misses on earnings and in line on revenue.
Down $3
Thanks Joseph!
Let’s see how Nasdaq futures react to this into the open tomorrow.
/NQ is down $40 since 3:59.99PM
It will be interesting tomorrow with these types of earnings….
Google has a fantastic trend line, I have named it “Google’s Forever Trendline”.
When Google breaks below that line it’s all down.
Starbucks, Microsoft, Google all well loved market leaders – the question is – will the bulls step in and buy the dip? (which has been the mode of accumulation for these stocks)
Exactly. If price comes to touch that line many will buy at that point.
If the bear Elliott wave count is correct price should break below that line.
If that happens it is a huge bearish signal for Google.
My wondering is maybe this could happen before the S&P makes new lows and invalidates its bull count. If that happens then Google may be a canary in the goldmine.
I watch this line daily.
Technically it’s the most awesome trend line I’ve ever seen (and yeah, that’s a technical term) 🙂
Google ,MSFT earnings could supply some juice
These stocks are being pumped ahead of the earnings and it will be interesting to see how it goes down.
Orderly decline in a pretty tight channel… interestingly the Qs are flat for the day.
Could strong earnings possibly result in a gap up opening?
I was hoping for a pop to load some positions, not much EOD melt up.
Bulls are looking exhausted.
as they should be!
google down 50
The bears will fire their next salvo when the bulls attempt a run back at the pivots; we will know the bears are serious if they knock the attempt down by another ten points…this is the way impulsive declines begin…they pound the bulls in submission…
I take that back- looking more impulsive by the minute
The move downward away from the pivot should accelerate…the banksters are going to fight it, the outcome of that brawl will be very instructive…
This does not look like the continuation / completion of a minute iv wave. I am proceeding under the premise that wave v of 5 of c of 2 Primary is completed and it is only a matter of time before 2087 is taken out. Right on que, SPX is dropping away from the upper Bollinger Band.
Of course, we will have to wait for Lara’s thoughts to have an expert viewpoint.
Bye Bye … 2091.10
Doesn’t look impulsive
O.K. This is the fight that really matters – the battle around the round number pivots. For reasons both tactical and psychological, the banksters need to hold it if we are going to see another wave up. If we fall away from it precipitously, which we should at the advent of a primary wave down, I think it will be strong evidence of a major trend reversal; if not, we should expect another move up…
Dang it. I knew I should have loaded 2 wagons yesterday.
You might still have a shot. No evidence of big trend change just yet. UVXY not making new highs as we hit new lows on SPX. Looks like it’s still being shorted. First confirmation below 1987 SPX…
Watchful waiting…
They won’t stop shorting or start covering for some time. Remember, very few folk are expecting a huge decline to begin, all the propaganda about short positions notwithstanding…
We hit (so far) 9 cents from Lara’s target at 2091.10. I took some next week SPY 211 calls at .65
i’ll be out if we go below 2087.84
And I thought I was a gunslinger…. 🙂 🙂 🙂
Again, I am no EC counter of credit, but I see the following five waves down
Starting at 2111 wave one completes at 2107
wave 3 completes at 2095
wave 4 completes at 2103
and wave five is underway and has just now broken wave 3’s low.
This could be the start of something bigger or the completion of wave iv minute as a zig-zag not a triangle.
Just one view.
UVXY heading North fairly decisively. Ordinarily on a pop from a corrective wave the gap is filled quickly. Shares already up 5% today.
I want to see how we close today, especially with regard to the round numbers….
If the worm has indeed turned, I am thinking it needs to start moving downward decisively. Otherwise, I think we have one more move up. The longer it takes to resolve, the higher the probability of an upward resolution.
Rodney & Vern,
Major battle happening to hold the 2096 level, once that is taken out with some volume, 2087 will go quickly. The bulls are trying to keep the hopes by protecting 2096 level for now.
2096 gone. 2091 is the next obstacle to 2087. Lets see how it goes.
sell sell sell
I think wave 5 completes at 2095 due to proportions. The advance to 2103 is then a wave 2.
Nice chart, Thomas. Now with the SPX at 2092 we might have a couple of 1-2 sets of waves. At some point a 3rd would have to show increased momentum and power. Still waiting but the paint seems to be drying faster.
There it goes, 2091.67 taken out!
Yup! I count 1-2 at 4 degrees. 🙂
One last chart from me FWIW
Goodnight all.
Very pleasant dreams! We’ll keep an eye on the action… 🙂
just invalidated
It doesn’t look like anything particularly exciting is going to happen this session.
If the triangle is correct then minuette (d) upwards is unfolding. It looks like a double zigzag.
Then minuette (e) down cannot move below (c) at 2,095.42 for the triangle to remain valid.
When it’s done a final thrust upwards to reach above 2,116.48 would be the expectation. And that may happen at the end of this session, or maybe next session or even the one after.
Minor 5 doesn’t have to end at the point in time at which the triangle trend lines cross over. That trick doesn’t always work.
Primary 2 is now in day 141. One to three more sessions may see it very close to a Fibonacci 144. That would be very satisfying analytically.
I’m back to sleep now. It looks like the end may not be today folks.
Happy trading all!
Well it looks like minuette (c) isn’t unfolding down as an impulse as expected.
Minute iv could be another triangle?
Yep! It would be perfect. A final thrust out of it completing the rally. The reversal should be swift.
And maybe short too.
If this idea is right then this session will be very dull. Watching price move sideways.
This is what I have so far on the 5 minute chart for minute iv.
Down to at least 2,091.67 then up is the expectation.
And it would be nice if it does the down bit quickly, then turns soon. I’d rather like to be able to close my buy happily and then go back to sleep.
Thanks for the update Lara, and also for staying up…
If we blow thru 2087.84 you gonna stay up?
Probably. I’d be looking for a short entry point. So I’d be watching the blue channel.
I have been noticing declining volume on QQQ ever since this ramp started. One would think that with ramping markets, liquid stock like QQQ will be chased by the investors but that is not the case. So as and when the drop starts in ernest, the move will be much more pronounced.
Morning all!
I think minuette c of minute four is continuing. One more wave up, and another UVXY grabbing window….(for those who inquired)
Gentlemen and ladies…start your engines! 🙂
And they’re off!
UVXY will likely fill gap open from yesterday’s close at 15.76….
Good Morning!
This forum is so quiet, just like the futures…
And here’s hoping we’re about to see the end of paint drying. It has been rather dull. But still, dull can make for relatively easy profits.
Yes the paint is about the get wet, and start looking abstract as well… 🙂
I have started to read EW Principle by Frost & Prechter again. I 1st read it in 1980-81 but never applied it. Just followed the publications when I could get access.
Reading it now… I see that I know a fair amount of it from the services I subscribed to over the years including this service (where I learned the most).
But the book is filling in the things I didn’t remember or didn’t understand.
Lara, Can you suggest an additional book or two that I could learn from? I think I will finish reading this book in about a week.
Thanks
Good Morning All,
I hear in the news that there was a plunge in the futures that got bought early morning to bring the futures back into GREEN. Does anyone know what caused that plunge?
The SPX futures range was 2,094.75 – 2,104.00. That’s not much of a swing either way…
That is a small range for the futures vs last several months.
I would call it a tight range for the overnight.
Ris, I think it must have been Lara purchasing her initial short futures positions!
Good day all. It looks like Olga’s possible b wave to 2111 has a great deal of merit.
Rodney,
Just wanted to say I read your post from last night 3 times. Thanks for the thoughtful words…
You are most welcome. It makes me feel good and shows my efforts are worthwhile if someone finds my thoughts helpful.
Crikey. I don’t think any of my purchases would make a dent in this market 🙂
And I’m holding onto a small buy. Waiting to exit today or tomorrow, unless my target is met. Stop just below 2,087.84
Now Lara, you continue to hold your small (as you define it) long position to demonstrate your skill. Great job. But please don’t pull a ‘Rodney’ by holding out for the last penny only to give away some dimes!
BTW, you must tell me what ‘Crikey’ means.
Also I must mention, I saw that you used all caps yesterday saying, this ‘MIGHT’ be the top. Hmmmm!
Good Morning, good evening from Israel to New Zealand, all others are sleeping now …
Good evening 🙂
1st?? No Way