
Overall upwards movement was expected for Monday’s session from the main Elliott wave count. This is what happened.
Summary: This is still a bear market rally until proven otherwise. A final fifth wave up is underway with a target just above 2,116.48. It may end this Thursday. The upwards trend is very weak.
To see last published monthly charts click here.
To see how each of the bull and bear wave counts fit within a larger time frame see the Grand Supercycle Analysis.
To see detail of the bull market from 2009 to the all time high on weekly charts, click here.
New updates to this analysis are in bold.
BEAR ELLIOTT WAVE COUNT
WEEKLY CHART
Click chart to enlarge.
This bear wave count fits better than the bull with the even larger picture, super cycle analysis found here. It is also well supported by regular technical analysis at the monthly chart level.
Importantly, there is no lower invalidation point for this wave count. That means there is no lower limit to this bear market.
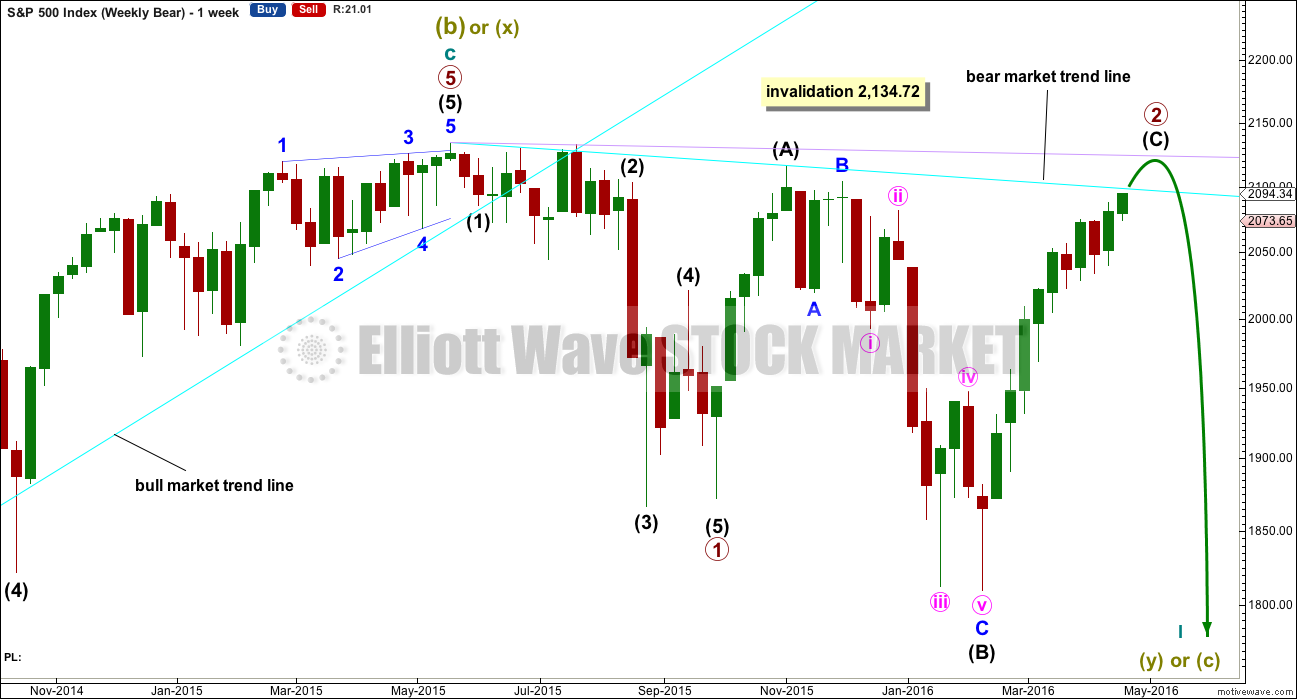
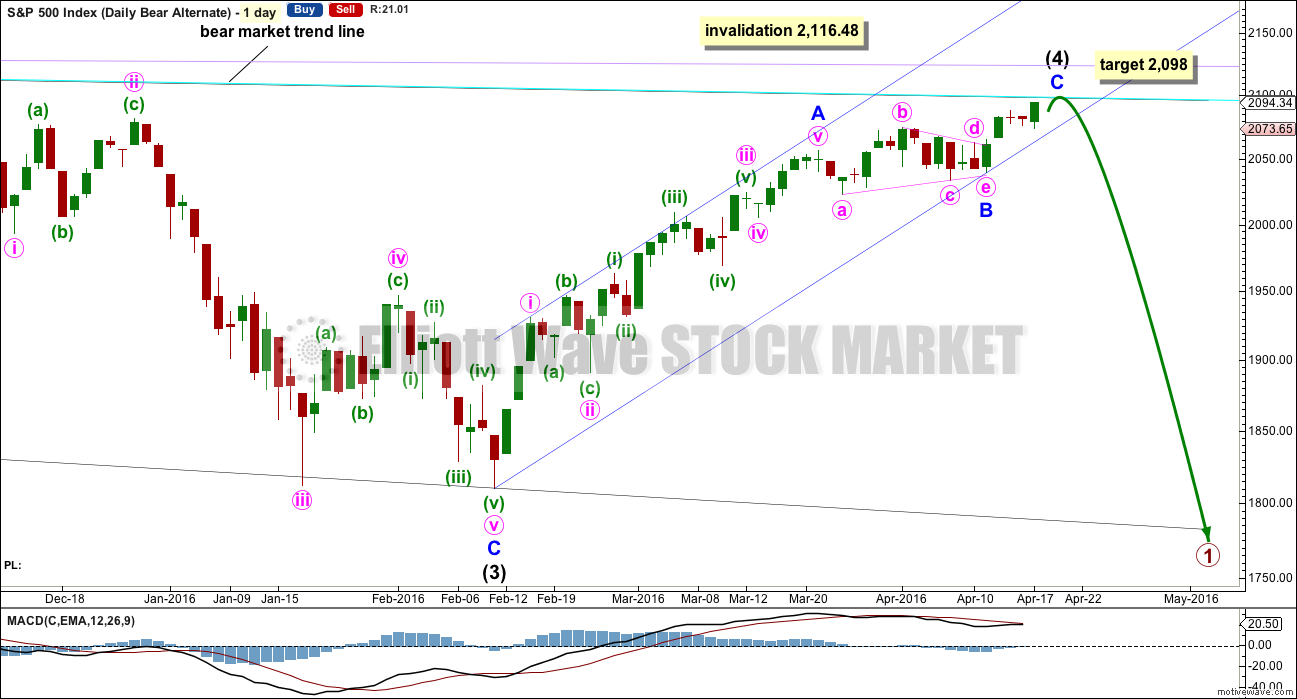
Primary wave 1 may be complete and may have lasted 19 weeks, two short of a Fibonacci 21. So far primary wave 2 has begun its 28th week. It looks unlikely to continue for another 6 weeks to total a Fibonacci 34, so it may end either this week or possibly early next week. This would still give reasonable proportion between primary waves 1 and 2. Corrections (particularly more time consuming flat corrections) do have a tendency to be longer lasting than impulses.
Primary wave 2 may be unfolding as an expanded or running flat. Within primary wave 2, intermediate wave (A) was a deep zigzag (which will also subdivide as a double zigzag). Intermediate wave (B) fits perfectly as a zigzag and is a 1.21 length of intermediate wave (A). This is within the normal range for a B wave of a flat of 1 to 1.38.
Intermediate wave (C) is likely to make at least a slight new high above the end of intermediate wave (A) at 2,116.48 to avoid a truncation and a very rare running flat. However, price may find very strong resistance at the final bear market trend line. This line may hold price down and it may not be able to avoid a truncation. A rare running flat may occur before a very strong third wave down.
If price moves above 2,116.48, then the new alternate bear wave count would be invalidated. At that stage, if there is no new alternate for the bear, then this would be the only bear wave count.
Primary wave 2 may not move beyond the start of primary wave 1 above 2,134.72.
DAILY CHART
Click chart to enlarge.
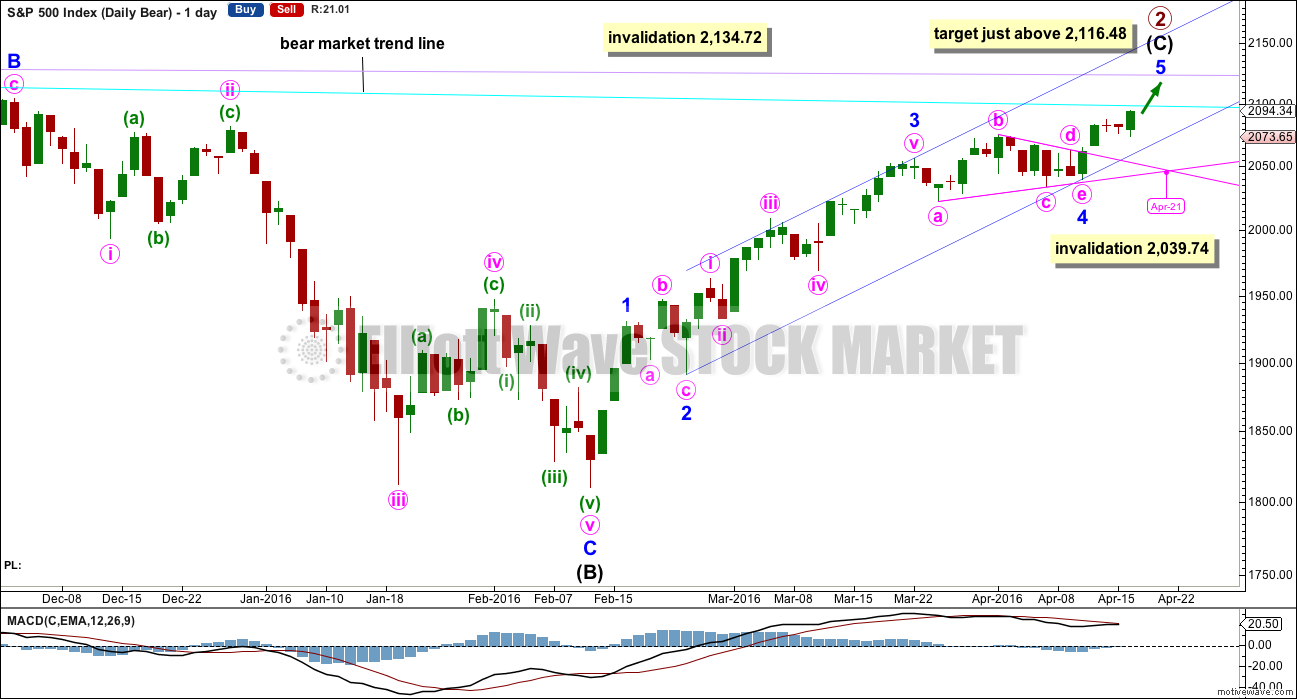
Intermediate wave (A) fits as a single or double zigzag.
Intermediate wave (B) fits perfectly as a zigzag. There is no Fibonacci ratio between minor waves A and C.
Intermediate wave (C) must subdivide as a five wave structure. It is unfolding as an impulse.
Intermediate wave (C) does not have to move above the end of intermediate wave (A) at 2,116.48, but it is likely to do so to avoid a truncation. If it is truncated and primary wave 2 is a rare running flat, then the truncation is not likely to be very large. As soon as price is very close to 2,116.48 this wave count looks at the possibility of a trend change.
The next wave down for this wave count would be a strong third wave at primary wave degree.
Minor wave 4 is a running contracting triangle. Extend the triangle trend lines out. The point in time at which they cross over sometimes sees a trend change; sometimes this is where the fifth wave to follow a fourth wave triangle ends. After the two days of this last weekend are now ignored, the point in time at which the triangle trend lines cross over is now 21st April, this Thursday. This may be when primary wave 2 ends. This does not always work, but it works often enough to look out for it.
The target is for intermediate wave (C) to end just above the end of intermediate wave (A) at 2,116.48, so that a truncation is avoided.
Redraw the channel about the impulse of intermediate wave (C) using Elliott’s second technique: draw the first trend line from the ends of the second to fourth waves at minor degree, then place a parallel copy on the end of minor wave 3. Minor wave 5 may end midway within the channel. When this channel is breached by downwards movement, that will be the earliest indication of a possible end to primary wave 2.
Because expanded flats do not fit nicely within trend channels, a channel about their C waves may be used to indicate when the expanded flat is over. After a breach of the lower edge of the channel, if price then exhibits a typical throwback to the trend line, then it may offer a perfect opportunity to join primary wave 3 down. This does not always happen, so if it does in this case take the opportunity.
Within minor wave 5 no second wave correction may move beyond the start of its first wave below 2,039.74.
So far the structure of minor wave 5 does not look like a completed five. More upwards movement is expected until it looks more typical on the hourly or daily chart. Along the way up, price may find some strong resistance at the cyan bear market trend line. This may be where another small doji or red candlestick unfolds for a small fourth wave correction.
HOURLY CHART
Click chart to enlarge.
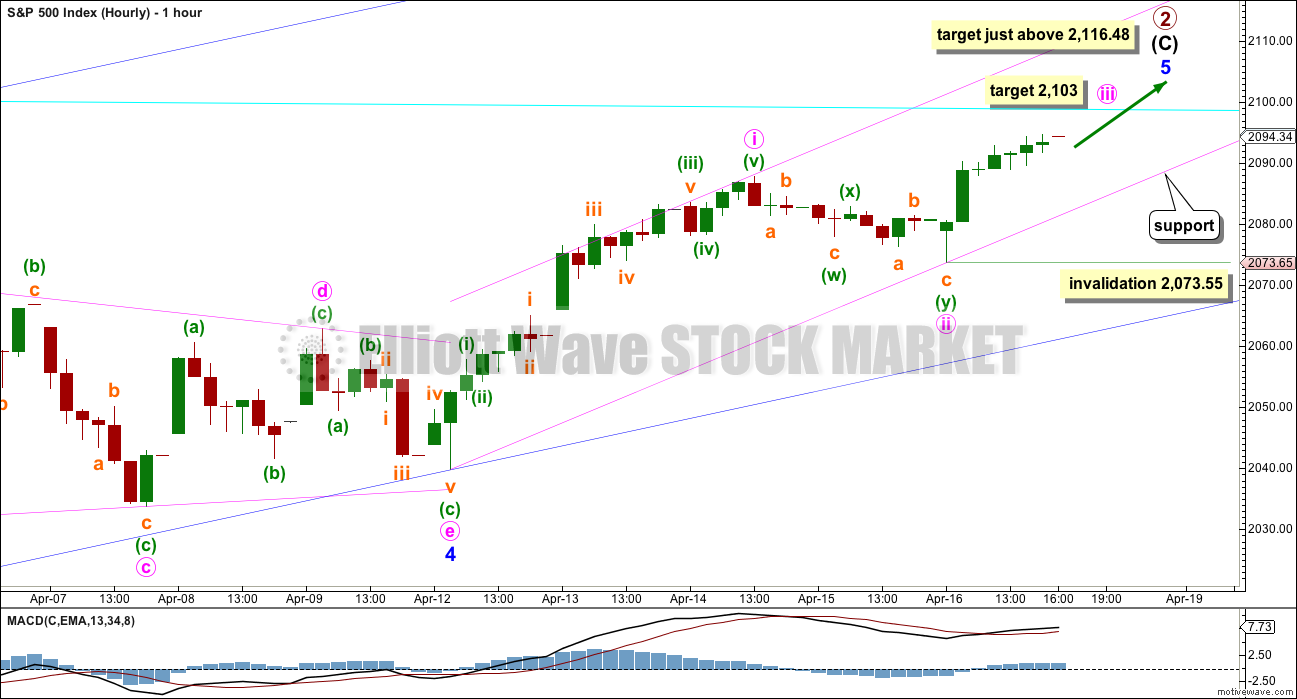
Minute wave i is a complete impulse. Minute wave ii moved lower and is now a complete double zigzag. This was a very shallow second wave correction, ending only just 0.30 of minute wave i. This indicates minute wave iii may be short and weak, and minute wave v may be shorter and weaker still as this whole Dead Cat Bounce limps onto its end.
At 2,103 minute wave iii would reach 0.618 the length of minute wave i. This target is chosen because I expect upwards movement to find resistance about the cyan bear market trend line on the daily chart. This line is copied over today to the hourly chart.
If minute wave iii is shorter than minute wave i, then minute wave v must be shorter still, so that the third wave is not the shortest and the core Elliott wave rule is met.
Within minute wave iii, no second wave correction may move beyond the start of its first wave below 2,073.55.
Draw a base channel about minute waves i and ii (pink upwards sloping lines). Along the way up, downwards corrections should find support at the lower edge of the base channel. Normally, third waves may be expected to breach the opposite side of a base channel but in this instance it may be too weak to do that.
So far minute wave iii has not shown an increase in upwards momentum beyond that seen for minute wave i. It may show some increase tomorrow, but it does not have to. There is divergence today between price and MACD here at the hourly chart level. This indicates further weakness in price. It does not mean upwards movement may end here and only indicates weakness in price. Divergence may continue for a while yet before a trend change, and sometimes divergence disappears and there is no trend change.
ALTERNATE WEEKLY CHART
Click chart to enlarge.
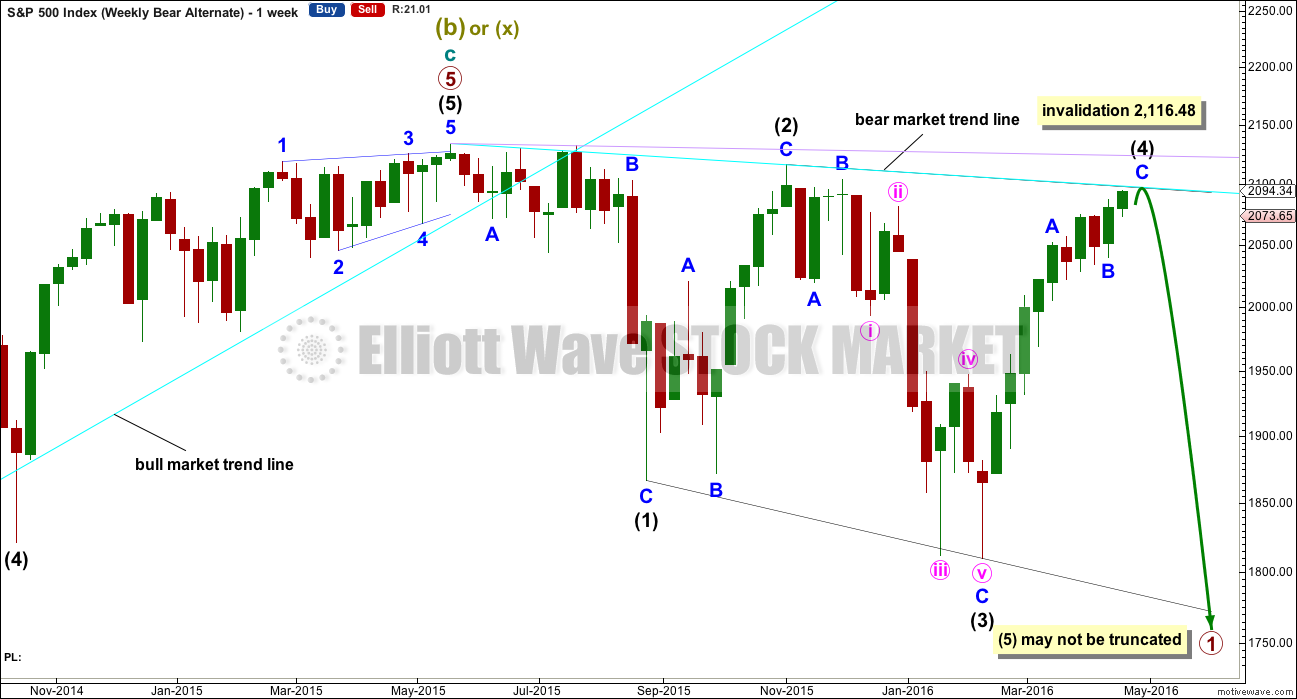
Primary wave 1 may subdivide as one of two possible structures. The main bear count sees it as a complete impulse. This alternate sees it as an incomplete leading diagonal.
The diagonal must be expanding because intermediate wave (3) is longer than intermediate wave (1). Leading expanding diagonals are not common structures, so that reduces the probability of this wave count to an alternate.
Intermediate wave (4) may continue higher now and may find resistance at the bear market trend line.
ALTERNATE DAILY CHART
Click chart to enlarge.
Within a leading diagonal, subwaves 2 and 4 must subdivide as zigzags. Subwaves 1, 3 and 5 are most commonly zigzags but may also sometimes appear to be impulses.
Intermediate wave (3) down fits best as a zigzag.
In a diagonal the fourth wave must overlap first wave price territory. The rule for the end of a fourth wave is it may not move beyond the end of the second wave.
Expanding diagonals are not very common. Leading expanding diagonals are less common.
Intermediate wave (4) must be longer than intermediate wave (2), so it must end above 2,059.57. This minimum has been met. The trend lines diverge.
The triangle is seen as minor wave B. Intermediate wave (4) now has a clearer three wave look to it.
At 2,098 minor wave C would reach 0.236 the length of minor wave A. Intermediate wave (4) would find resistance at the bear market trend line, and price would stop very close to the round number of 2,100. This would have the right look for this wave count.
Leading diagonals may not have truncated fifth waves. Intermediate wave (5) would most likely be a zigzag, must end below 1,810.10, and must be longer in length than intermediate wave (3) which was 306.38 points.
BULL ELLIOTT WAVE COUNT
WEEKLY CHART
Click chart to enlarge.
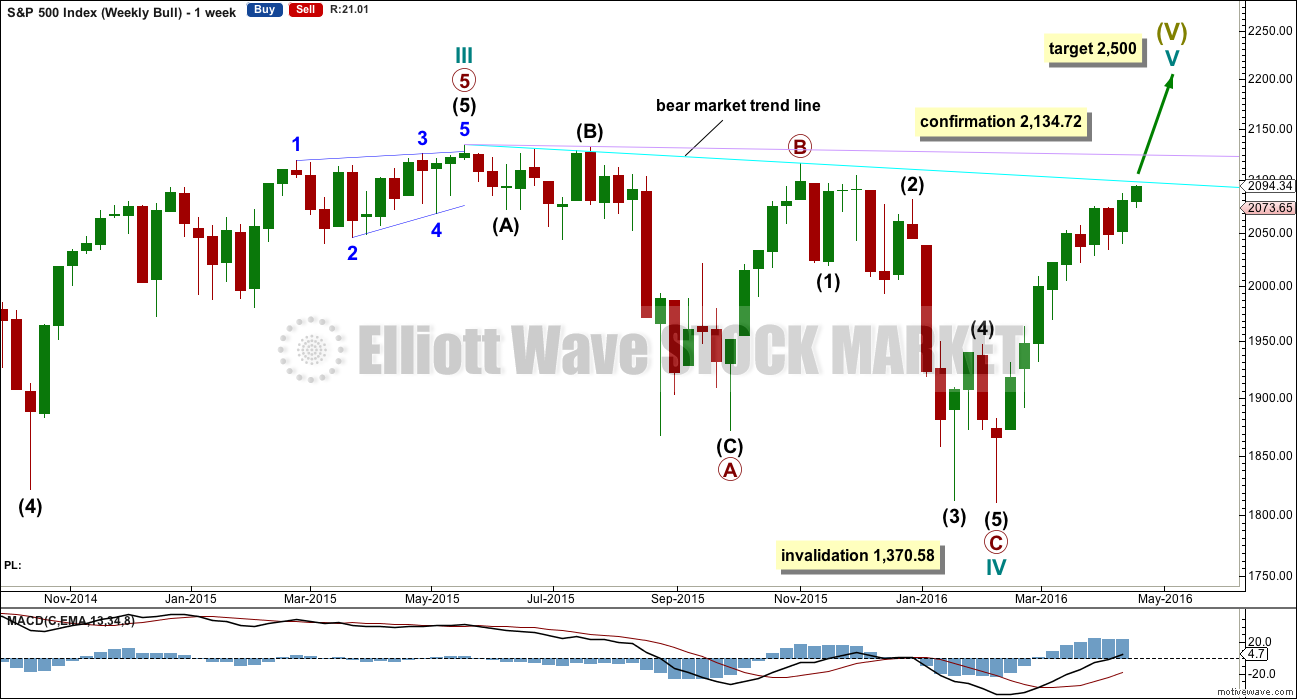
Cycle wave II was a shallow 0.41 zigzag lasting three months. Cycle wave IV may be a complete shallow 0.19 regular flat correction, exhibiting some alternation with cycle wave II.
At 2,500 cycle wave V would reach equality in length with cycle wave I.
Price remains below the final bear market trend line. This line is drawn from the all time high at 2,134.72 to the swing high labelled primary wave B at 2,116.48 on November 2015. This line is drawn using the approach outlined by Magee in the classic “Technical Analysis of Stock Trends”. To use it correctly we should assume that a bear market remains intact until this line is breached by a close of 3% or more of market value. In practice, that price point would be a new all time high which would invalidate any bear wave count.
This wave count requires price confirmation with a new all time high above 2,134.72.
While price has not made a new high, while it remains below the final bear market trend line and while technical indicators point to weakness in upwards movement, this very bullish wave count comes with a strong caveat. I do not have confidence in it.
DAILY CHART
Click chart to enlarge.
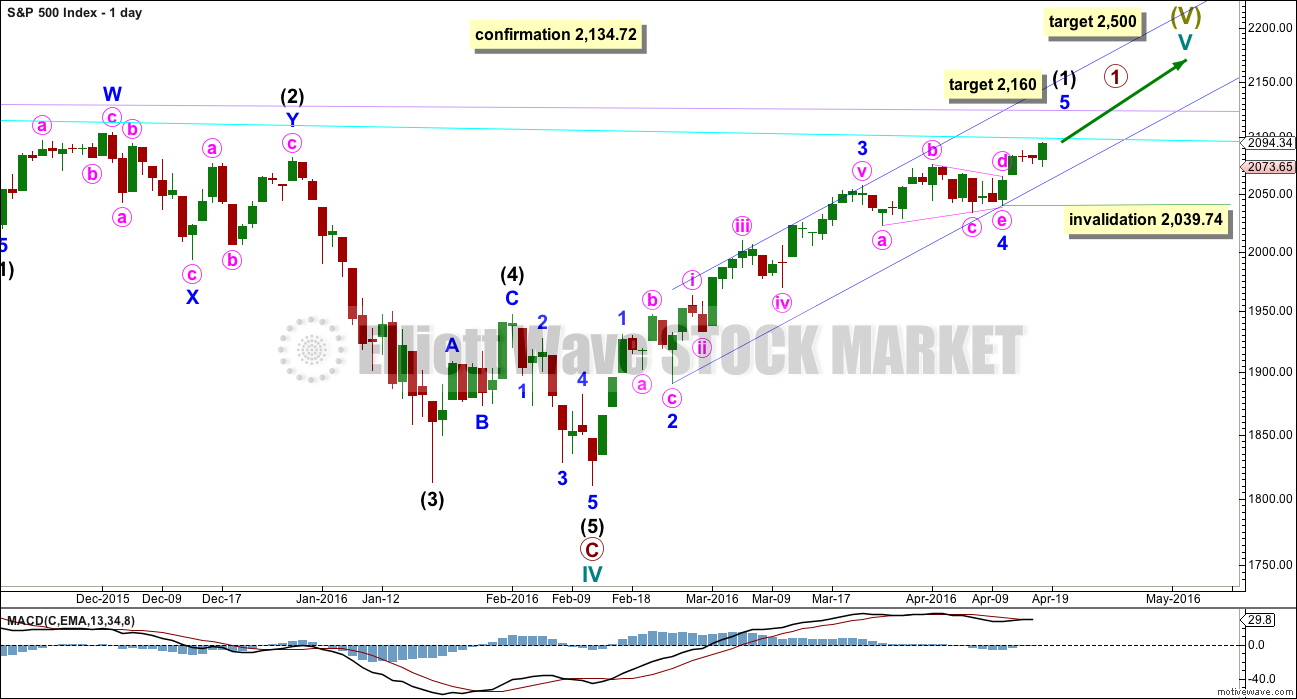
Intermediate wave (2) is seen as an atypical double zigzag. It is atypical in that it moves sideways. Double zigzags should have a clear slope against the prior trend to have the right look. Within a double zigzag, the second zigzag exists to deepen the correction when the first zigzag does not move price deep enough. Not only does this second zigzag not deepen the correction, it fails to move at all beyond the end of the first zigzag. This structure technically meets rules, but it looks completely wrong. This gives the wave count a low probability.
If the bull market has resumed, it must begin with a five wave structure upwards at the daily and weekly chart level. So far that is incomplete.
At 2,160 minor wave 5 would reach equality in length with minor wave 1.
Within minor wave 5, no second wave correction may move beyond the start of its first wave below 2,039.74.
TECHNICAL ANALYSIS
DAILY CHART
Click chart to enlarge. Chart courtesy of StockCharts.com.
Volume data on StockCharts is different to that given from NYSE, the home of this index. Comments on volume will be based on NYSE volume data when it differs from StockCharts.
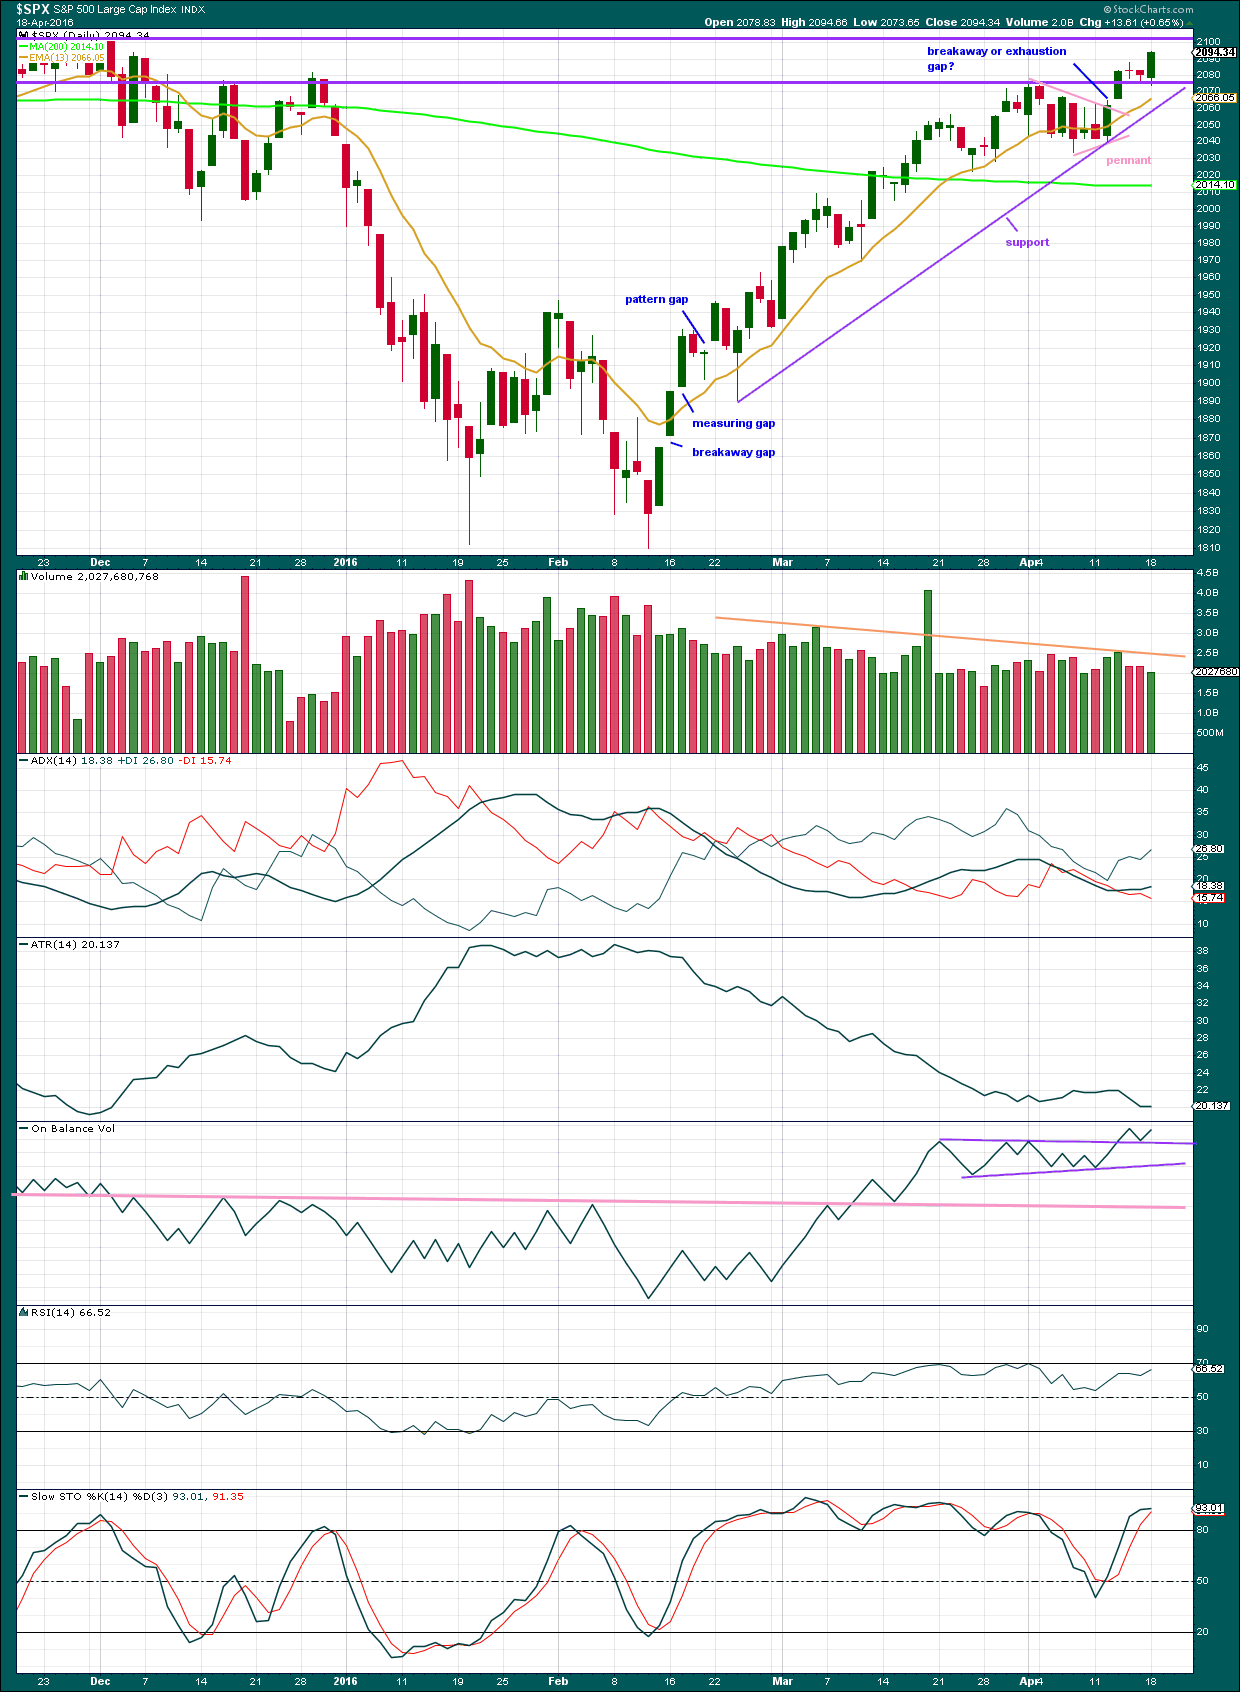
Price has been trending upwards for 45 days. The 13 day moving average is mostly showing where downwards corrections are finding support. It looks like a small pennant pattern has completed and is followed by an upwards breakout with a gap and an increase in volume. The trend has resumed after a few days of consolidation.
The gap has not been closed within a few days, so now it looks like a breakaway gap from the small pennant pattern.
Price found resistance and then support at the horizontal trend line about 2,080 and has bounced up from there. The next line of resistance is about 2,100.
As price moves upwards, it comes overall with declining volume. The trend is weak. It is not supported by volume, so is unsustainable. Volume for Monday’s upwards day is light. The rise in price is not supported by volume. This trend is very weak.
ADX is slightly rising indicating the upwards trend has most likely returned. ATR no longer supports ADX. ATR is declining.
ATR declined for most of this upwards trend. This is not normal for a trend and it indicates weakness.
On Balance Volume is giving a clear bullish signal, albeit a rather weak one. The clear break above the upper purple trend line supports the Elliott wave count short term in expecting more upwards movement. The signal is weak because the line is short held and only tested twice. However, it is close to horizontal, so it has some technical significance. OBV turned lower to test the upper purple line and has moved away, so the strength of that line is now reinforced.
OBV needs to break below the pink line for OBV to give a strong bearish signal, but before that happens breaks below the purple lines would provide weak bearish signals.
RSI has not managed to reach overbought during this trend. Price made a new high today within this current trend yet RSI has not made a corresponding new high. There is now divergence between price and RSI indicating weakness in price.
Stochastics also shows strong divergence with price. This also is indicating price is weak.
INVERTED VIX DAILY CHART
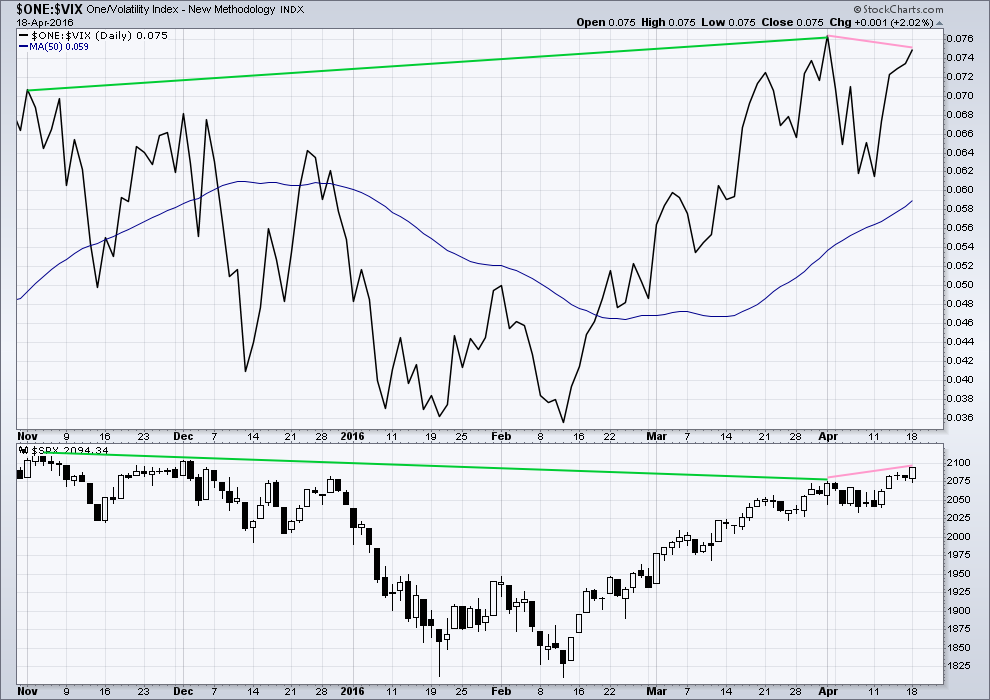
Click chart to enlarge. Chart courtesy of StockCharts.com.
Volatility declines as inverted VIX climbs. This is normal for an upwards trend.
What is not normal here is the divergence over a reasonable time period between price and inverted VIX (green lines). The decline in volatility is not translating to a corresponding increase in price. Price is weak. This divergence is bearish.
Price made a new short term high, but VIX has failed to make a corresponding high (pink lines). This is regular bearish divergence. It indicates further weakness in the trend.
Price has made a new short term high above the high of 1st April. Inverted VIX has not made a corresponding new high. This is regular bearish divergence; it indicates underlying weakness in price.
BULLISH PERCENT DAILY CHART

Click chart to enlarge. Chart courtesy of StockCharts.com.
There is strong hidden bearish divergence between price and the Bullish Percent Index (orange lines). The increase in the percentage of bullish equities is more substantial than the last high in price. As bullish percent increases, it is not translating to a corresponding rise in price. Price is weak.
As price made a new short term high today, BP did not (pink lines). This is regular bearish divergence. It indicates underlying weakness to the upwards trend.
ADVANCE DECLINE LINE
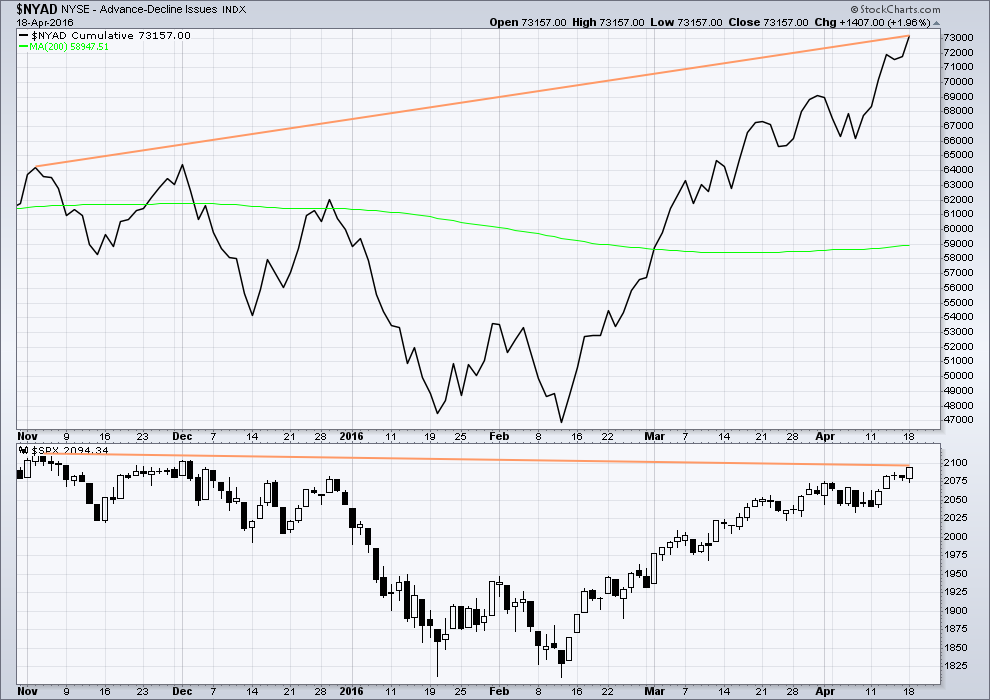
Click chart to enlarge. Chart courtesy of StockCharts.com.
With the AD line increasing, this indicates the number of advancing stocks exceeds the number of declining stocks. This indicates that there is breadth to this upwards movement.
From November 2015 to now, the AD line is making new highs while price has so far failed to make a corresponding new high. This indicates weakness in price; the increase in market breadth is unable to be translated to increase in price.
It remains to be seen if price can make new highs beyond the prior highs of 3rd November, 2015. If price can manage to do that, then this hidden bearish divergence will no longer be correct, but the fact that it is so strong at this stage is significant. The AD line will be watched daily to see if this bearish divergence continues or disappears.
The 200 day moving average for the AD line is now increasing. This alone is not enough to indicate a new bull market. During November 2015 the 200 day MA for the AD line turned upwards and yet price still made subsequent new lows.
DOW THEORY
I am choosing to use the S&P500, Dow Industrials, Dow Transportation, Nasdaq and the Russell 2000 index. Major swing lows are noted below. So far the Industrials, Transportation and Russell 2000 have made new major swing lows. None of these indices have made new highs.
I am aware that this approach is extremely conservative. Original Dow Theory has already confirmed a major trend change as both the industrials and transportation indexes have made new major lows.
At this stage, if the S&P500 and Nasdaq also make new major swing lows, then my modified Dow Theory would confirm a major new bear market. At that stage, my only wave count would be the bear wave count.
The lows below are from October 2014. These lows were the last secondary correction within the primary trend which was the bull market from 2009.
These lows must be breached by a daily close below each point.
S&P500: 1,821.61
Nasdaq: 4,117.84
DJIA: 15,855.12 – close below on 25th August 2015.
DJT: 7,700.49 – close below on 24th August 2015.
Russell 2000: 1,343.51 – close below on 25th August 2015.
This analysis is published @ 09:31 p.m. EST.
Hey guys , 3 or 4 months with Lara , great stuff ! I worked for Bob Prechter in the 90 s – I was a sales person . I always felt I had a decent understanding of Elliott and market psychology . I always question the thought – the most obvious answer is usually the incorrect answer . This area of 2116 to 2134 is major . Could most of the technical sellers be out at this area ? Any chance of a fifth wave extension of minor , and or minute into the 3 % area – double top 2134 spot ? Extensions were always a weird phenomenon .
Would love any thoughts
Hi Fred,
I don’t have anything to add to what I have commented already other than to say welcome to the team. Imho it’s great to have experienced members on board and I hope to hear from you more often.
Hi Fred,, welcome, I am the class clown
Yep. I’ll vouch for that 🙂
I’m moving the stop on my buy now up to the high of minute i, or rather just below 2,087.84. A nice profit protected (excluding any slippage of course)
Tomorrow I’ll be loading up on UVXY June call options, 18 strike price. Hopefully I will get them for about 2.30-2.40 range as it approaches 15 again. I’ll be looking to unload them as UVXY goes above 30 for at least a 5 bagger over the next several weeks…
I’ve been patient for soooo looong (thanks to Lara’s analysis). Its time to make the move…
Had the same idea and picked up some today. I like Jun here because there is more room for error. On the other hand, it seems to me that we make money from here even in the bull case ’cause we are at least due for a correction.
I’m very happy trading UVXY shares – but it’s still a bit of a wild beast (I sold out much of my position near 60 only a month or so ago – now it’s at 15!!). Needless to say UVXY options would scare the living daylights out of me..
You guys trading them truly deserve all the (huge) profits you make (and no doubt need them to help heal past wounds 🙂 🙂 )
Newbies beware! 🙂
Well some of us have a wild side, Olga 😉
Seriously, I keep my positions small, I have a plan in mind and the moment my trade goes outside the plan, its history. Works well. It also doesn’t hurt that I have about 40-50 positions on at any given moment. (That part may be a bit unusual.)
The wave down today fits as a zigzag. I’m not seeing that as an impulse on the five minute chart.
O.K. Did I break some rules thinking minuette b was a second wave?
Nope.
but if that was a second wave then wouldn’t your third wave look like a three?
Well that was a pretty good target. And price going up, at the hourly chart level it looks like minute waves iii and now iv are over.
Minute iii is just 0.67 points longer than 0.618 X minute i. And so it is not very likely that minute v will exhibit a Fibonacci ratio to either of minute i or iii, the S&P rarely exhibits Fibonacci ratios between all three of its actionably waves.
So although now I can calculate a target at minute degree I don’t think it’s going to be very reliable.
There is a limit though. If todays low was minute iv then minute v has a maximum at 2,122.07. Beyond that point it would be longer than minute iii and that means minute iii would be the shortest actionary wave, violating a core Elliott wave rule.
Bottom line: more upwards movement. Target still just above 2,116.48. One final wave up at minute degree is now all that is needed.
If it is over at todays high then intermediate (C) would be truncated by only 12.43 points. That is now becoming acceptable, it is not too large.
But the structure at the hourly chart level doesn’t look complete, nor the daily yet.
Intel fires 12,000 workers, 11% of workforce…
Yes… the economy is wonderful! Things are great! UP… UP… UP… in the S&P & DOW!
Time to hire more waiters and bartenders to get to full employment!
Vern & Joseph,
I guess the bad earnings season will likely take the blame for the drop in markets. Timing wise it works the best for the pumpsters…
I wonder if they’re going to buy back some stock with all the money they’ll be saving…
They are taking a $1.2 Billion Charge for the firing… But that is not counted in the pro-forma earnings.
Already some early rumours of a first quarter contraction…surprise! surprise!….Not! 🙂
As soon as the market forces interest rates higher as morbid fear takes hold of all those bond holders who realise they are going to take a massive haircut on their principal, they will be spending every penny trying to service all those bonds they issued to buy back shares…not a pretty picture I am afraid…
I wonder if Rodney loaded some wagons? ,, I loaded the Prius up, not much cuz my golf clubs take up alot of space..Im sure Im early but oh well..
Hi doc,
For the short answer, I did not fill up any wagons today. I was figuring we still had upside to go. I see from her above post that Lara’s count and target will remain the same except now, of course, we only need one more impulsive wave up.
I am at 1/2 of a full position short. I have not been trying to pick a top but rather trying to get a good price for my trading vehicle. I blew it yesterday when I filled another wagon early in the day. Then I saw a disproportionate percentage drop in UVXY and TVIX relative to VIX and SPX. Since I was caught off guard by this, the uncertainty trips a trigger in my head saying ‘wait till you understand better what has or is happening.’
Based on what I observed yesterday, I am guessing the market makers on the floor ran the stops just under the 52 week low thereby collapsing the price. Then today, they resumed their normal accumulation buying at a big discount to two days before. The value of sitting on the floor and seeing all the buy & sell orders is the reason people pay big bucks to get a seat. And they use deep pockets to push the trades in their favor. I am not a conspiracy theorist by any means. But I did have close friends who long ago sat on the Chicago Mercantile Exchange.
In any event, I am feeling more confident in what is going on ‘tactically’ today. I am ready to load the remaining wagons. My strategy has never been to pick a top. I am trying to focus on getting a good price for my trading vehicle. I will probably fill one wagon tomorrow and the final three as we hit channel breaks / returns and confirmation – confidence points. I don’t need to get the absolute best price if I am correct in what is going to happen. Once we get to the realm of 3X to10X profits a few percent on this end does not mean a whole lot.
I have written far more than I intended. Thanks for asking and that is the longer answer.
Good luck and prosperity to all especially those who work so diligently at this. As I fondly remember Olga once writing, “Me and Ms. Market got some old scores to settle. I am not through with her yet!”
UVXY up, SPX and DJI up….
Joseph, you requested an early alarm…??!!!! 🙂
Bye’ all, have a great evening!
50 dma knocking on the door of the 200 dma in DJI and SPX not too far behind. We had a bullish golden cross back in December in both indices that was quite short-lived. It will be interesting to see if another one is executed the next day or two, or if the 50 dam peels away…
Weird! I got timed out of the site and simply could not get logged back in for the last 20 minutes.
Anyway, just wanted to opine that I would have liked to see the developing doji (if it persists) completely clear the upper B band but it is still touching it…we will see how it closes…
this site?
Yes Lara, I had the same for about 20 min. It was reporting a 500 internal server error.
It could be an error in your .htaccess file or php memory limit or even a plugin as I see you use WP.
If nothing was changed then it cannot be any of those imho 🙂
yes, I also had the same problem at the same time
Okay, I’ll ask Cesar to look into that.
That’s his domain.
This happened while we were sleeping… so it could have been something that our web hosting service was getting up to while we were AWOL.
We have asked for our sites to be moved to a bigger better faster server… maybe that’s what was happening.
Nope. The site hasn’t been moved yet so that wasn’t it.
Will be waiting for the weekend for a move.
We can see the downtime from 12:55 to 1:16. Cesar’s looking into it.
Well folks, I see an initial impulse down…both on SPX and DJI…
There goes 2092.11…. 2091.68
Hey where are all the buyers?
BBs are squeezing, watch out below.
Don’t worry, the banksters are going to start thrashing around like you won’t believe. The bears should now make their intentions know by how they deal with these round number pivots…stand by…
Don’t worry, the banksters are going to start thrashing around like you won’t believe. The bears should now make their intentions know by how they deal with these round number pivots…stand by…
I will be exiting my remaining calls on what I now expect is a small second wave bounce..
A new low below 2092.11 and we have an impulse down.
This morning’s gap up open already filled.
yeh, prob minute iv. Here’s not hoping though!
He he… anyones fingers twitchin much??!! 🙂 🙂
It is not beyond the realms of possibility that we could still be in Minute (ii) (expanded flat) or even Minute (iv) for a triangle if it turns out that Minor 4 was a simple zig zag (as per my earlier comment).
Move up to todays high looks more 3ish than 5ish to me, but it could be either.
That’s what makes EW so much fun 🙂
Hey!! Are you twitching at me…??!!! 🙂
personally I prefer twerking
I had no idea what that meant until Miley Cyrus let the cat (so to speak) out of the bag…! Twerk On! 🙂
I think I may have to stay up overnight tonight… and hang out here with you all.
And maybe tomorrow night as well…
Not sure I can do that though. I need sleep!
Unfortunately my time zone does not mesh well with trading S&P on NY time. NY opens at 1am my time, and closes just after I normally get up at 7am
This is looking like a really unstable chart pattern. Big gap up with an island reversal look. The gap is likely to get filled, plus price spikes down in the yesterdays chart are a magnet for price downward to 208. UVXY has a rounded bottom look, now with price spiking.
It just has that look… consolidation in the gap, perhaps followed by an attempt to move up, then the break down?
Yeah…the bears have been beating up the banksters since early this morning. It is really funny to watch ’em get smacked around…heh! heh! 🙂
looks impulsive to me. Could be the start!!!
Quick double zig-zag? Second one moved price appreciably lower. If that is correct, we now move on up to exceed this morning’s highs…
UVXY calls from this morning already up 75% but I don’t think we are done yet. I think this is still minute four unfolding a bit faster than minute two….
Of course…I could be wrong….so very, very, wrong! 🙂 🙂 🙂
Look for UVXY to make a higher low…if that happens…well, need I say more?! 🙂
In the nature of things, it is not unusual for historic junctures in the market to be accompanied by some newsworthy event which everyone then cites as the reason for what the market does. If such were to be the case with any soon unfolding market reversal, the blogosphere would come alive with various cause and effect postulations. Very few will cite the plethora of technical data, unfolding over many months, that clearly portended what was unfolding….
Still looking corrective; probably either minuette or minute four…
Yep! I would wager yet another (contracting?) triangle has put in an appearance. We should eventually see a sharp move up out of it to complete the impulse up, either at minute or minuette degree…finger on the trigger to exit last remaining calls…
If that is a triangle playing out and we have a sharp move up out of it, that would fit nicely with the top of the channel line at about 2110.00 looking at my chart.
The fifth wave up is quite weak. If Olga’s observation about it being a possible minute five is right, we should now see a face-ripping impulse wave down, probably lead by a plunge in NDX. If not, a meandering boring minute wave four taking up the rest of the day should unfold….
On second thought and look, It could be the minuette fourth wave is continuing…
Right on cue – UVXY seems to be getting a bit twitchy. It just went green for a millisecond on my screen.
Minuette (i) would be around 2092.85 – first warning shot perhaps…
One of the interesting things that UVXY does at key reversals is it starts heading North and does not look back; regardless of what the markets are doing. This very marked divergence between UVXY (not necessarily VIX) and market price action can be a clue that party’s over…two green closes after a new 52 week low is generally good for at least an interim pullback….
O.K. All I need to put a great big smile on my Caribbean face is for SPX to now move above this morning’s high….even if just for a few seconds…..( the little matter of those 210 SPY calls) 🙂 🙂
If this is minuette four of minute three minuette five is going to have to be very very short as three was shorter than one…
Looks like shallow minute four underway…
Looking for an early bolt to the downside in NDX…
SPX has now accomplished four days in a row, something it had not done in the past 24 months or more… upper BB penetration…not very bearish imo 🙂
And here’s the kicker…we are not even at new highs!!!
If Minor 4 finished at 2033 (zig zag) instead of 2039 (triangle), then we could now be in minute (v) rather than minute (iii). I think this is a low probability but I’m keeping an eye on it just in case.
RSI is currently suggesting todays move up is minute (iii) as expected
Any move above 2104.05 and I’m gone…(to Carolina in my mind!) 🙂
I want to clarify your statement Verne. Are you saying that the upper BB penetration of the last four days is a bullish signal?
Bullish sentiment….berry, berry bullish….Bearish signal….berry, berry bearish… 🙂
Thank you.
O.K. I can see why Rodney was confused… I meant not very bearish SENTIMENT.
Thanks for the heads-up Rodney… 🙂
The next thing we as traders should be looking for is an impulsive wave to the downside. The upcoming fourth wave will in all likelihood be another meandering affair sporting the ubiquitous triangle of the recent corrections.
The signal of the next wave down will be an impulsive five down, and I have a funny feeling that it’s going to take place intra-day…
I would like it intraday rather than in the overnight.
So it will probably be overnight since it does the opposite of what I post. Maybe I should not post anymore.
You just might get your wish this time around my friend! 🙂
My ‘loading up’ strategy up to ATH is to buy my remaining 60% short as close to ATH as possible or as backup I will scale in if/when price breaks below:-
1) 2087 (minute (i) high)
2) Minor 4 / minute (ii) trendline support
3) 2073 (minute (ii) low)
The above may change if unfolding structure demands it (i.e. Ending Diagonal).
My stop is not necessarily ATH – if we get ATH I will need to sit back and look at how far off a W2 down would likely be for the Bullish count as we would still be looking at a 5 up (albeit – it could extend!!)
I find it useful to plan now – I always remember my flight instructor telling me that the cockpit is not a place to panic – ATH is not either imho.
If SPX fills the gap from yesterday’s high at 2094.66 I will consider that very significant. Let’s see of both DJI and SPX can hold onto the round numbers today.
They really should, even with a minute four correction, until minute five up is done.
If they do not hold them I think a fifth wave truncation is in the works….
There is a terrific battle going on in the markets. The banksters are clearly trying to push the market higher by brute force and they are getting absolutely hammered. If you were paying attention, DJI actually opened up slightly in the RED this morning!
I also picked up some SPY 210 calls on an open order for 0.77 this morning that I plan on unloading later today as soon as minute three up get close to completion. Will use proceeds to add to UVXY calls…
Yesterday in the forum, Lara asked, “What if I am wrong?” Her concern of course was and is for her subscribers especially those who, like me, have already taken short positions along the way of this large 290 SPX point rally. As a result, I have asked myself the same question.
The role of 2nd waves in EW is to cause everyone to ask that or similar questions. The role of the 2nd wave is to convince the most people, the masses, that the original idea that we are entering a bear market is in fact wrong. It works to get as much money bullishly positioned before the sharpest and deepest part of the correction happens. Then during the 3rd wave, the masses sell out their longs adding fuel to the fire of the bear market.
Most every indicator I look at is telling me we are at extreme bullishness in sentiment and momentum. These indicators are holding at these extreme levels. These indicators cannot go much or any higher. They must come down and to use a term Verne used this morning, they must revert to the mean.
This can happen in two ways. First, there can be a sideways consolidation in price from here that allows the extreme pressures to be released slowly. It is like letting the air out of a balloon under control. The second way the overbought, overly bullish extremes can be relieved is by a strong downward move. This is more like a balloon bursting. It is sudden, severe and sharp. The way in which we work off these extremes will give us guidance as to what kind of market we are experiencing, bull versus bear.
The reality is that bear markets are like a balloon bursting. That is what I think we will see. I am convinced enough by a host of evidences to put money on it and take advantage of this opportunity. Olga has rightly mentioned that this could turn out to be like a ‘once in a lifetime’ opportunity. The upside risk is another 20 to 50 SPX points before at least a normal correction occurs. The downside potential is to see a move of at least 300 points taking us to 1800 in the next 4 to 6 weeks. The longer term downside potential is 600 points taking us to 1500. If the very long term bear count is correct we could see a 1400 point move to the downside in the next couple of years.
No matter what I hear through this forum, other forums, or through the grapevine, all the hard and solid data I see is telling me we are in for a spill and it is coming very soon. If I am wrong, it will not be the first time and it will not be the last. But I must play the percentages / the odds the way I see them.
By the end of June we will know what is currently the future. We will know if 2016 is the year of the bear attack or the bull runs on again.
Several weeks ago when I had a gut feeling that we were at the beginning of what could be a primary wave two up I was personally filled with doubt as it seemed like such an outlandish idea. I simply could not believe that with all the information available to market participants, any circumstances could arise, including a primary two wave correction, that would convince the vast majority of traders that the bull was alive and well. Based on what has subsequently transpired, those doubts have evaporated.
This has got to be the most picture perfect primary wave two performance in our lifetimes.
This market is “Stupid” and “DUMB”… They believe every jawboning LIE that is floated by the Central Banks around the world.
They also believed in the Oil Deal which didn’t happen and now that the deal didn’t occur they believe some other LIE floated out there!
World leaders LIE… President’s LIE… Politician’s LIE… Talking Heads on Business shows LIE, to talk their book… CEO’s LIE in using pro-forma numbers in financial statements over GAAP numbers. Share buy backs mask the poor earnings numbers. Everyone ignores Revenue which is stagnant to down materially.
EVERYBODY LIES!
But the Truth always wins out in the end!
I always ask myself “what if I’m wrong”.
Most especially when I have such confidence in a wave count as I do this bear wave count.
Because in my experience it is when I get too cocky that I get it wrong.
I always need an alternate to go to if the main count is invalidated. Low probability does not mean no probability. A high probability wave count does not always play out as expected.
It looks to me like this market is topping and at an exhaustion point. Selling SPY 209 calls for 0.97, buying first batch of UVXY May 6 18.50 calls for 0.90…will add to lower cost basis on any further move up toward target…
SPX High this morning 2099.62 in 1st 5 min. of trading and then 2099.76 in the 2nd 5 min of trading.
Also at 5:50 to 5:55AM ES hit a high of 2098.50 the SPX equivalent if it were trading would have been at ~ 2104.50 high.
So TAF’s
Sp hit 2,104.25 just before 11am GMT
If you want to keep an eye on this indicator here is one link that does it:
http://www.indexindicators.com/charts/sp500-vs-vix-1d-sma-params-3y-x-x-x/
Sorry, I don’t get what the meaning of this is… can you explain? No labeling explanation.
Blue line is SPX, red line is VIX. The size of the spread is indicated by the distance between the two lines. The wider apart they are, the greater the spread. The longer a wide spread persists, the greater the chances are of a violent correction to lessen it. These occasions can be seen on the chart when the spread reverts to the mean with the lines “kissing” each other as happened in August last year, and Jan/Feb this year.
While it is true that a wide spread may persist for some time, it will eventually revert, and this is one good way to identify market extremes…
Thanks, Does it always work like that or is this just a more recent thing like for example Oil & Stocks moving together?
So far as a reversion to the mean with SPX and VIX…ALWAYS! 🙂
You can look at that chart going back for as long as data has been available and the reversion never fails to occur; sometimes sooner, sometimes later, but always….
Thanks for the research on that! Now I see how that can be a very valuable indicator.
Is there anyway for the powers that be to mask those numbers… like they do with the total shorts number?
That is the beauty of it; since SPX and VIX are DIRECTLY correlated, there is no way for them to bulls..t us as to what is really going on so far as that spread is concerned….
I must say I am genuinely perplexed by all the talk about how bearish investors are, and must conclude the statements in this regard must be either purely anecdotal or intended to mislead. The assertion simply does not comport with the facts. Here is a chart of the spread between the VIX and SPX. Draw your own conclusions based on the hard evidence. One of the safest and most predictable trades one can make is a “reversion to the mean trade”. 🙂
In addition to the earnings beat game (fabricated)… They now fabricate a bearish sense by jawboning when it is not. Everyone now lies without consequences.
It amazes me how stupid and what suckers the market is.
Nice chart Verne. Thanks.
Most welcome! 🙂
Very interesting chart,thanks for sharing it Verne
We should see a green candle today to complete minute three. European bourses all higher. I suspect overnight futures will usher in another sharp move down for tomorrow as it did to end minute two but perhaps a bit more shallow to alternate. It looks like another upper BB penetration in the works today, further evidence of unprecedented bullishness in the markets.
There are rumours that practically all the buying these days is coming from the banksters hence the persistently low volume. Be that as it may, Elliott waves are Elliot waves, regardless of the source of their formation…
As we approach ATH, it is worth noting that our risk reward on the short side becomes a potential once in a lifetime deal.
*If we are wrong* and make new all time highs, we should still soon get at least a 50% retrace in a wave 2 before a very bullsh wave 3. So from a trading point of view the risk here should be very limited for those that did not (overly) jump the gun.
All that said – as we all know nothing is certain. We have to play the odds that are presented to us (or not play at all), even if an unexpected cruel low probability count turns up and kicks us to the ground.
No risk, no reward 🙂 🙂
Good luck everyone!!
Nothing in the markets is certain, so the best anyone can base their trading on is probabilities.
Right now, i think there is more probability of the SPX making a new ATH than what there is of seeing 1800 again.
Too many people looking down still… 86% of my brokers clients are short all the major US indices. VERY unlikely the market will even offer a small pullback never mind a third wave down type move with those sort of stats imho….
We won’t see a decent move to the downside until the majority are bullish.
That won’t happen until after new ATH’s. Just my opinion of course…
Stuart,
The short interest works both ways…look at the increase in TVIX short interest during the month of March alone
“Credit Suisse AG – VelocityShares Daily 2x VIX Short Term ETN (NASDAQ:TVIX) saw a large growth in short interest during the month of March. As of March 31st, there was short interest totalling 45,841,882 shares, a growth of 10.9% from the March 15th total of 41,347,030 shares, ARN reports. Based on an average daily volume of 37,686,931 shares, the short-interest ratio is currently 1.2 days.”
Big short interest in the Inverse ETF’s… that in fact means more Bulls than bears hidden in the total short numbers.
Completely agree Olga, very good post. The time is coming bull or bear, gla with your trading
fiddle sticks,, second
1