
Again, upwards movement was expected.
Summary: This is still a bear market rally until proven otherwise. A final fifth wave up is required to complete the structure. The target is 2,124. The invalidation point for this rally is 2,134.72. A short term target for a small fifth wave is added at 2,081.
To see last published monthly charts click here.
To see how each of the bull and bear wave counts fit within a larger time frame see the Grand Supercycle Analysis.
To see detail of the bull market from 2009 to the all time high on weekly charts, click here.
New updates to this analysis are in bold.
BEAR ELLIOTT WAVE COUNT
WEEKLY CHART
Click chart to enlarge.
This bear wave count fits better than the bull with the even larger picture, super cycle analysis found here. It is also well supported by regular technical analysis at the monthly chart level.
Importantly, there is no lower invalidation point for this wave count. That means there is no lower limit to this bear market.
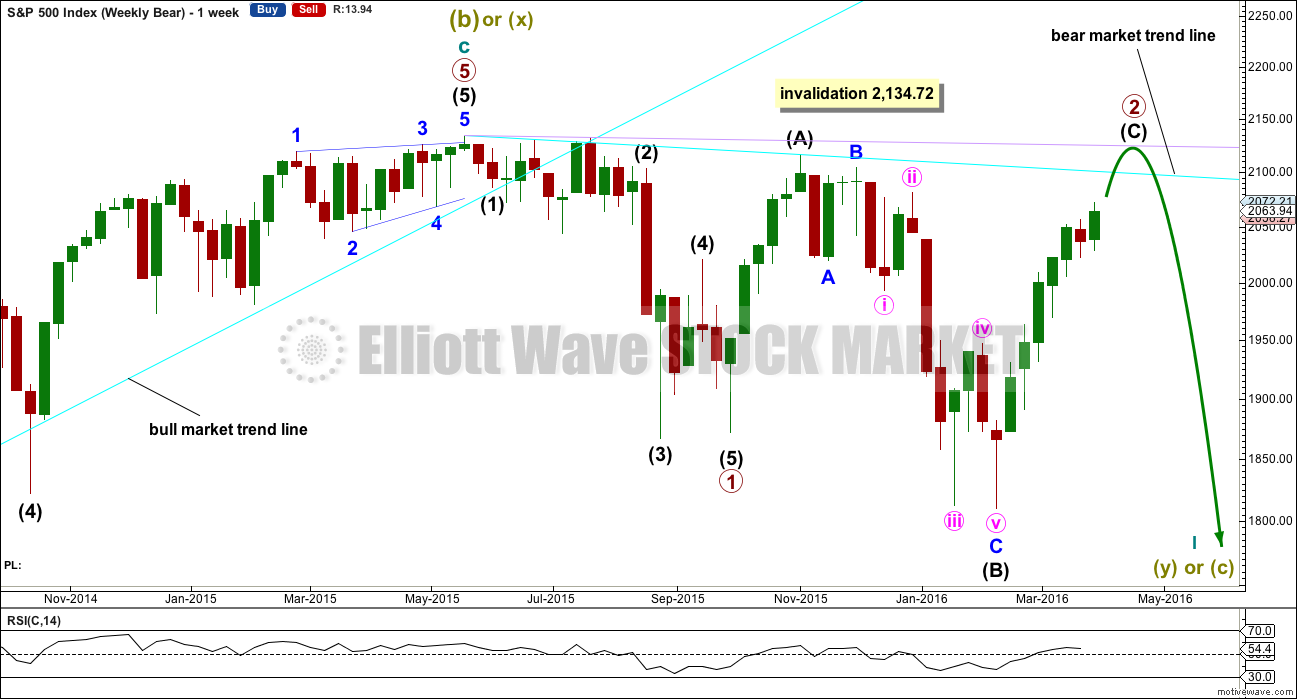
Primary wave 1 may be complete and may have lasted 19 weeks, two short of a Fibonacci 21. So far primary wave 2 is in its 25th week. It looks unlikely to continue for another 9 weeks to total a Fibonacci 34, so it may end in about two to five weeks time. This would still give reasonable proportion between primary waves 1 and 2. Corrections (particularly more time consuming flat corrections) do have a tendency to be longer lasting than impulses.
Primary wave 2 may be unfolding as an expanded or running flat. Within primary wave 2, intermediate wave (A) was a deep zigzag (which will also subdivide as a double zigzag). Intermediate wave (B) fits perfectly as a zigzag and is a 1.21 length of intermediate wave (A). This is within the normal range for a B wave of a flat of 1 to 1.38.
Intermediate wave (C) is likely to make at least a slight new high above the end of intermediate wave (A) at 2,116.48 to avoid a truncation and a very rare running flat. However, price may find very strong resistance at the final bear market trend line. This line may hold price down and it may not be able to avoid a truncation. A rare running flat may occur before a very strong third wave down.
If price moves above 2,116.48, then the new alternate bear wave count would be invalidated. At that stage, if there is no new alternate for the bear, then this would be the only bear wave count.
Primary wave 2 may not move beyond the start of primary wave 1 above 2,134.72.
DAILY CHART
Click chart to enlarge.
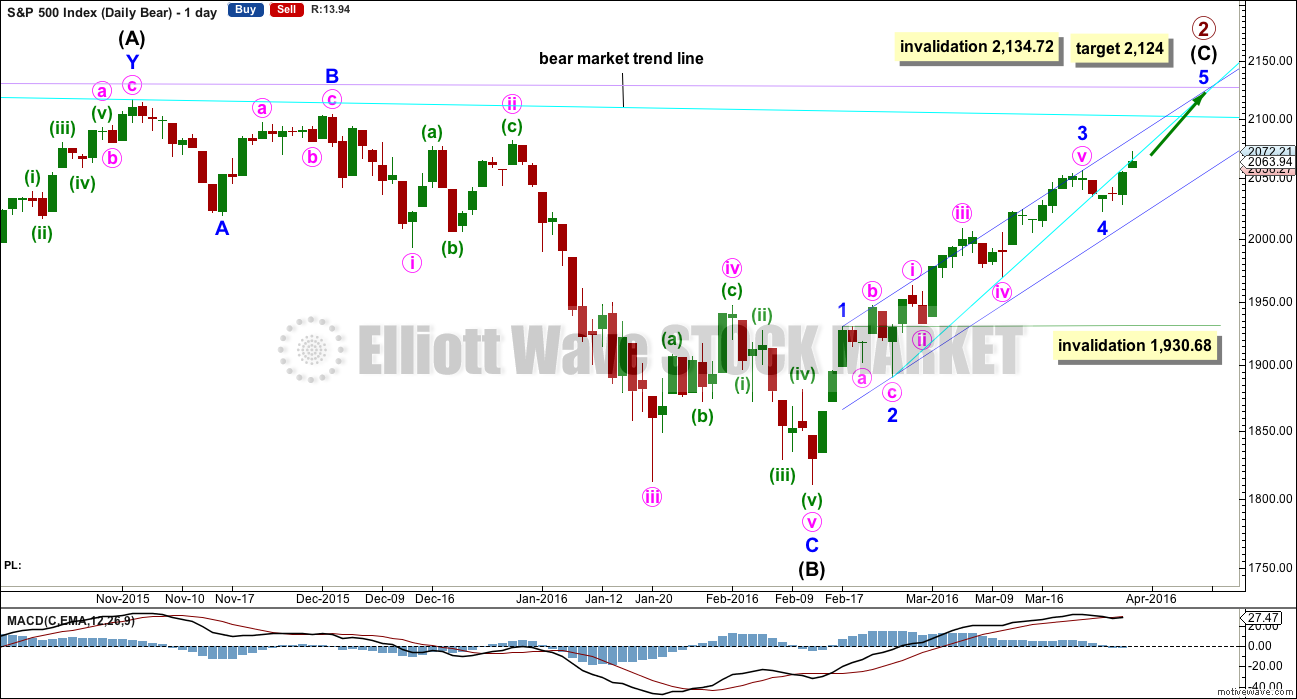
Intermediate wave (A) fits as a single or double zigzag.
Intermediate wave (B) fits perfectly as a zigzag. There is no Fibonacci ratio between minor waves A and C.
Intermediate wave (C) must subdivide as a five wave structure. It is unfolding as an impulse.
Intermediate wave (C) does not have to move above the end of intermediate wave (A) at 2,116.48, but it is likely to do so to avoid a truncation. If it is truncated and primary wave 2 is a rare running flat, then the truncation is not likely to be very large. As soon as price is very close to 2,116.48 this wave count looks at the possibility of a trend change.
The next wave down for this wave count would be a strong third wave at primary wave degree.
A bull market trend line for this rally is drawn across the first two small swing lows as per the approach outlined by Magee. This upwards sloping cyan line may provide support for corrections along the way up. Price broke below the cyan line. It may now provide resistance. The S&P has a tendency to break out of channels or below lines and then continue in the prior direction. It may do this again here.
At 2,124 minor wave 5 would reach 0.618 the length of minor wave 3. Intermediate wave (C) would avoid a truncation and the wave count would remain valid. Primary wave 2 would fulfill its purpose of convincing everyone that a new bull market is underway, and it would do that right before primary wave 3 surprises everyone.
If it continues lower, then minor wave 4 downwards may not move into minor wave 1 price territory below 1,930.68.
Within the impulse of intermediate wave (C), minor wave 2 is an expanded flat and minor wave 4 is a zigzag if it is over as labelled. These two corrections look to be nicely in proportion. It is most likely that minor wave 4 is over and minor wave 5 upwards is underway.
HOURLY CHART
Click chart to enlarge.
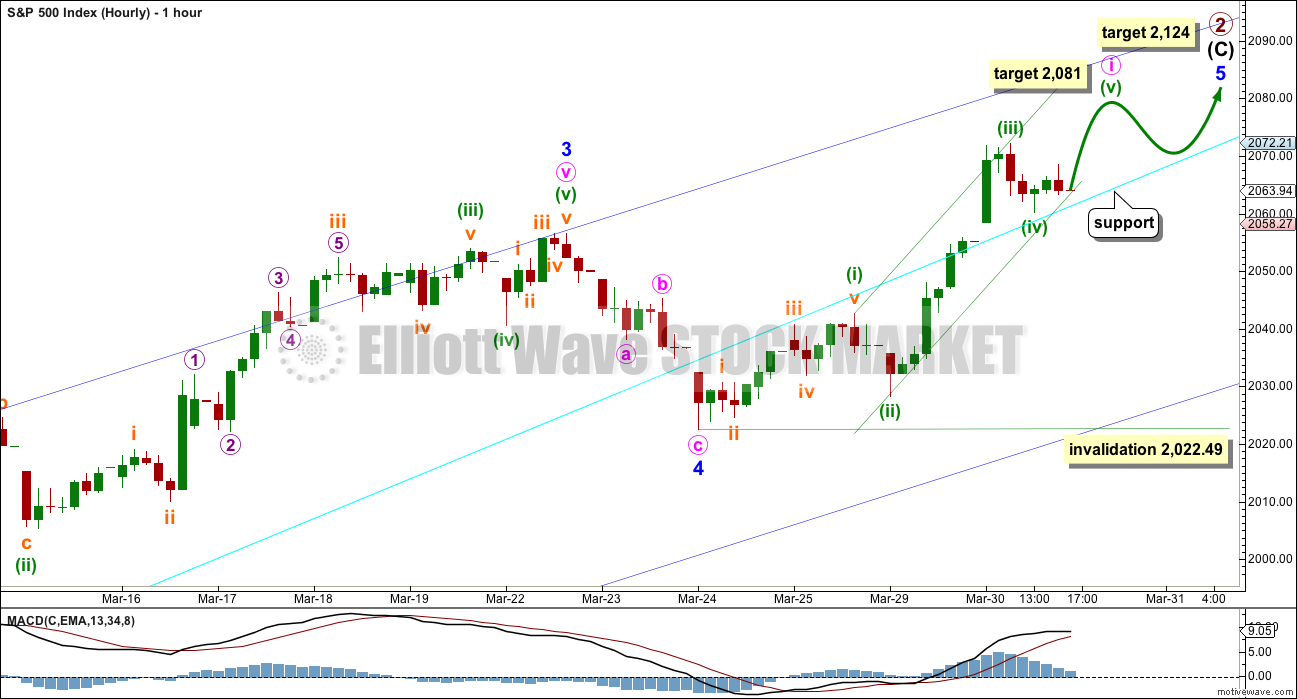
Although it is possible that minor wave 5 is coming to an end, if it is over soon, then intermediate wave (C) would have a huge truncation. The probability of this is not impossible, but it is too low to seriously consider.
What looks more likely is within minor wave 5 only minute wave i is an almost complete impulse.
There is no Fibonacci ratio between minuette waves (i) and (iii) within minute wave i. This makes it more likely that minuette wave (v) would exhibit a Fibonacci ratio to either of minuette waves (i) or (iii). At 2,081 minuette wave (v) would reach equality in length with minuette wave (i). This is the most common ratio for a fifth wave, so this target has a good probability.
As soon as there is a new high above the end of minuette wave (iii) at 2,072.21 then minuette wave (v) would have avoided a truncation. It is possible that minute wave i may be over as soon as that happens. A breach of the small green channel containing it would provide indication that it would likely be over.
Minute wave ii may not move below the start of minute wave i at 2,022.49.
The cyan trend line is copied over from the daily chart. So far this trend line may provide some resistance. If price fully breaks above that line, then it may provide support.
Minor wave 5 may end at the upper edge of the dark blue channel also copied over from the daily chart.
ALTERNATE WEEKLY CHART
Click chart to enlarge.
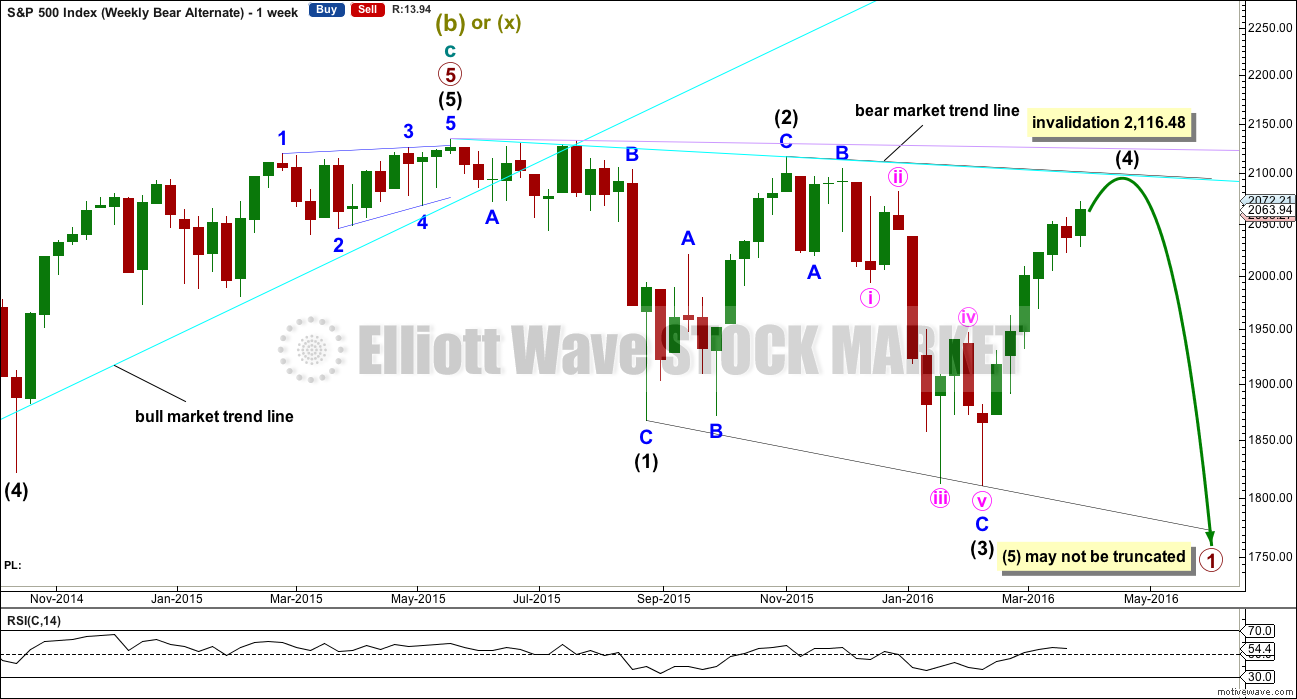
Primary wave 1 may subdivide as one of two possible structures. The main bear count sees it as a complete impulse. This alternate sees it as an incomplete leading diagonal.
The diagonal must be expanding because intermediate wave (3) is longer than intermediate wave (1). Leading expanding diagonals are not common structures, so that reduces the probability of this wave count to an alternate.
Intermediate wave (4) must continue higher and may find resistance at the cyan bear market trend line. Intermediate wave (4) may not move above the end of intermediate wave (2) at 2,116.48.
ALTERNATE DAILY CHART
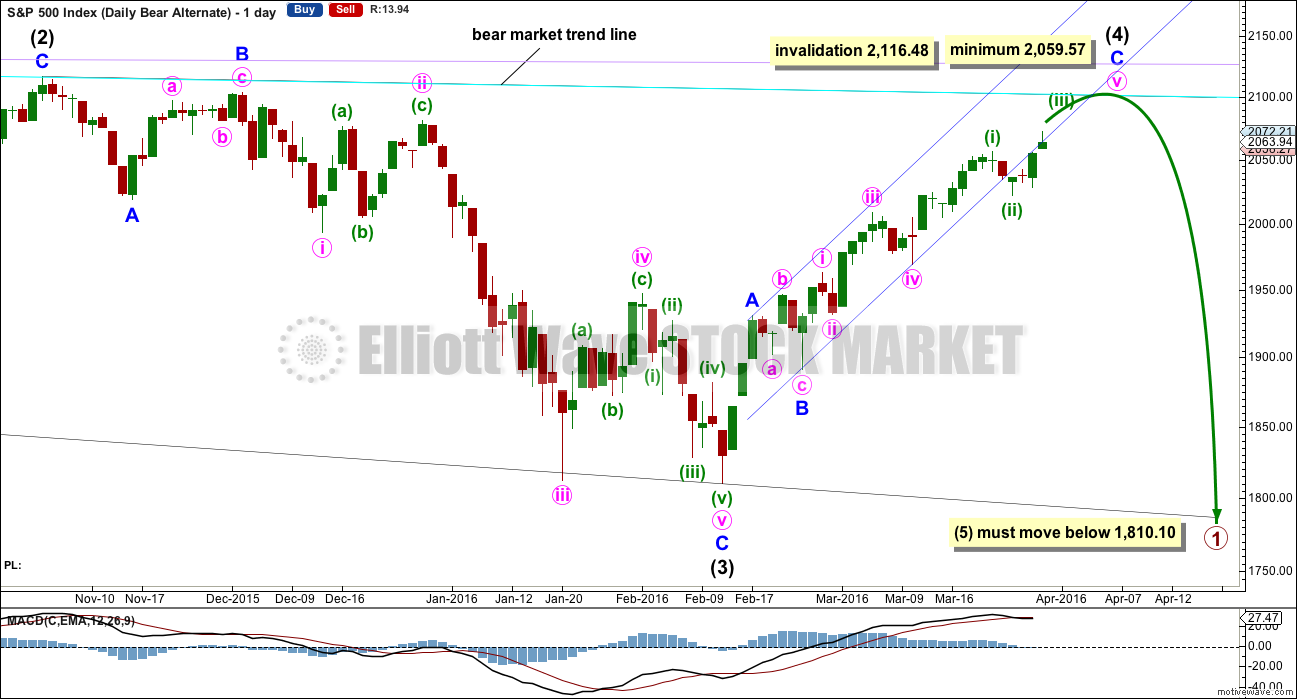
Click chart to enlarge.
Within a leading diagonal, subwaves 2 and 4 must subdivide as zigzags. Subwaves 1, 3 and 5 are most commonly zigzags but may also sometimes appear to be impulses.
Intermediate wave (3) down fits best as a zigzag.
In a diagonal the fourth wave must overlap first wave price territory. The rule for the end of a fourth wave is it may not move beyond the end of the second wave.
Expanding diagonals are not very common. Leading expanding diagonals are less common.
Intermediate wave (4) must be longer than intermediate wave (2), so it must end above 2,059.57. If this minimum is not met, this wave count would be invalid. The trend lines must diverge.
Leading diagonals may not have truncated fifth waves. Intermediate wave (5) would most likely be a zigzag, must end below 1,810.10, and must be longer in length than intermediate wave (3) which was 306.38 points.
BULL ELLIOTT WAVE COUNT
WEEKLY CHART
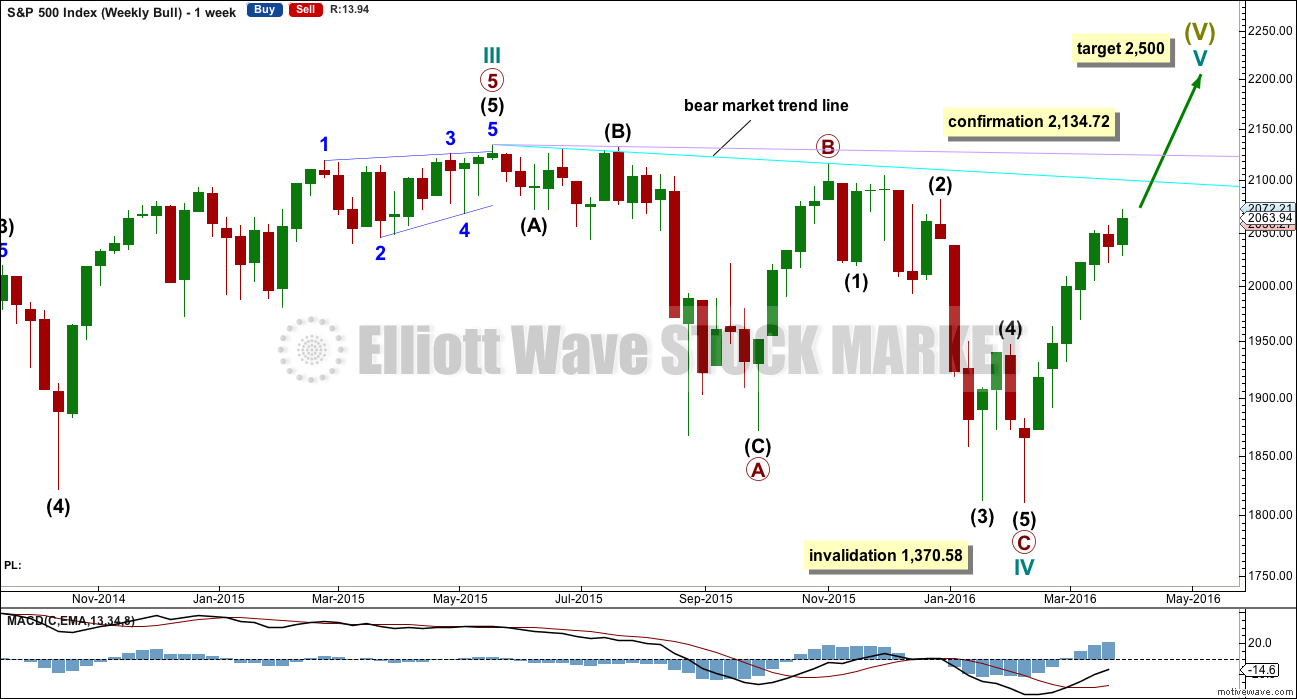
Click chart to enlarge.
Cycle wave II was a shallow 0.41 zigzag lasting three months. Cycle wave IV may be a complete shallow 0.19 regular flat correction, exhibiting some alternation with cycle wave II.
At 2,500 cycle wave V would reach equality in length with cycle wave I.
Price remains below the final bear market trend line. This line is drawn from the all time high at 2,134.72 to the swing high labelled primary wave B at 2,116.48 on November 2015. This line is drawn using the approach outlined by Magee in the classic “Technical Analysis of Stock Trends”. To use it correctly we should assume that a bear market remains intact until this line is breached by a close of 3% or more of market value. In practice, that price point would be a new all time high which would invalidate any bear wave count.
This wave count requires price confirmation with a new all time high above 2,134.72.
While price has not made a new high, while it remains below the final bear market trend line and while technical indicators point to weakness in upwards movement, this very bullish wave count comes with a strong caveat. I do not have confidence in it.
DAILY CHART
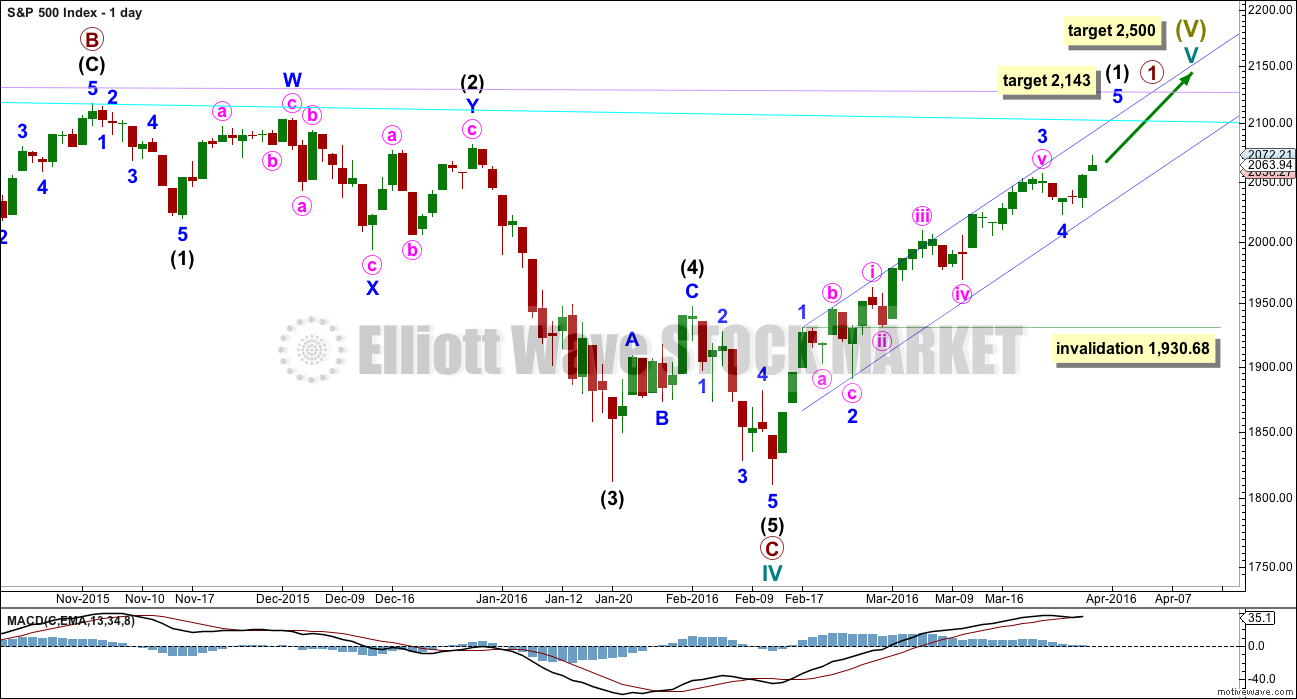
Click chart to enlarge.
Upwards movement cannot now be a fourth wave correction for intermediate wave (4) as price is now back up in intermediate wave (1) territory above 2,019.39. This has provided some clarity.
For the bullish wave count, it means that primary wave C must be over as a complete five wave impulse.
Intermediate wave (2) is seen as an atypical double zigzag. It is atypical in that it moves sideways. Double zigzags should have a clear slope against the prior trend to have the right look. Within a double zigzag, the second zigzag exists to deepen the correction when the first zigzag does not move price deep enough. Not only does this second zigzag not deepen the correction, it fails to move at all beyond the end of the first zigzag. This structure technically meets rules, but it looks completely wrong. This gives the wave count a low probability.
If the bull market has resumed, it must begin with a five wave structure upwards at the daily and weekly chart level. So far that is incomplete.
Downwards movement may not be a lower degree correction within minute wave v because it is in price territory of the first wave within minute wave v. This downwards movement must be minor wave 4. At 2,143 minor wave 5 would reach equality in length with minor wave 1.
Minor wave 4 may not move into minor wave 1 price territory below 1,930.68.
TECHNICAL ANALYSIS
DAILY CHART
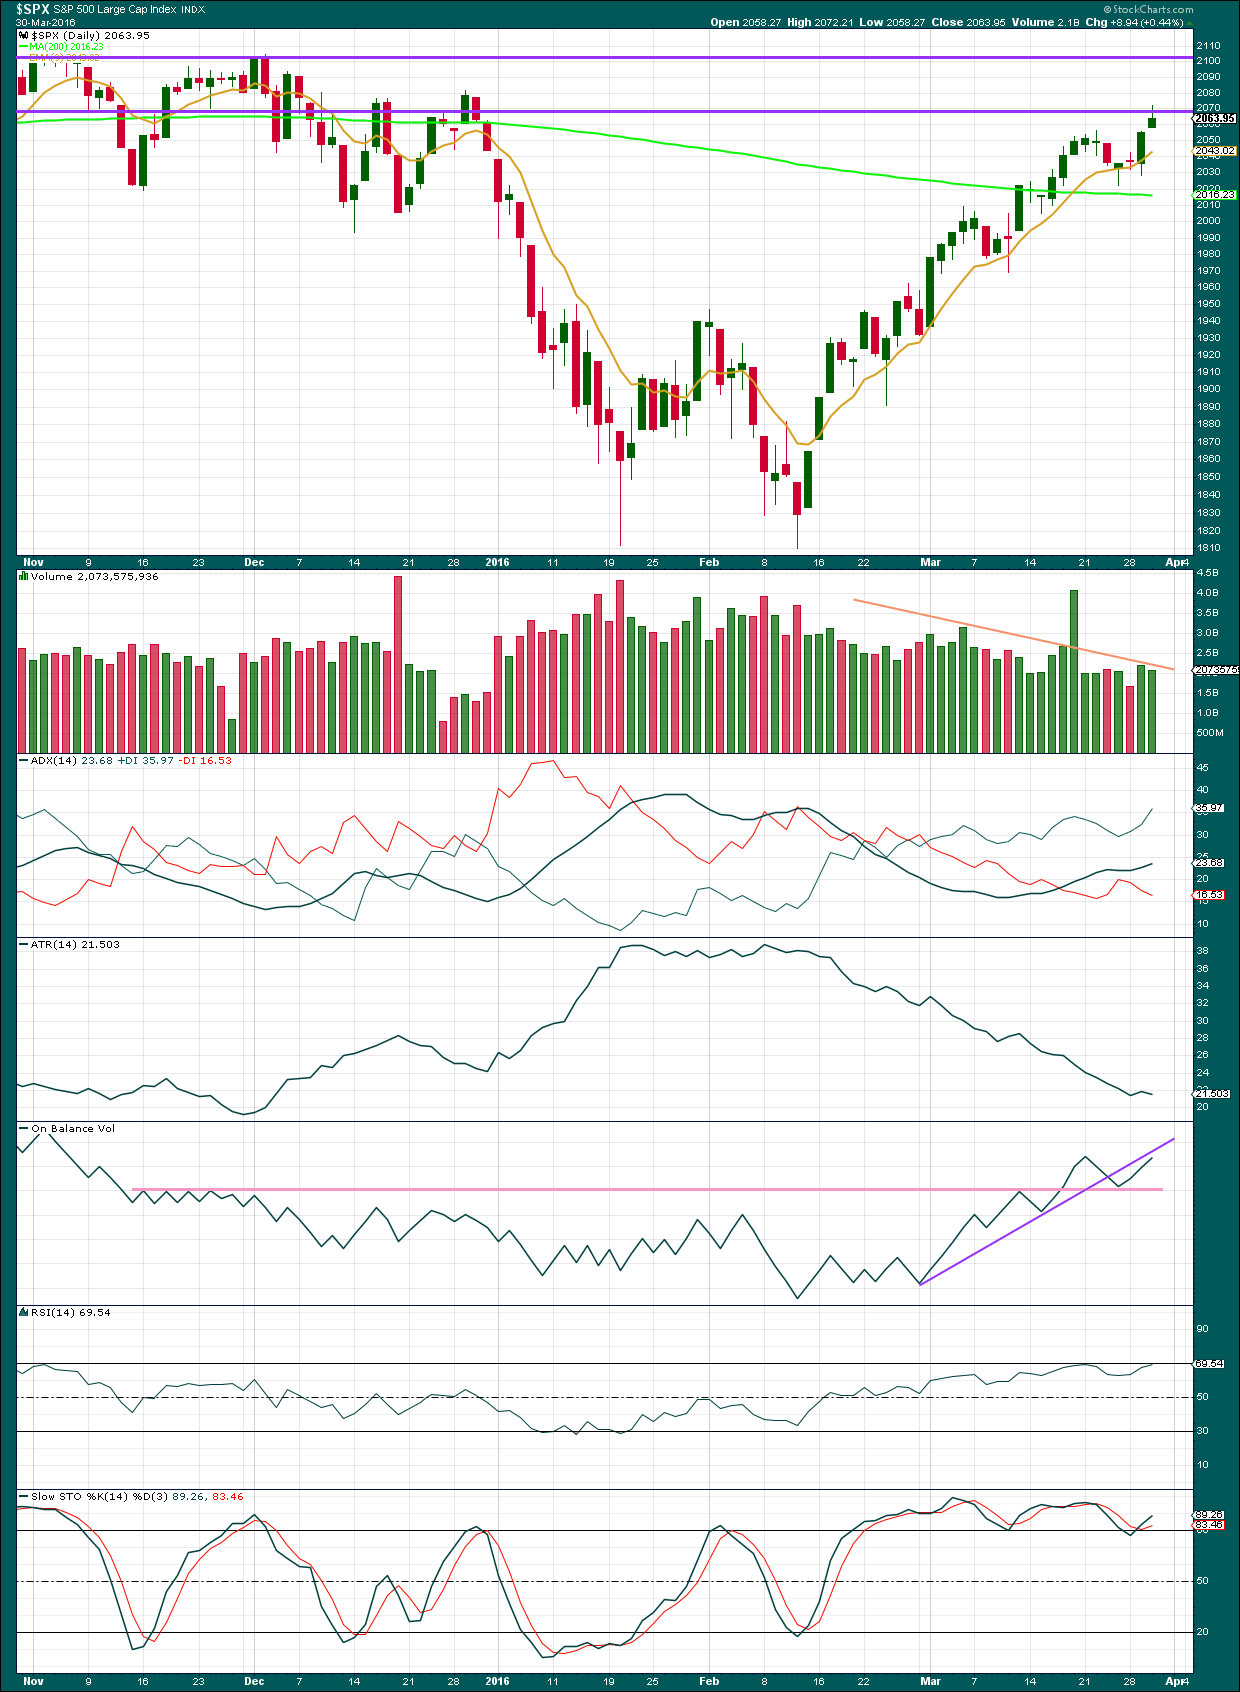
Click chart to enlarge. Chart courtesy of StockCharts.com.
Volume data on StockCharts is different to that given from NYSE, the home of this index. Comments on volume will be based on NYSE volume data when it differs from StockCharts.
Another upwards day this time comes with slightly declining volume. The rise in price is again not supported by volume. This indicates further weakness in price. It does not mean tomorrow must move lower though; the example of 1st and 2nd March shows it can be followed by more upwards movement.
Overall, it is becoming clear that as price rises volume declines (orange trend line on volume, ignoring the options expiry date).
ADX is increasing, indicating the market is trending.
ATR still disagrees. Normally, during a trending market ATR increases but here is persistently declining. There is something wrong with this trend; it is not normal.
On Balance Volume has bounced up from the pink trend line which is highly technically significant. This bounce is bullish. OBV may find resistance at the purple line, but this line has little technical significance.
RSI now shows divergence with price. RSI failed to make corresponding highs as price made new highs today. This indicates weakness in price. This signal often comes before a trend change, but it may persist for a little while. Sometimes double divergence is seen before a trend change. This indicator is not signalling price must turn here, but it is warning of an approaching reversal.
Stochastics is overbought, but this oscillator may remain extreme for periods of time during a trending market. Stochastics also exhibits bearish divergence with price today.
INVERTED VIX DAILY CHART
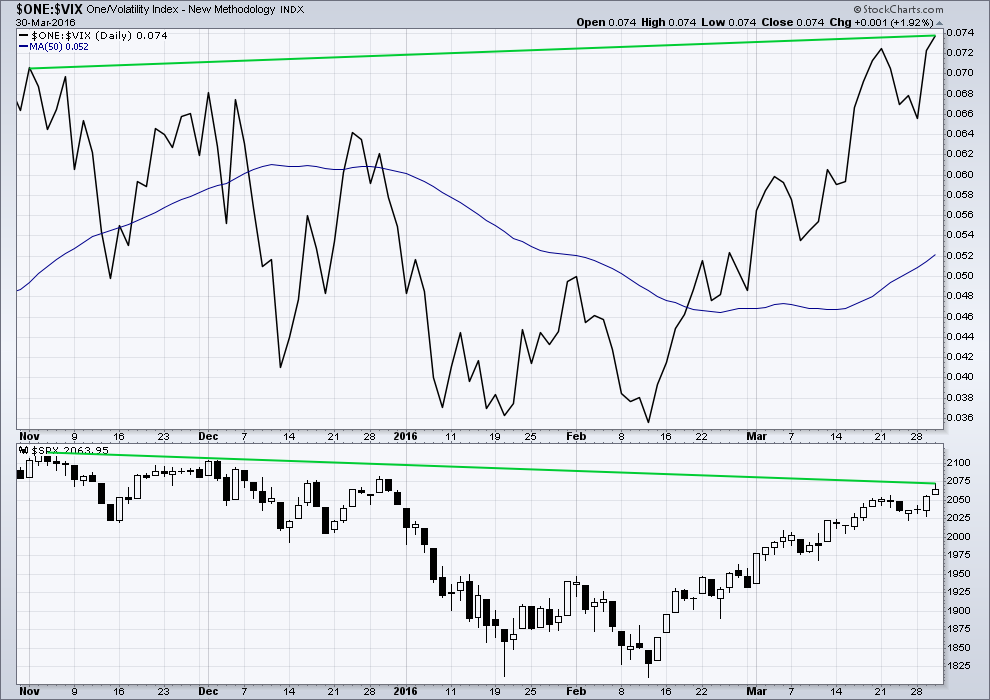
Click chart to enlarge. Chart courtesy of StockCharts.com.
Volatility declines as inverted VIX climbs. This is normal for an upwards trend.
What is not normal here is the divergence over a reasonable time period between price and inverted VIX. The decline in volatility is not translating to a corresponding increase in price. Price is weak. This divergence is bearish.
BULLISH PERCENT DAILY CHART
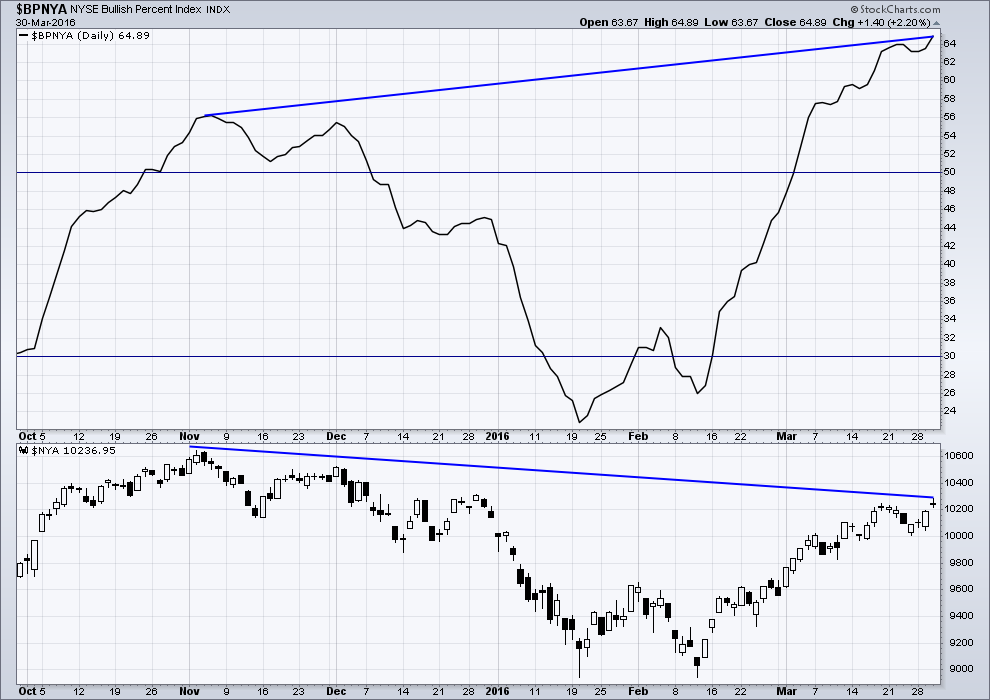
Click chart to enlarge. Chart courtesy of StockCharts.com.
There is strong hidden bearish divergence between price and the Bullish Percent Index. The increase in the percentage of bullish traders is more substantial than the last high in price. As bullish percent increases, it is not translating to a corresponding rise in price. Price is weak.
This looks like an overabundance of optimism which is not supported by price.
ADVANCE DECLINE LINE
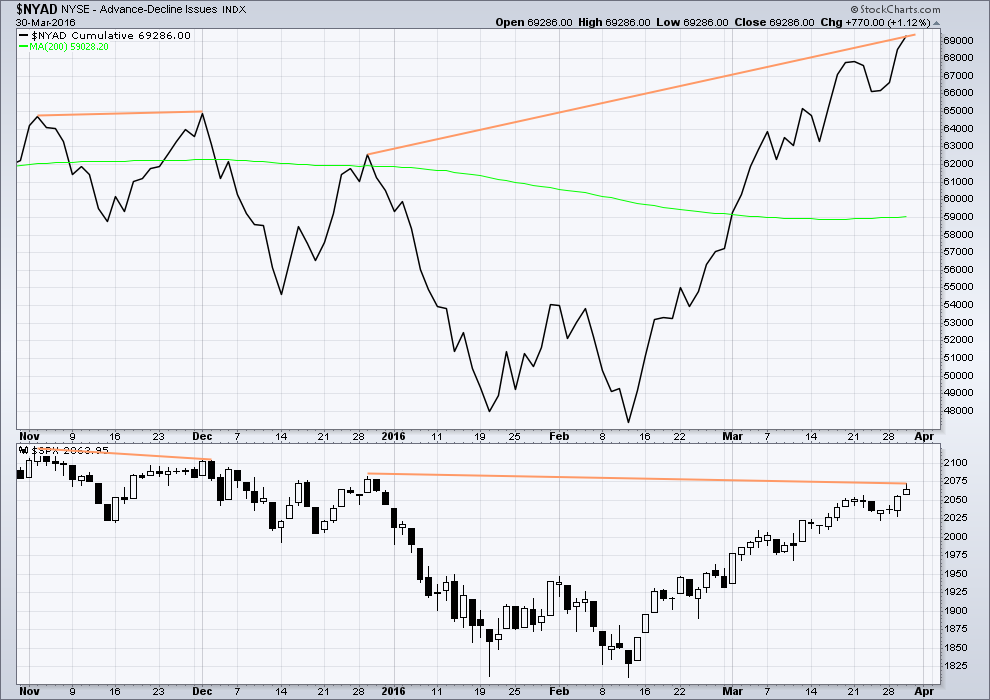
Click chart to enlarge. Chart courtesy of StockCharts.com.
The Advance Decline line shows no short term (day to day basis) divergence with price. With the AD line increasing, this indicates the number of advancing stocks exceeds the number of declining stocks. This indicates that there is breadth to this upwards movement.
Longer term, looking back over the last five months, there are two cases of hidden bearish divergence between price and the AD line.
From November 2015 to December 2015 the AD line made a new high while price failed to make a corresponding high. This indicated weakness in price and preceded new lows for price.
Now again from 29th December, 2015, to now the AD line is making new highs but price has so far failed to also make corresponding new highs. This again is an indication of weakness in price. Despite price rising with market breadth increasing, the breadth increase is not translating to substantial rises in price.
It remains to be seen if price can make new highs beyond the prior highs of 29th December, 2015. If price can manage to do that, then this hidden bearish divergence will no longer be correct, but the fact that it is so strong at this stage is significant. The AD line will be watched daily to see if this bearish divergence continues or disappears.
The 200 day moving average for the AD line is now flat. Even if the 200 day MA points up this alone would not be enough to indicate a new bull market. During November 2015 the 200 day MA for the AD line turned upwards and yet price still made subsequent new lows.
DOW THEORY
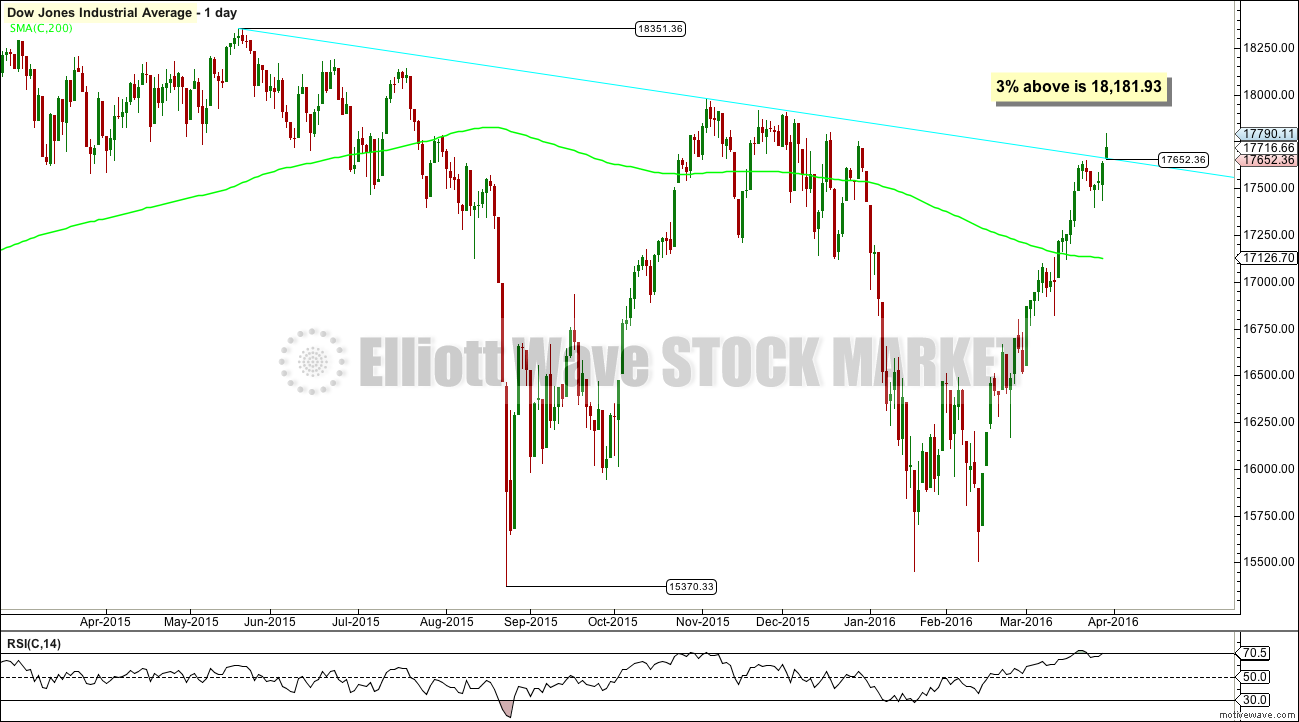
Click chart to enlarge.
The Dow Industrials broke above its bear market trend line today. If price closes 3% or more above this trend line, calculated at 18,181.93, then this index would be indicating a new bull market. This would require confirmation by DJI and SPX at least.
I am choosing to use the S&P500, Dow Industrials, Dow Transportation, Nasdaq and the Russell 2000 index. Major swing lows are noted below. So far the Industrials, Transportation and Russell 2000 have made new major swing lows. None of these indices have made new highs.
I am aware that this approach is extremely conservative. Original Dow Theory has already confirmed a major trend change as both the industrials and transportation indexes have made new major lows.
At this stage, if the S&P500 and Nasdaq also make new major swing lows, then my modified Dow Theory would confirm a major new bear market. At that stage, my only wave count would be the bear wave count.
The lows below are from October 2014. These lows were the last secondary correction within the primary trend which was the bull market from 2009.
These lows must be breached by a daily close below each point.
S&P500: 1,821.61
Nasdaq: 4,117.84
DJIA: 15,855.12 – close below on 25th August 2015.
DJT: 7,700.49 – close below on 24th August 2015.
Russell 2000: 1,343.51 – close below on 25th August 2015.
This analysis is published @ 11:06 p.m. EST.
Well I will take luck over skill any day. Today I placed an order for some weekly SPY calls right at the open based on Lara’s analysis and happened to get in at the bottom of that big downdraft.
So thank you both, Lara and Lady Luck!
There is starting to be quite a lot of talk in the blogosphere about FED incompetence-even from folk who have been generally quite supportive despite their trashing around on the subject of whether rate hike decisions are data dependent or not. It is a stark reminder that the survival of the fiat money scheme is wholly dependent on one thing- confidence of the masses….someone here mentioned Frau Yellen’s looking and sounding panicked and confused. Could it be that she is seeing the beginning of queries for which she has no credible response?
NYSE Advance/Decline count for today
A/D:1524/1177
Yesterday
Declining issues were 974
Wow… Boring!!!… Glad I have been out of town.
Interesting that volume is higher today than yesterday… Probably is meaningless.
632.739 Million Today
508.348 Million Yesterday
I think it’s meaningless in the short term outlook, in that it doesn’t mean price is going to turn here.
But it is more evidence of weakness in this upwards movement. We have seen it before on 29th Feb and 10th March, an increase in volume for a fall in price.
That shouldn’t be happening in conjunction with overall declining volume for a normal bull market. The volume profile looks more like a bear market rally.
I guess I’ll just have to hold those calls until tomorrow… huh? 🙂
Aw…come on bulls! Gimme a break on those calls will ya? 🙂
Minuette (iv) is continuing sideways / lower.
This structure still needs one more wave up to a new high to complete the impulse.
Minuette (iv) may not move into minuette (i) territory below 2,042.67. That is the short term invalidation point.
As soon as we see a new high above 2,072.21 the invalidation point can move back down to where I have it on the hourly chart, 2,022.49.
Actually, I’m thinking this small correction within the impulse may offer me a nice opportunity to add to my small buy position.
Smart move. Should give you a nice pop!
Not buying this initial move down- I still think its a head fake… 🙂
https://drive.google.com/file/d/0BzNyJOX-GIcOQjdXeHp6aVJiZEU/view?usp=sharing this is Marvin, our 3 month old Frenchy,, he loves to surf !
Hilarious! Thanks for sharing Doc
Smart doggy! The pooch’s got style! 🙂
OMG!
I’ve been crying all week (for varied reasons). This little guy has reminded me of the finer things in life…. at the very least, go for a ride, check out the view, hold your head up and put the wind in your face!
Thank you so much for sharing this with all of us.
Finally! Looks like break to the upside underway with volatility headed for yet another 52 week low. Open STC on my remaining bullish positions at SPX 2075 which should be met today…I am not looking for any kind of truncation under 2075 and if I see an impulse down before that target, I’m getting outta dodge… 😀
Oh Well…more paint drying…
No energy left in this market
I think one more move up. Trying to draw in a few suckers on the short side before the final thrust…VIX staying in the green on move up a dead giveaway we’re done…
I think it has to make one more move up to complete the impulse.
If it doesn’t, then this wave up is left as a three. Which means minor 4 continuing sideways as a flat or running triangle. But then it wouldn’t have such good alternation with minor 2 nor would it have good proportion.
The balance of probability is on one more move up to a new high.
Yep! One more move up to ice this cake…I think it will be sharp….
Waiting for the thrust from these triangle formations can be maddening. The objective is to wear you out while you wait… 🙂
If terminal the thrust should be to the upside. If it breaks to the downside it is probably a head-fake ahead of the final move up…
Looks like fourth wave continuing as some sort of triangle- yet again. Waiting patiently for a thrust to the upside to exit, hopefully followed by a swift reversal.
I am looking forward to the epic battle between banksters and the market if we get a powerful reversal. They will have to do a lot more than jawbone the market to the upside and it will be interesting to see the handiwork of the “working group” in the face of an impulse down at P3 degree.
As bearish as I am in my outlook, there are few things that can happen on the next decline that would give me pause in that conviction, certainly so with respect to the start of a primary third wave down. So far, every anticipated third wave decline left me with a feeling of nagging doubt and unease as a result of the rather tentative, even “managed” quality of the decline, as opposed to the runaway train, take-no-prisoners momentum we generally associate with a third wave decline. Since the current expected decline is at a higher degree than any previous expected one, the manner in which it unfolds will I think be even more paramount. If any of the following fail to happen, we may be forced to take another look at that bullish count and give the banksters their due in managing to prolong bullish sentiment.
1. Demolition of the 200 dma
2.Demolition of both 17000 and 16000 in DJI and 2000 and 1900 in SPX
3.A minimum of a 5% gap up open in volatility with a non-stop climb toward the upper BB on increasing volume.
One wise trader once told me that the market is always right, and does what it does, as opposed to what we think it ought to do.
For an intermediate impulsive one down at primary degree, if any one of the above conditions are not met, for me would be a huge cautionary flag, and warrant serious re-assessment of the immediate and mid-term bearish case.
Reminds me of the John Maynard Keynes quote:
“The market can remain irrational longer than you can remain solvent.”
You’re right to wait for solid evidence before jumping in with both feet. Although most of us believe the bearish case is nearly a certainty, the market may have other ideas.
I was looking at SDS calls and then backed away. Sure don’t need another asset decaying away while the market goes in the other direction. Hopefully there will be time to load up – when the probabilities look better.
Yep. We will recognize the real move down when it arrives. Anything other than a clean slice through the 200 dma is more pussyfooting around….still holding calls although they may expire worthless tomorrow….sold half so hedged with house money… 🙂
If this market moves back in the green before the close, you have a license to short the you-know-what out of it….
I’ve moved the target down on my buy to 2,081. I want to be out at the next high.
Lets see how good that target is. I’ll be asleep while the market makes its move.
My stop has been moved up above my entry, so no risk, and a small profit if I’m wrong.
No worries.
I too have a few SPY calls left in the arsenal and am hoping for at least one more pop to the upside prior to week’s end.
DJI is exhibiting a classic “throw-over” of that bear market trend-line. It is no doubt being observed by others. You gotta love the bluster of this primary two up – all dressed up and nowhere to go! It will be very interesting to see whether SPX divergent price action with respect to that line persists. This is starting to get very interesting indeed! 🙂
hey
Hey. Welcome back Doc
Yeah…we missed ya!