
Upwards movement was expected. Price made a new high prior to the last trading day and closed above the last open.
Summary: This is still a bear market rally until proven otherwise. A final fifth wave up is required to complete the structure. The target is 2,124. The invalidation point for this rally is 2,134.72.
To see last published monthly charts click here.
To see how each of the bull and bear wave counts fit within a larger time frame see the Grand Supercycle Analysis.
To see detail of the bull market from 2009 to the all time high on weekly charts, click here.
New updates to this analysis are in bold.
BEAR ELLIOTT WAVE COUNT
WEEKLY CHART
Click chart to enlarge.
This bear wave count fits better than the bull with the even larger picture, super cycle analysis found here. It is also well supported by regular technical analysis at the monthly chart level.
Importantly, there is no lower invalidation point for this wave count. That means there is no lower limit to this bear market.
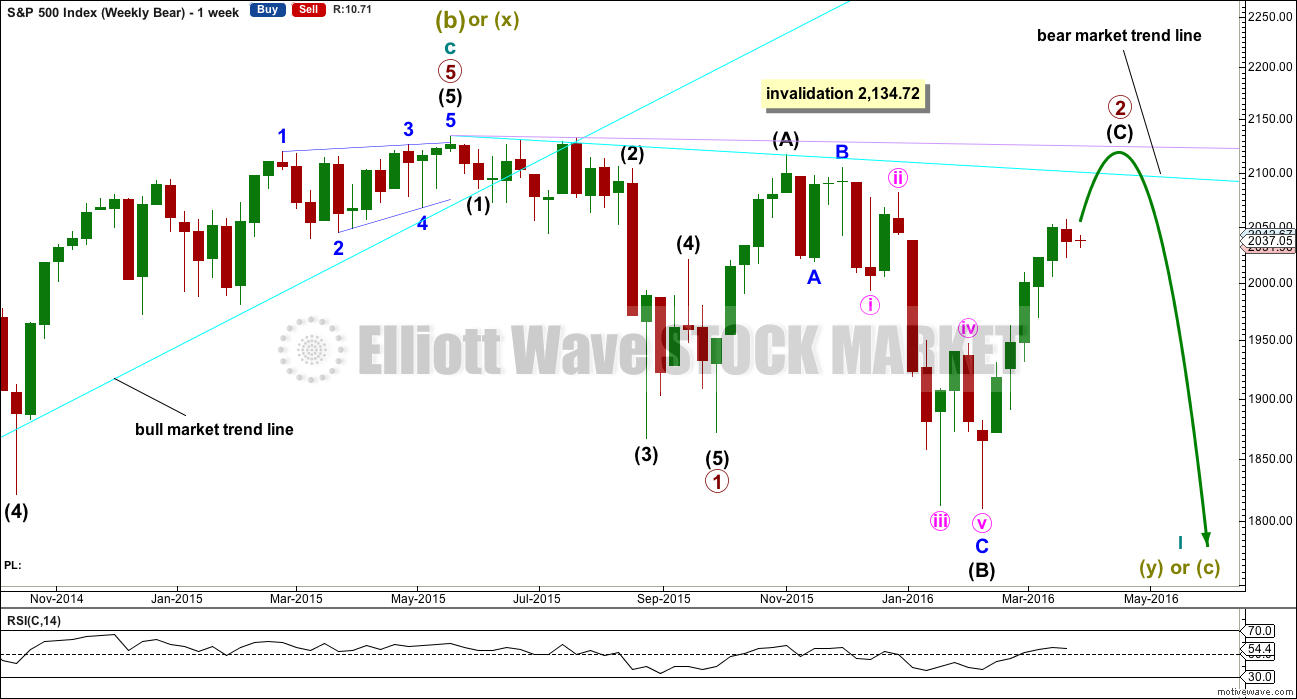
Primary wave 1 may be complete and may have lasted 19 weeks, two short of a Fibonacci 21. So far primary wave 2 is in its 24th week. It looks unlikely to continue for another 10 weeks to total a Fibonacci 34, so it may end in about two to five weeks time. This would still give reasonable proportion between primary waves 1 and 2. Corrections (particularly more time consuming flat corrections) do have a tendency to be longer lasting than impulses.
Primary wave 2 may be unfolding as an expanded or running flat. Within primary wave 2, intermediate wave (A) was a deep zigzag (which will also subdivide as a double zigzag). Intermediate wave (B) fits perfectly as a zigzag and is a 1.21 length of intermediate wave (A). This is within the normal range for a B wave of a flat of 1 to 1.38.
Intermediate wave (C) is likely to make at least a slight new high above the end of intermediate wave (A) at 2,116.48 to avoid a truncation and a very rare running flat. However, price may find very strong resistance at the final bear market trend line. This line may hold price down and it may not be able to avoid a truncation. A rare running flat may occur before a very strong third wave down.
If price moves above 2,116.48, then the new alternate bear wave count would be invalidated. At that stage, if there is no new alternate for the bear, then this would be the only bear wave count.
Primary wave 2 may not move beyond the start of primary wave 1 above 2,134.72.
DAILY CHART
Click chart to enlarge.
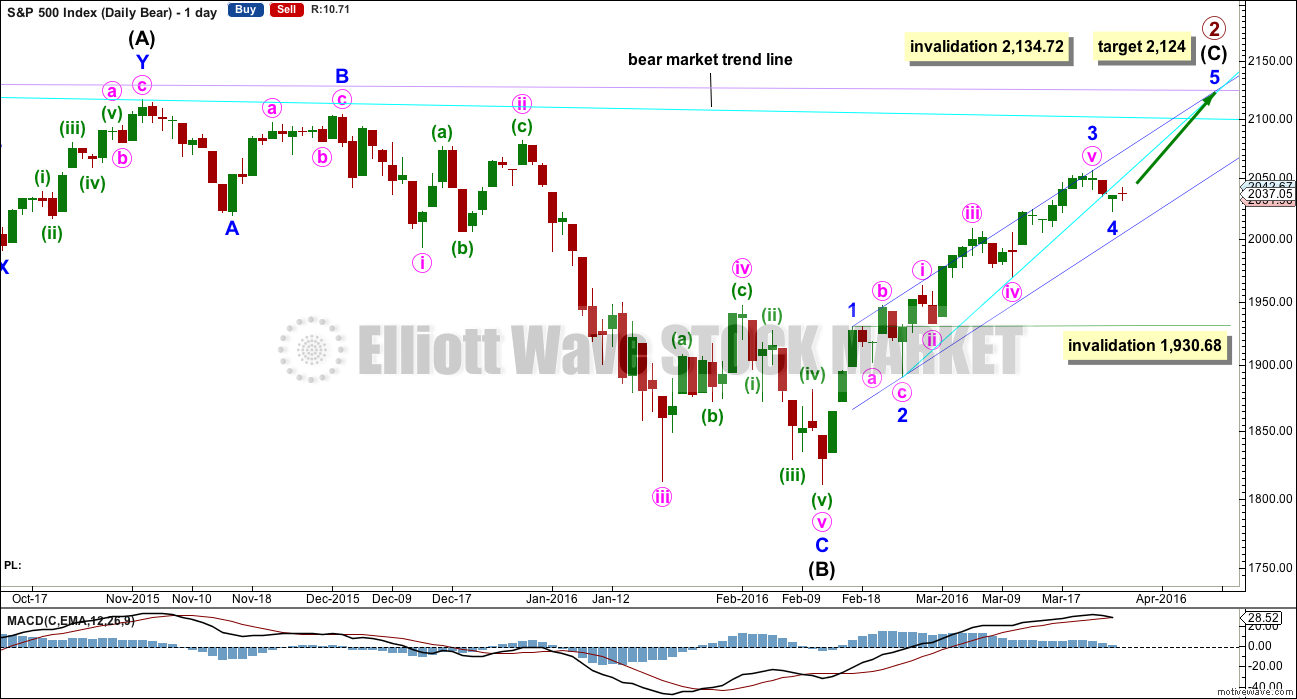
Intermediate wave (A) fits as a single or double zigzag.
Intermediate wave (B) fits perfectly as a zigzag. There is no Fibonacci ratio between minor waves A and C.
Intermediate wave (C) must subdivide as a five wave structure. It is not unfolding as an ending diagonal, so it must be unfolding as a more common impulse.
Intermediate wave (C) does not have to move above the end of intermediate wave (A) at 2,116.48, but it is likely to do so to avoid a truncation. If it is truncated and primary wave 2 is a rare running flat, then the truncation is not likely to be very large. As soon as price is very close to 2,116.48 this wave count looks at the possibility of a trend change.
The next wave down for this wave count would be a strong third wave at primary wave degree.
A bull market trend line for this rally is drawn across the first two small swing lows as per the approach outlined by Magee. This upwards sloping cyan line may provide support for corrections along the way up. Price broke below the cyan line today. It may now provide resistance. The S&P has a tendency to break out of channels or below lines and then continue in the prior direction. It may do this again here.
At 2,124 minor wave 5 would reach 0.618 the length of minor wave 3. Intermediate wave (C) would avoid a truncation and the wave count would remain valid. Primary wave 2 would fulfill its purpose of convincing everyone that a new bull market is underway, and it would do that right before primary wave 3 surprises everyone.
If it continues lower, then minor wave 4 downwards may not move into minor wave 1 price territory below 1,930.68.
The cursory count is now nine within intermediate wave (C). This is impulsive. Intermediate wave (C) could be counted as a complete impulse. However, if this wave count is correct to see intermediate wave (C) over here, it would require a massive truncation of 59.88 points. For an intermediate degree wave, this would have an exceptionally low probability. The probability is so low it should not be considered.
HOURLY CHART
Click chart to enlarge.
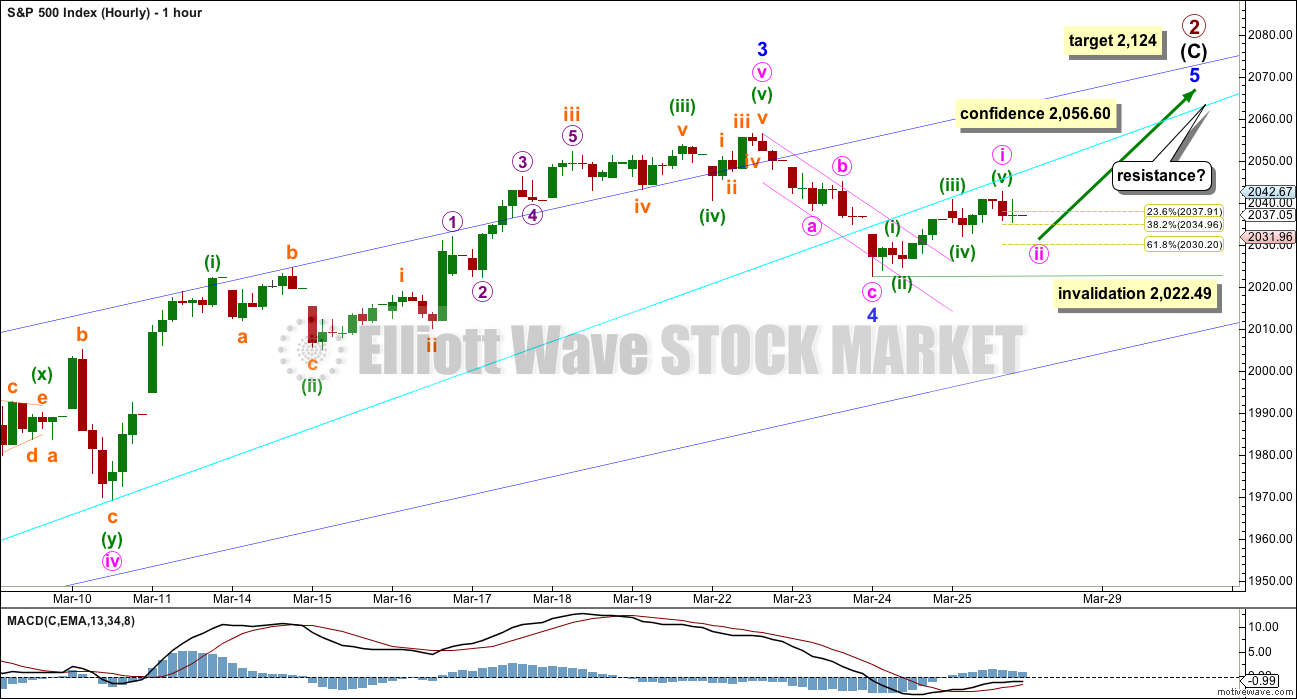
A new high above 2,038.21 (the end of minute wave a within minor wave 4) indicates that the last wave down labelled minor wave 4 is complete and fits best as a three.
With a three wave structure down more confidence may be had that the upwards trend remains intact.
At 2,124 minor wave 5 would reach 0.618 the length of minor wave 3.
So far upwards movement seems to be finding resistance at the cyan trend line copied over from the daily chart. This may continue.
Within minor wave 5, minute wave i fits as a five wave impulse and may be complete. Minute wave ii may not move below the start of minute wave i at 2,022.49.
A new high above 2,056.60 would add further confidence to the wave count. At that stage, the probability of minor wave 4 continuing further as a double zigzag would be very low.
ALTERNATE WEEKLY CHART
Click chart to enlarge.
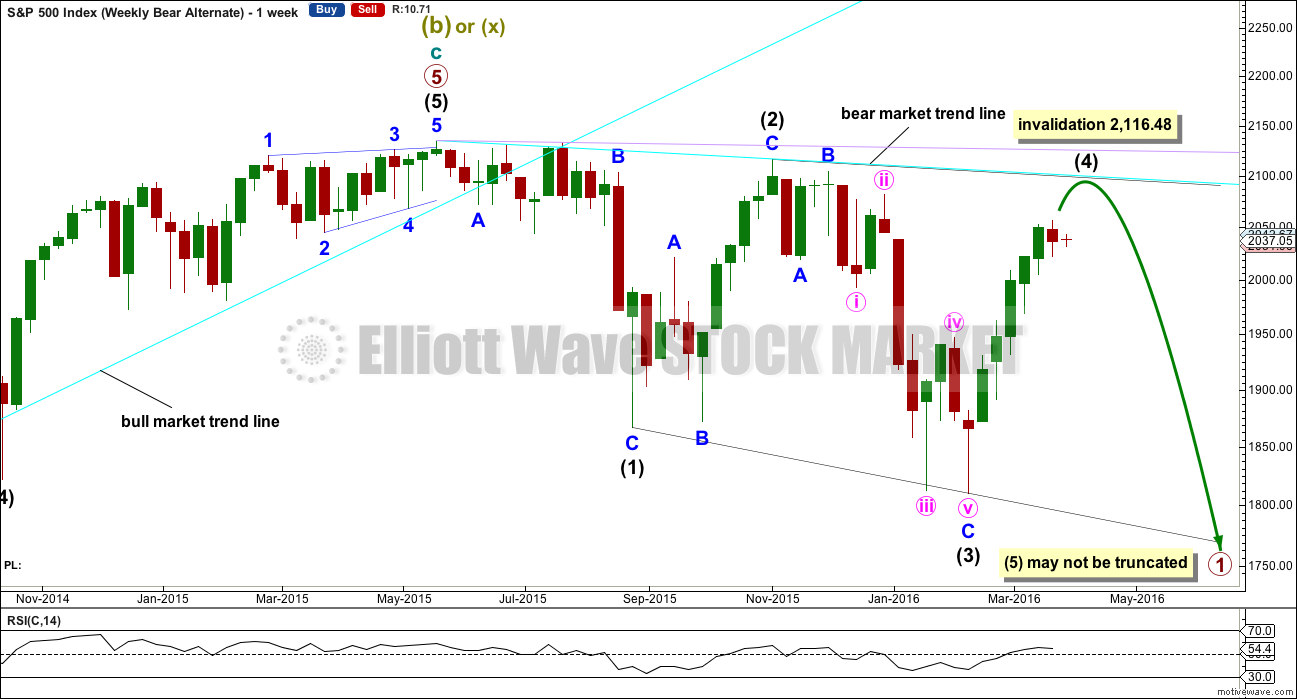
Primary wave 1 may subdivide as one of two possible structures. The main bear count sees it as a complete impulse. This alternate sees it as an incomplete leading diagonal.
The diagonal must be expanding because intermediate wave (3) is longer than intermediate wave (1). Leading expanding diagonals are not common structures, so that reduces the probability of this wave count to an alternate.
Intermediate wave (4) must continue higher and may find resistance at the cyan bear market trend line. Intermediate wave (4) may not move above the end of intermediate wave (2) at 2,116.48.
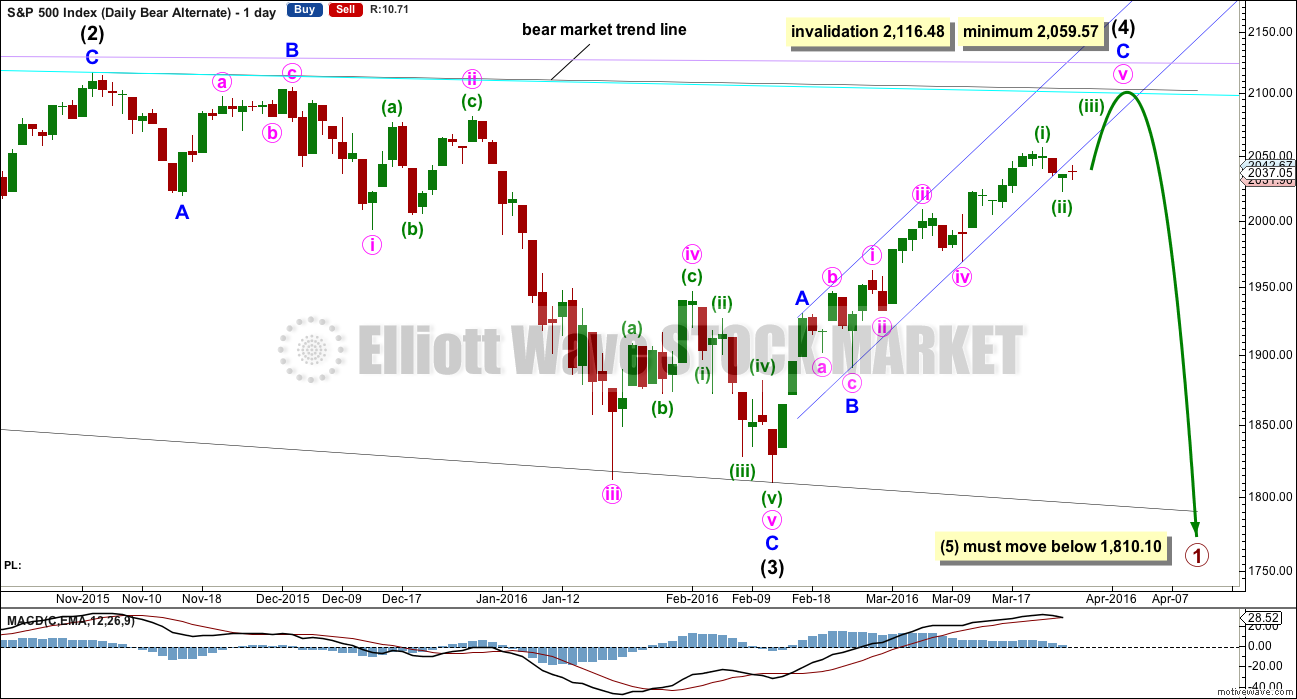
ALTERNATE DAILY CHART
Click chart to enlarge.
Within a leading diagonal, subwaves 2 and 4 must subdivide as zigzags. Subwaves 1, 3 and 5 are most commonly zigzags but may also sometimes appear to be impulses.
Intermediate wave (3) down fits best as a zigzag.
In a diagonal the fourth wave must overlap first wave price territory. The rule for the end of a fourth wave is it may not move beyond the end of the second wave.
Expanding diagonals are not very common. Leading expanding diagonals are less common.
Intermediate wave (4) must be longer than intermediate wave (2), so it must end above 2,059.57. If this minimum is not met, this wave count would be invalid. The trend lines must diverge.
Leading diagonals may not have truncated fifth waves. Intermediate wave (5) would most likely be a zigzag, must end below 1,810.10, and must be longer in length than intermediate wave (3) which was 306.38 points.
BULL ELLIOTT WAVE COUNT
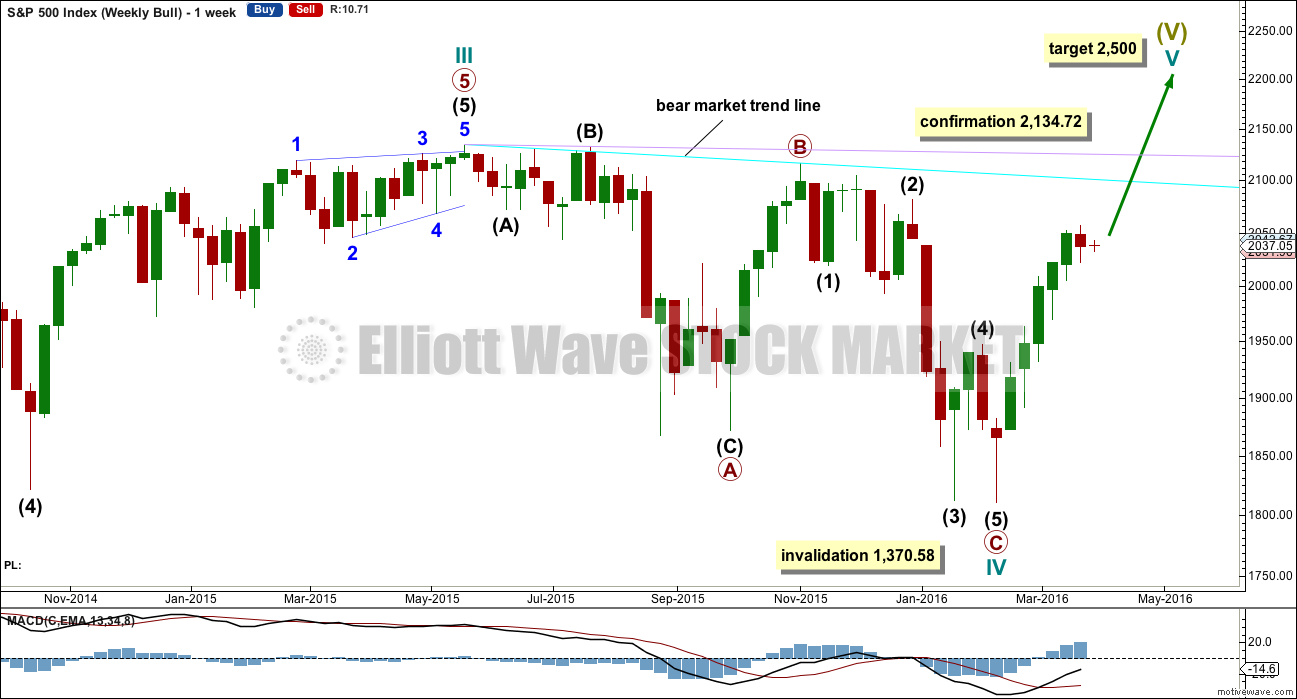
WEEKLY CHART
Click chart to enlarge.
Cycle wave II was a shallow 0.41 zigzag lasting three months. Cycle wave IV may be a complete shallow 0.19 regular flat correction, exhibiting some alternation with cycle wave II.
At 2,500 cycle wave V would reach equality in length with cycle wave I.
Price remains below the final bear market trend line. This line is drawn from the all time high at 2,134.72 to the swing high labelled primary wave B at 2,116.48 on November 2015. This line is drawn using the approach outlined by Magee in the classic “Technical Analysis of Stock Trends”. To use it correctly we should assume that a bear market remains intact until this line is breached by a close of 3% or more of market value. In practice, that price point would be a new all time high which would invalidate any bear wave count.
This wave count requires price confirmation with a new all time high above 2,134.72.
While price has not made a new high, while it remains below the final bear market trend line and while technical indicators point to weakness in upwards movement, this very bullish wave count comes with a strong caveat. I do not have confidence in it.
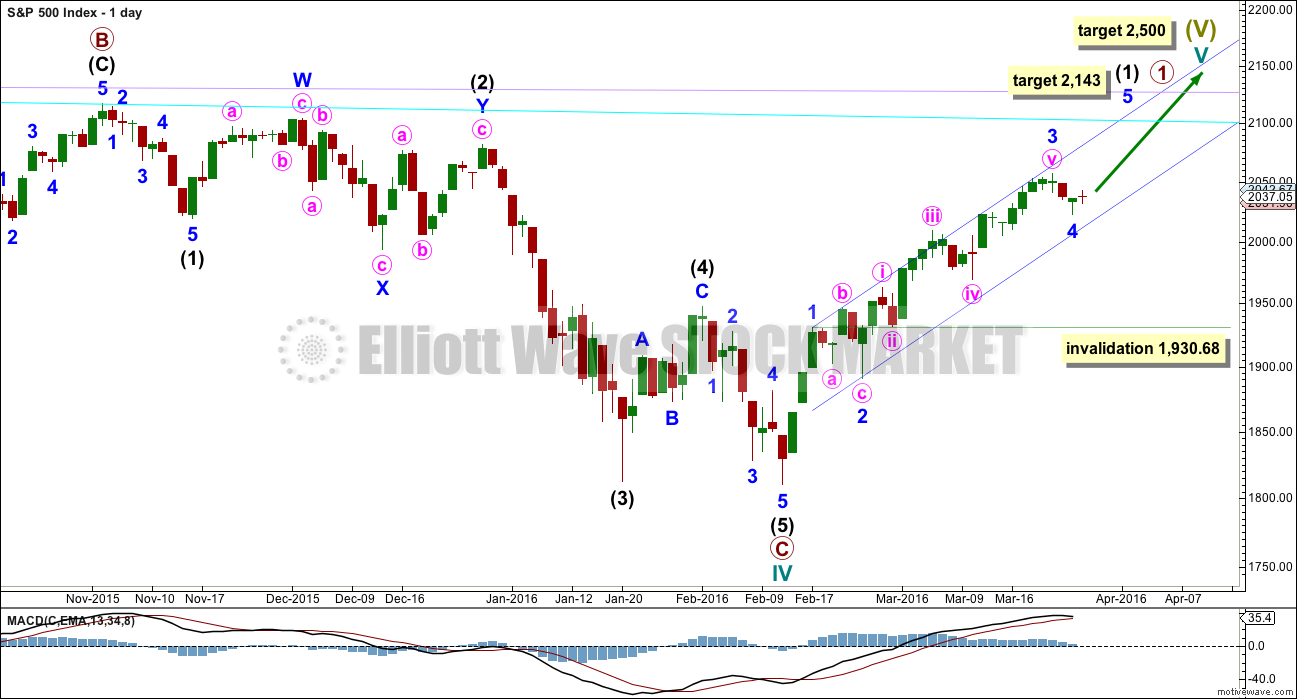
DAILY CHART
Click chart to enlarge.
Upwards movement cannot now be a fourth wave correction for intermediate wave (4) as price is now back up in intermediate wave (1) territory above 2,019.39. This has provided some clarity.
For the bullish wave count, it means that primary wave C must be over as a complete five wave impulse.
Intermediate wave (2) is seen as an atypical double zigzag. It is atypical in that it moves sideways. Double zigzags should have a clear slope against the prior trend to have the right look. Within a double zigzag, the second zigzag exists to deepen the correction when the first zigzag does not move price deep enough. Not only does this second zigzag not deepen the correction, it fails to move at all beyond the end of the first zigzag. This structure technically meets rules, but it looks completely wrong. This gives the wave count a low probability.
If the bull market has resumed, it must begin with a five wave structure upwards at the daily and weekly chart level. So far that is incomplete.
Downwards movement may not be a lower degree correction within minute wave v because it is in price territory of the first wave within minute wave v. This downwards movement must be minor wave 4. At 2,143 minor wave 5 would reach equality in length with minor wave 1.
Minor wave 4 may not move into minor wave 1 price territory below 1,930.68.
TECHNICAL ANALYSIS
DAILY CHART
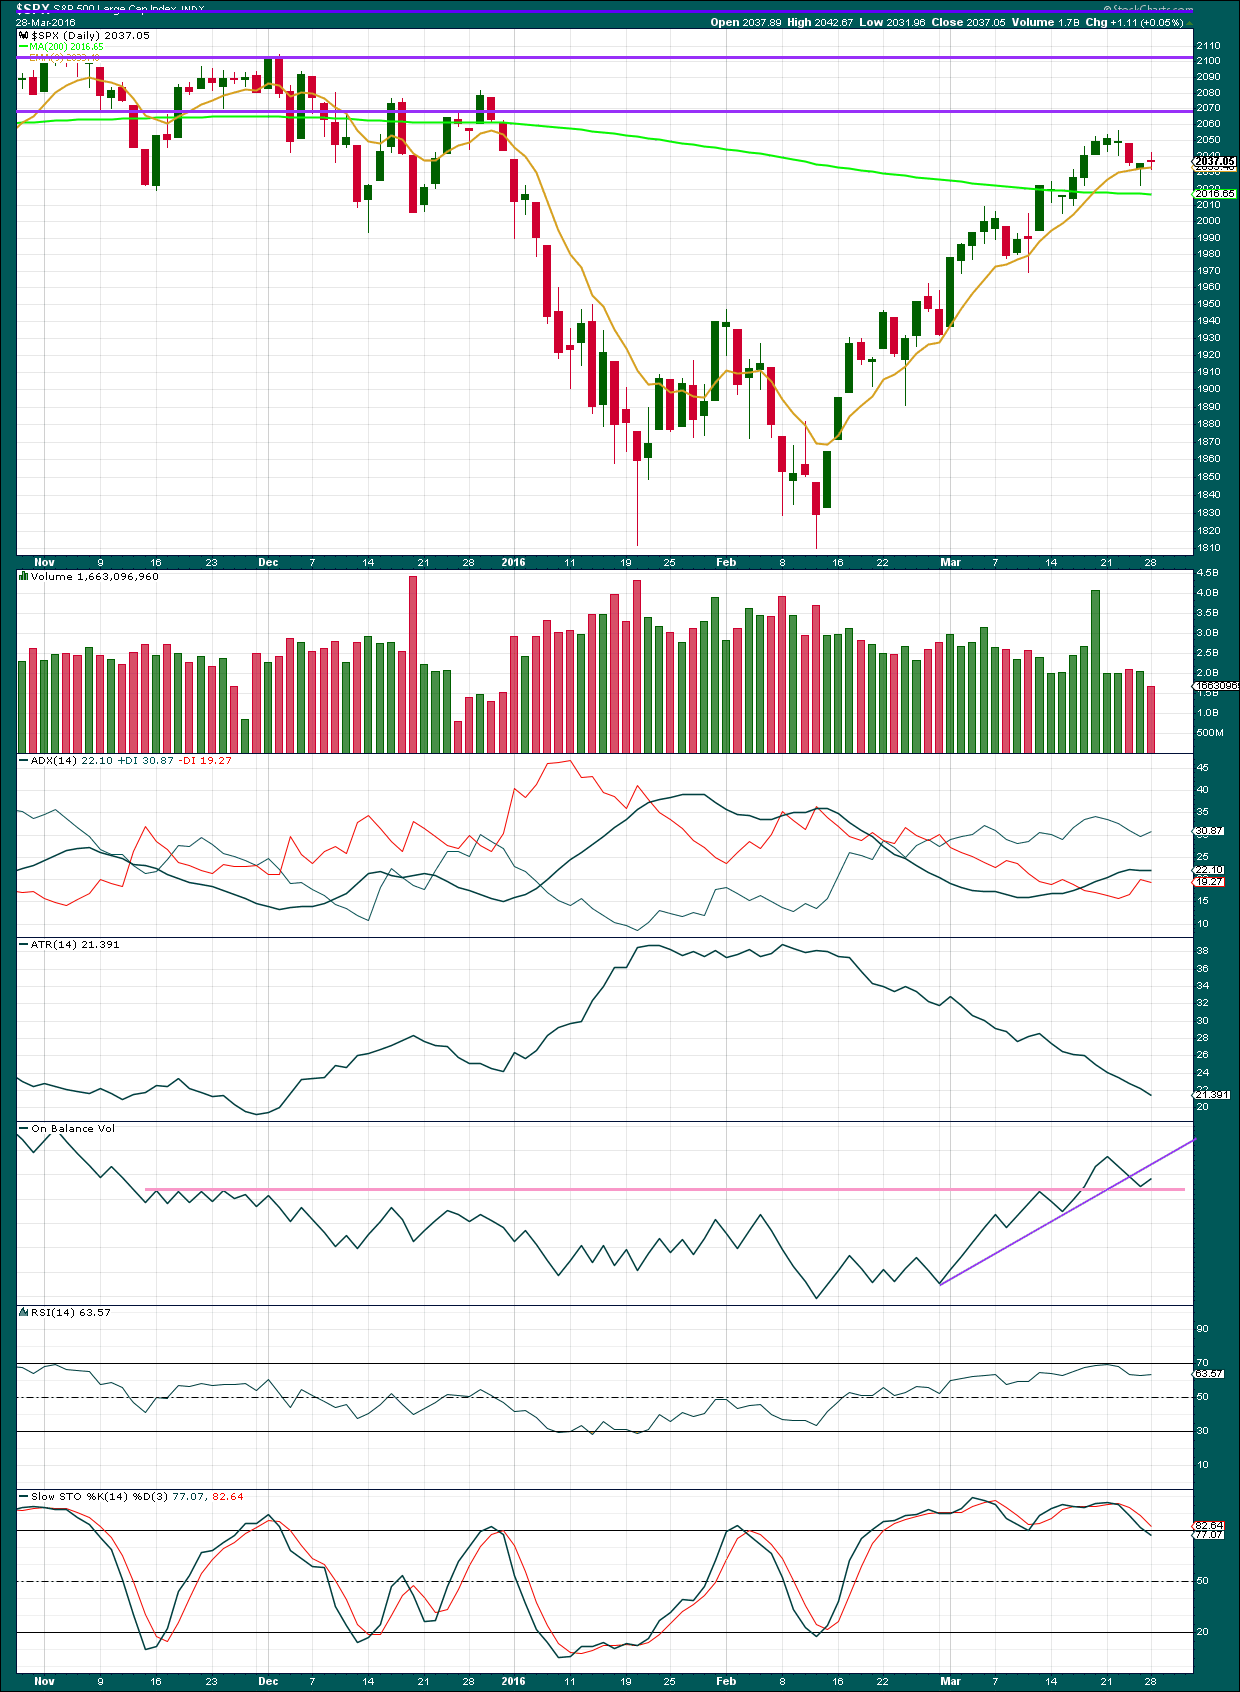
Click chart to enlarge. Chart courtesy of StockCharts.com.
Volume data on StockCharts is different to that given from NYSE, the home of this index. Comments on volume will be based on NYSE volume data when it differs from StockCharts.
Price made a new high above the prior day and closed higher then the prior day’s open. Overall, volume is decreasing, probably more due to the Easter holiday weekend than any other factor.
It looks like price may be finding some support about the 9 day moving average.
ADX is flat indicating no clear trend. ATR agrees as it is declining.
On Balance Volume found support at the pink trend line, so the strength of this line is reinforced. This line is still close by, so any more downwards movement from price should be shallow and short lived as OBV should again find strong support at the pink line. This line is horizontal, long held and repeatedly tested.
RSI is not extreme and Stochastics is returning from overbought. There is room for price to fall or again to rise. I would not give too much weight to Stochastics, particularly if ADX again turns upwards. Only when RSI shows overbought and then divergence with price would I expect to see an end to upwards movement. That has not happened yet.
Since the all time high in 20th May, 2015, price has made a series of lower highs and lower lows. Price broke below a long held bull market trend line indicating a new bear market. The 200 day moving average slowly turned from increasing to decreasing. Price remains below the bear market trend line drawn on the Elliott wave charts. All these technical indicators still point to price being in a bear market currently.
If price closes 3% or more of market value above the bear market trend line, then the analysis will change from bearish to bullish. While this has not happened, it should be assumed that the trend remains the same until proven otherwise.
ADVANCE DECLINE LINE
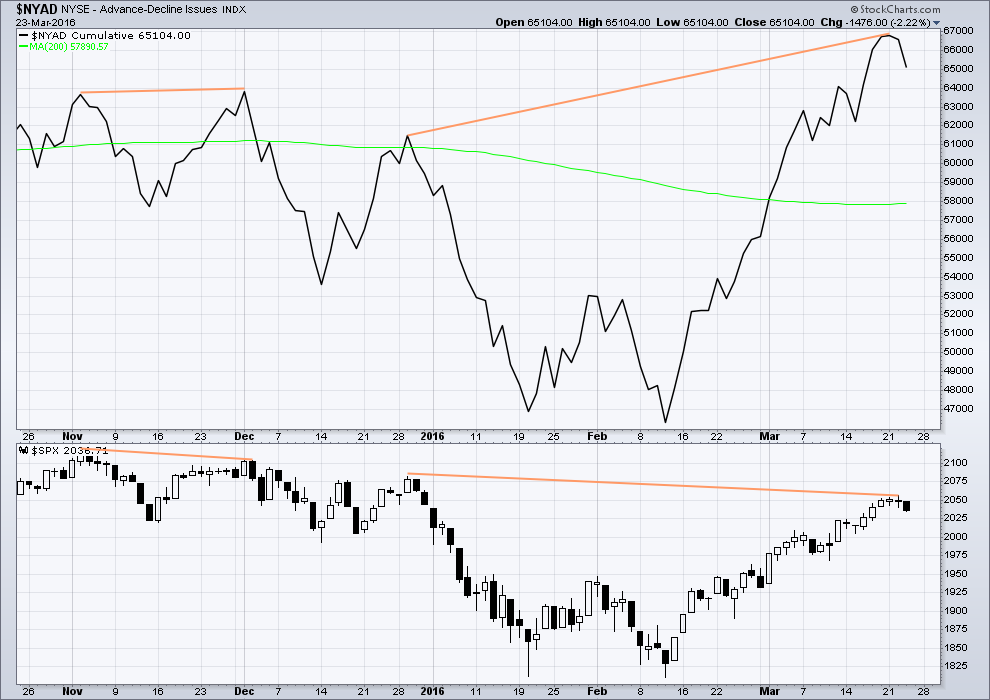
Click chart to enlarge. Chart courtesy of StockCharts.com.
The Advance Decline line shows no short term (day to day basis) divergence with price. With the AD line increasing, this indicates the number of advancing stocks exceeds the number of declining stocks. This indicates that there is breadth to this upwards movement.
Longer term, looking back over the last five months, there are two cases of hidden bearish divergence between price and the AD line.
From November 2015 to December 2015 the AD line made a new high while price failed to make a corresponding high. This indicated weakness in price and preceded new lows for price.
Now again from 29th December, 2015, to now the AD line is making new highs but price has so far failed to also make corresponding new highs. This again is an indication of weakness in price. Despite price rising with market breadth increasing, the breadth increase is not translating to substantial rises in price.
It remains to be seen if price can make new highs beyond the prior highs of 29th December, 2015. If price can manage to do that, then this hidden bearish divergence will no longer be correct, but the fact that it is so strong at this stage is significant. The AD line will be watched daily to see if this bearish divergence continues or disappears.
The 200 day moving average for the AD line is now increasing. Even if the 200 day MA points up this alone would not be enough to indicate a new bull market. During November 2015 the 200 day MA for the AD line turned upwards and yet price still made subsequent new lows.
DOW THEORY
I am choosing to use the S&P500, Dow Industrials, Dow Transportation, Nasdaq and the Russell 2000 index. Major swing lows are noted below. So far the Industrials, Transportation and Russell 2000 have made new major swing lows. None of these indices have made new highs.
I am aware that this approach is extremely conservative. Original Dow Theory has already confirmed a major trend change as both the industrials and transportation indexes have made new major lows.
At this stage, if the S&P500 and Nasdaq also make new major swing lows, then my modified Dow Theory would confirm a major new bear market. At that stage, my only wave count would be the bear wave count.
The lows below are from October 2014. These lows were the last secondary correction within the primary trend which was the bull market from 2009.
These lows must be breached by a daily close below each point.
S&P500: 1,821.61
Nasdaq: 4,117.84
DJIA: 15,855.12 – close below on 25th August 2015.
DJT: 7,700.49 – close below on 24th August 2015.
Russell 2000: 1,343.51 – close below on 25th August 2015.
This analysis is published @ 07:03 p.m. EST.
An interesting quote from a savvy trader I know- “This is not a thinking man’s market”. His advice on the market action, and he admits to being bearish and expecting the market to decline, is to not anticipate, but rather participate (kinda what Lara was suggesting). He opines that “everyone” is expecting the market to sell off so that is why it probably won’t, at least not immediately. I don’t know if I agree with the “everyone” assessment, unless he is referring mostly to active traders. The crowd certainly seems to be fairly optimistic at least in the very short term, so it will be very interesting to see what shape the market’s eventual reversal takes- slow and stately, or sudden and scary? FED statements have often be synonymous with market tops so it will be interesting to see if that tradition holds. This week does sport some positive seasonal bias with the beginning of a new month and the correction most likely has some more room to run.
I think I will send EWI another e-mail thanking you-know-who for being such a perfect contrarian indicator! It’s really is amazing how they always seem to be on the wrong side of these pivotal wave counts. I think we have even more evidence today to bolster the case for a primary two up. I sure hope no one entered short on that “hours away” prediction of a market reversal…I am going to suggest they hire Lara as a consultant…. 😀
FED chair Yellen sounded more panicked and lost. Maybe I misread it but if employment is all time high and growth is occurring why put on hold the. Interest rate hike?
I think FED has lost its control and ar simply pleasing the markets.
While this market is boring, it is relatively easy to profit from. As long as we’re careful, a primary degree third wave is still in the wings.
But it’s not here yet. So we may as well profit from this uptrend.
Yes ma’am! Thanks to you for again getting the wave count correct. I am happily scalping away on this final move up and look forward to cashing in some more SPY calls. Nice fat candles all around suggest more upside to come. 🙂
Backing up the truck on volatility. Yahoo! Don’t see these opportunities very often. Selling half my SPY calls and waiting to see if we convincingly take out the 2050 pivot. If we do, 2075 will be next. I don’t think we make it to 2100.00 It sure would be nice to see minute four by day’s end. 🙂
Hi Verne,
Perpetual student here. I am following along and trying to figure out the count as we go. Thanks for your posts today.
The only question is, how long before the crowd figures that out…. 🙂
I recently learned that a bunch of pension funds, including Sequoia, had lots of Valeant shares in their portfolio. Apparently Sequoia had as much as 30% of their money in that ticking time bomb. I had no idea that Valeant was in the business of issuing bonds…who knew?
Most welcome!…and here I was thinking I was all by my lonesome watching the action today… 🙂
Vern-was the takeout of 2050 convincing?
I think so. Price move through it fairly smoothly. There seems to be some consolidation just a bit above but I think Lara’s count and target is right on the money. We may even see some acceleration upwards the next few days as excitement takes hold and price heads for the 2100 round number pivot. MACD rolling over though so we need to pay close attention.
Vern-thanks.
If this is a third up at minute degree, it really needs to take out 2050 and I mean in the next hour. If UVXY prints a green before the close that’s all she wrote….
Looks like final wave up has at last arrived. Glad I held onto those SPY calls. Here comes a final opportunity to grab UVXY on sale…should reverse between 20 and 22. See ya’ll at the bottom… 🙂
UVXY after hours 19.80
UVXY should see a reversal around 19.71 based on the last 5 days trend otherwise 20.05 should provide the point of reversal. Let’s see what tomorrow brings.
Yep. There is probably massive short selling on the dovish FED news today. They will soon be covering. Already VIX call options a month out are selling for 10 to 15 times the price of put options at the same strike so traders are clearly willing to pay up big as they suspect what is coming next. This is what is sometimes so strange about how UVXY trades. As a VIX futures instrument, it technically should be a better gauge of medium term risk. Making new 52 week lows at the conclusion of a corrective primary wave 2 is one of those rare pricing anomalies in which the option buyers can really take the sellers to the cleaners…the next powerful gap up open will swiftly correct that… 🙂
Looks like minute two exceeded the 61.8 retracement by a couple points. I imagine we should be seeing minute three up start this session if it is going to arrive. The action does suggest one more pop to the upside….and probably a final UVXY visit to the sub 22 area…Yellen may help!
Transports sitting squarely on confluence of 200 dma and bottom of bull channel formed since the January 20 low. What it does next may signal what upside remains in the other senior indices.
We should see minor five up get going today if that count is correct, probably co-inciding with dovish commentary from Frau Yellen. Minor four is going to start looking a bit out of proportion to minor two with much further delay methinks.
Good evening! 🙂
Good evening to you too.
Ready for another paint drying session?
I’ve entered a small buy with a stop just below the last daily swing low at 2,019.55. Target 2,124. Lets see if that works.
Still holding a few SPY 204 strike hedging calls picked up last week. Steadily adding UVXY calls on the dips – its nice to have them go in the money same day! It looks like traders preparing for short term volatility as VIX marches higher. I expect the paint to continue drying for a few more days, or until we take out SPX 2000. *Yawn* 🙂