
Upwards movement was expected.
Price made a slight new low on another very small range quiet day.
Summary: The mid term trend is still most likely up. In the short term, a small fourth wave correction may continue sideways. When it is done the target for the next wave up is at 2,126. If this fourth wave moves lower, then the target must also move correspondingly lower. The invalidation point is now only at 1,930.68. A new low below that point would indicate a big third wave down is underway.
To see last published monthly charts click here.
To see how each of the bull and bear wave counts fit within a larger time frame see the Grand Supercycle Analysis.
To see detail of the bull market from 2009 to the all time high on weekly charts, click here.
If I was asked to pick a winner (which I am reluctant to do) I would say the bear wave count has a higher probability. It is better supported by regular technical analysis at the monthly chart level, it fits the Grand Supercycle analysis better, and it has overall the “right look”.
New updates to this analysis are in bold.
BULL ELLIOTT WAVE COUNT
WEEKLY CHART
Click chart to enlarge.
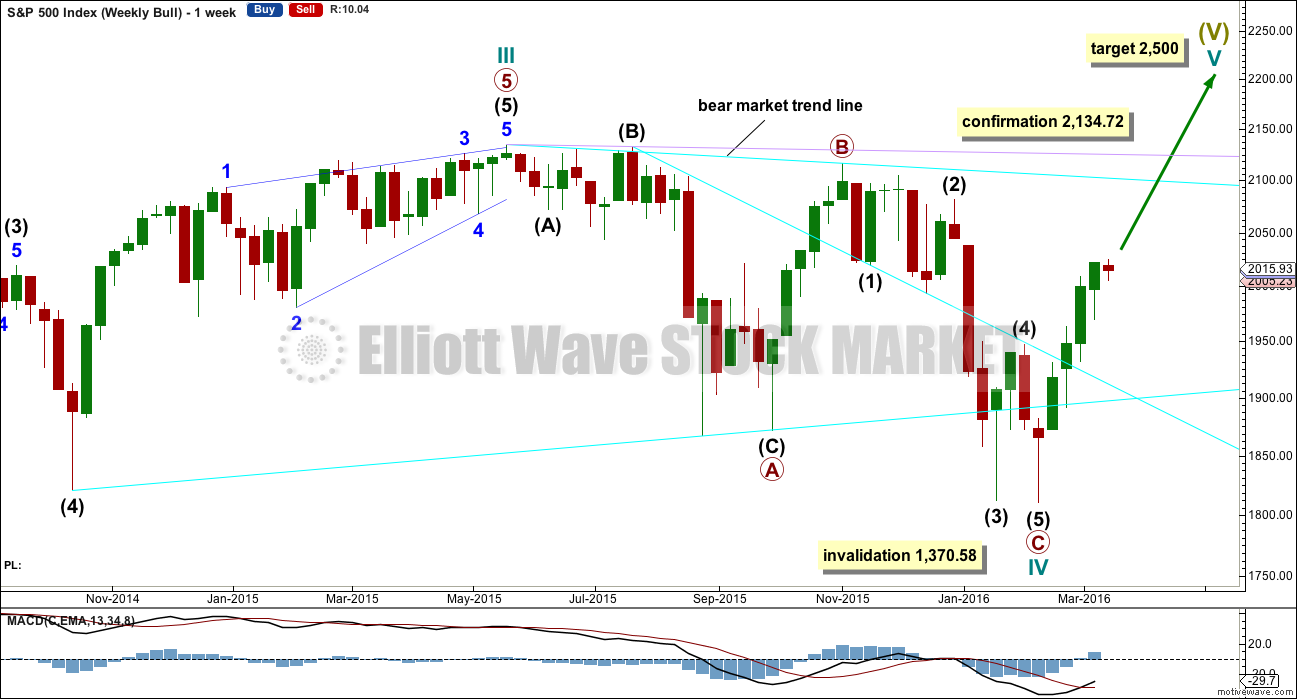
This wave count is bullish at Super Cycle degree.
If it continues any further, cycle wave IV may not move into cycle wave I price territory below 1,370.58. If this bull wave count is invalidated by downwards movement, then the bear wave count shall be fully confirmed.
Cycle wave II was a shallow 0.41 zigzag lasting three months. Cycle wave IV may be a complete shallow 0.19 regular flat correction, exhibiting some alternation with cycle wave II.
At 2,500 cycle wave V would reach equality in length with cycle wave I.
Price remains below the final bear market trend line. This line is drawn from the all time high at 2,134.72 to the swing high labelled primary wave B at 2,116.48 on November 2015. This line is drawn using the approach outlined by Magee in the classic “Technical Analysis of Stock Trends”. To use it correctly we should assume that a bear market remains intact until this line is breached by a close of 3% or more of market value. In practice, that price point would be a new all time high which would invalidate any bear wave count.
Another more conservative trend line is added today. If the Magee bear market trend line is drawn from the all time high to an earlier swing high labelled intermediate wave (B) on July 2015, then it sits higher up than the first cyan line. This lilac line may be the final line of resistance.
This wave count requires price confirmation with a new all time high above 2,134.72.
While price has not made a new high, while it remains below the final bear market trend line and while technical indicators point to weakness in upwards movement, this very bullish wave count comes with a strong caveat. I do not have confidence in it.
DAILY CHART
Click chart to enlarge.
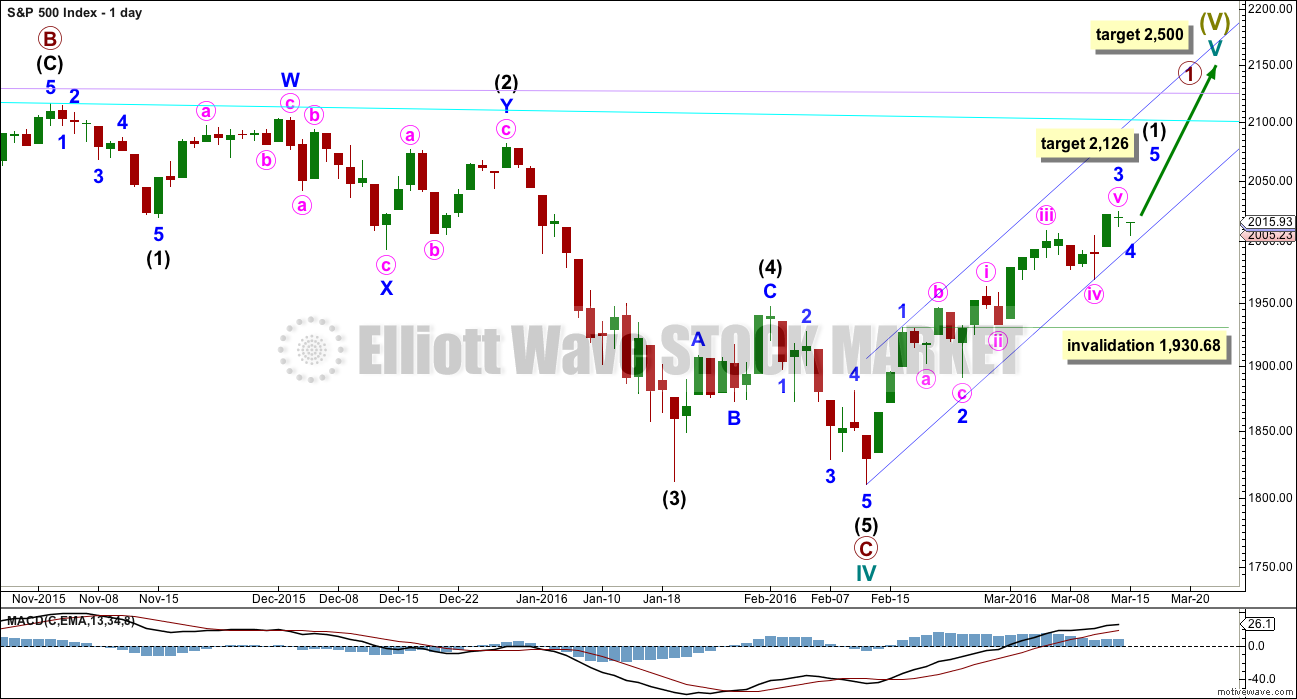
Upwards movement cannot now be a fourth wave correction for intermediate wave (4) as price is now back up in intermediate wave (1) territory above 2,019.39. This has provided some clarity.
For the bullish wave count, it means that primary wave C must be over as a complete five wave impulse.
Intermediate wave (2) is seen as an atypical double zigzag. It is atypical in that it moves sideways. Double zigzags should have a clear slope against the prior trend to have the right look. Within a double zigzag, the second zigzag exists to deepen the correction when the first zigzag does not move price deep enough. Not only does this second zigzag not deepen the correction, it fails to move at all beyond the end of the first zigzag. This structure technically meets rules, but it looks completely wrong. This gives the wave count a low probability.
If the bull market has resumed, it must begin with a five wave structure upwards at the daily and weekly chart level. So far that is incomplete.
With downwards movement for Tuesday’s session, it looks like minor wave 4 has arrived earlier than expected. Minor wave 3 did not reach the target and exhibits no Fibonacci ratio to minor wave 1. Minor wave 4 may not move into minor wave 1 price territory below 1,930.68.
Minor wave 4 may continue to move sideways before it is complete. If it moves any lower, then the target for minor wave 5 must also move correspondingly lower, so the target may change. At this stage, minor wave 5 would reach equality in length with minor wave 1 at 2,126.
Because I have so little confidence in this bullish wave count, an hourly chart will no longer be published for it. The structure would be the same as the alternate bear wave count in the mid term.
BEAR ELLIOTT WAVE COUNT
MAIN WEEKLY CHART
Click chart to enlarge.
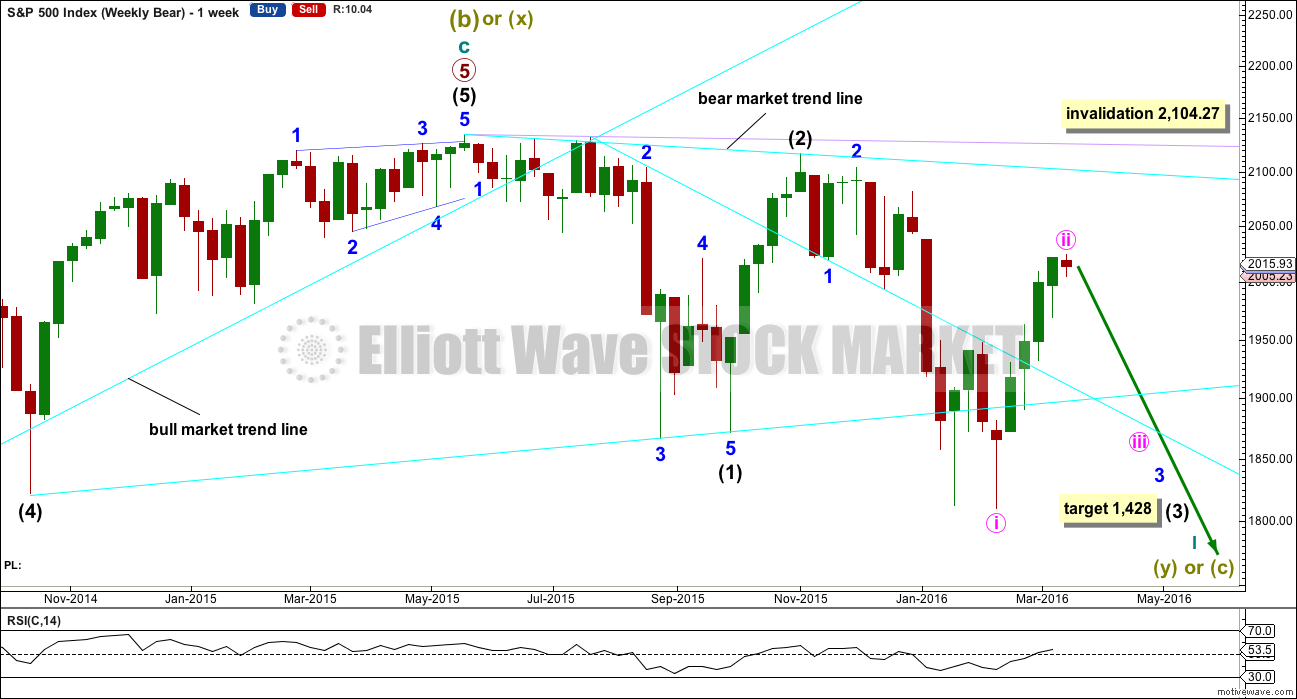
Importantly, there is no lower invalidation point for this wave count. That means there is no lower limit to this bear market.
This bear wave count now has two ways to see downwards / sideways movement from the all time high, so two weekly charts are presented below.
This third wave for intermediate wave (3) still has a long way to go. It has to move far enough below the price territory of intermediate wave (1), which has its extreme at 1,867.01, to allow room for a following fourth wave correction to unfold which must remain below intermediate wave (1) price territory.
Intermediate wave (2) was a very deep 0.93 zigzag. Because intermediate wave (2) was so deep the best Fibonacci ratio to apply for the target of intermediate wave (3) is 2.618 which gives a target at 1,428. If intermediate wave (3) ends below this target, then the degree of labelling within this downwards movement may be moved up one degree; this may be primary wave 3 now unfolding and in its early stages.
Minute wave ii is now longer in duration that minor wave 2 one degree higher. This has now reduced the probability of this wave count this week, which is why the alternate is presented.
DAILY CHART
Click chart to enlarge.
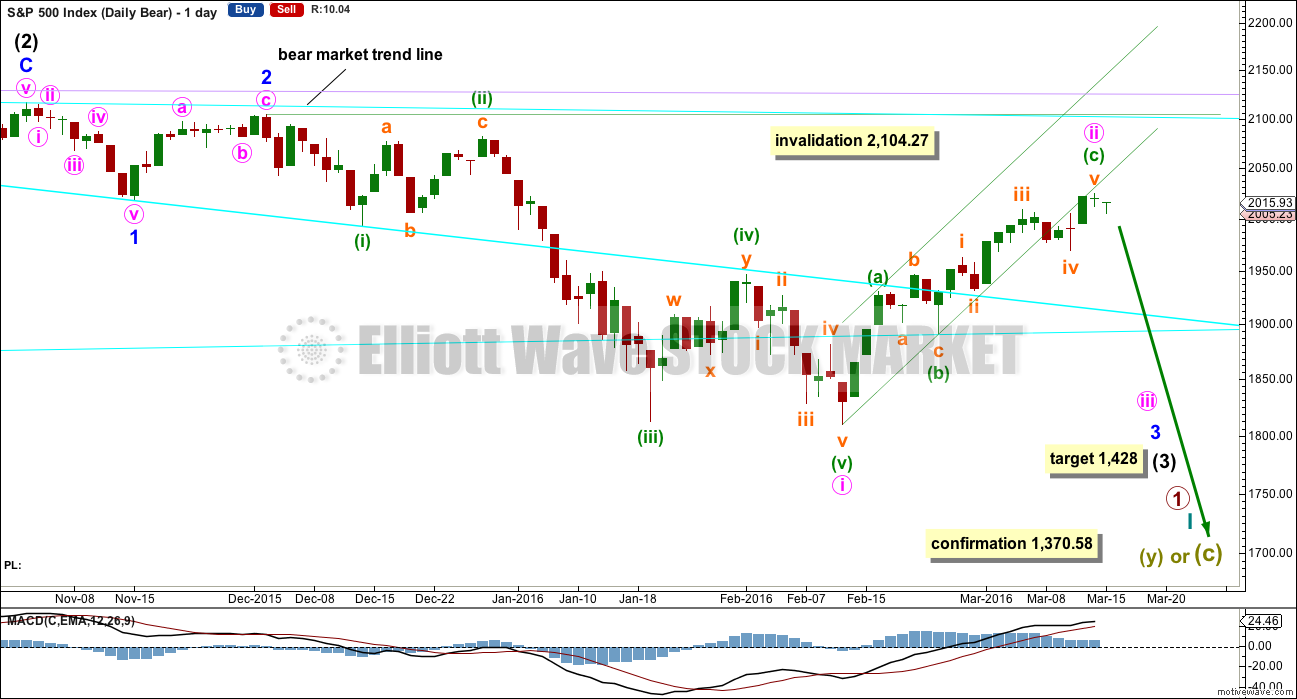
Intermediate wave (2) lasted 25 sessions (not a Fibonacci number) and minor wave 2 lasted 11 sessions (not a Fibonacci number).
Minute wave ii has now lasted 21 sessions. When minute wave ii is more than twice the duration of minor wave 2, one degree higher, then this wave count will be discarded due to an exceptionally low probability. At this stage, with the small green dragonfly doji of Tuesday’s session, it looks like minor wave 2*Edit: minute wave ii may be over already for this wave count. The dragonfly doji sits fully below the channel about this zigzag.
It is this point at which the two ideas for the mid term diverge. If upwards movement is a complete zigzag, then it should be over and price should move strongly lower. However, if the alternate below is correct, then upwards movement is incomplete and this movement sideways is a small fourth wave correction. How low the next wave goes will tell which of these two ideas is correct. Price must move below 1,930.68 to confirm the upwards movement is a complete zigzag for this first bear wave count.
The channel about minute wave ii is drawn using Elliott’s technique for a correction. Price is finding resistance along the lower edge.
Minute wave ii may not move beyond the start of minute wave i above 2,104.27.
At 1,428 intermediate wave (3) would reach 2.618 the length of intermediate wave (1).
HOURLY CHART
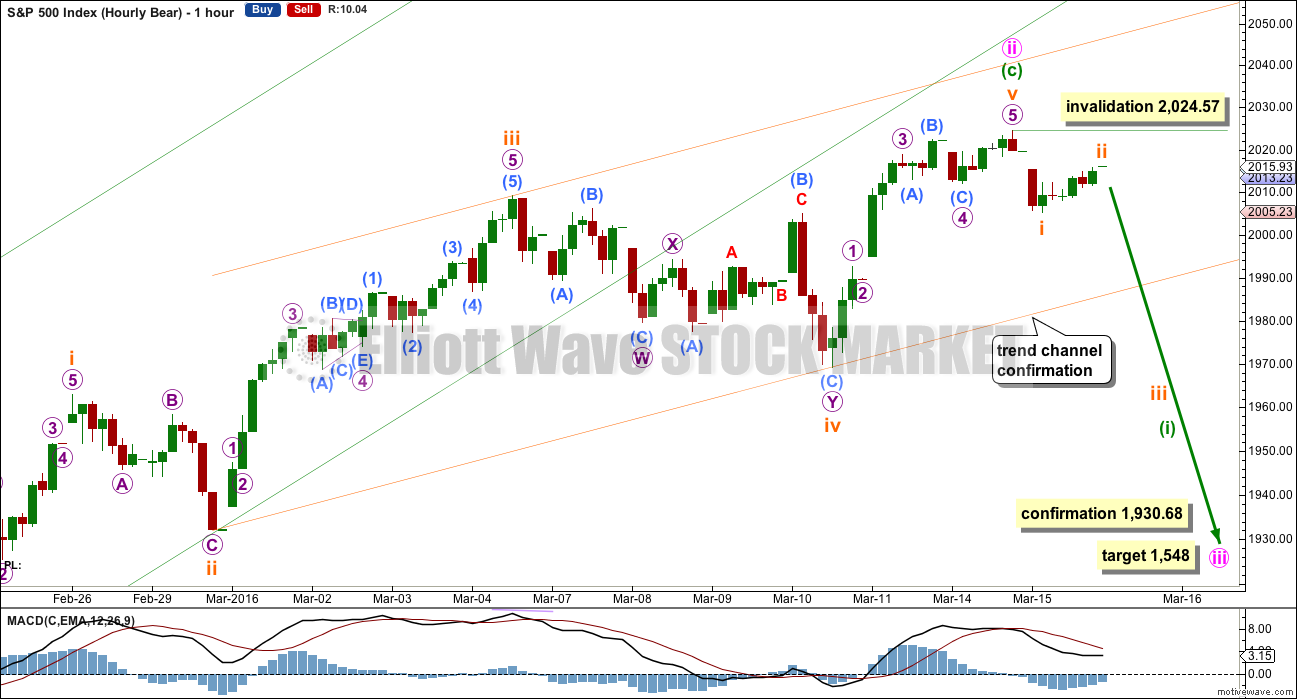
Click chart to enlarge.
A-B-C of a zigzag and 1-2-3 of an impulse subdivide in exactly the same way: 5-3-5.
Minute wave ii may now be a complete 5-3-5 zigzag. So far downwards movement may be a first wave complete, with a second wave correction to follow. Subminuette wave ii may not move beyond the start of subminuette wave i above 2,024.57.
If this wave count is invalidated by upwards movement, it would reduce the probability of the wave count at the daily and weekly chart level. At that stage, it may be discarded.
This wave count requires confirmation below 1,930.68.
At 1,548 minute wave iii would reach 1.618 the length of minute wave i.
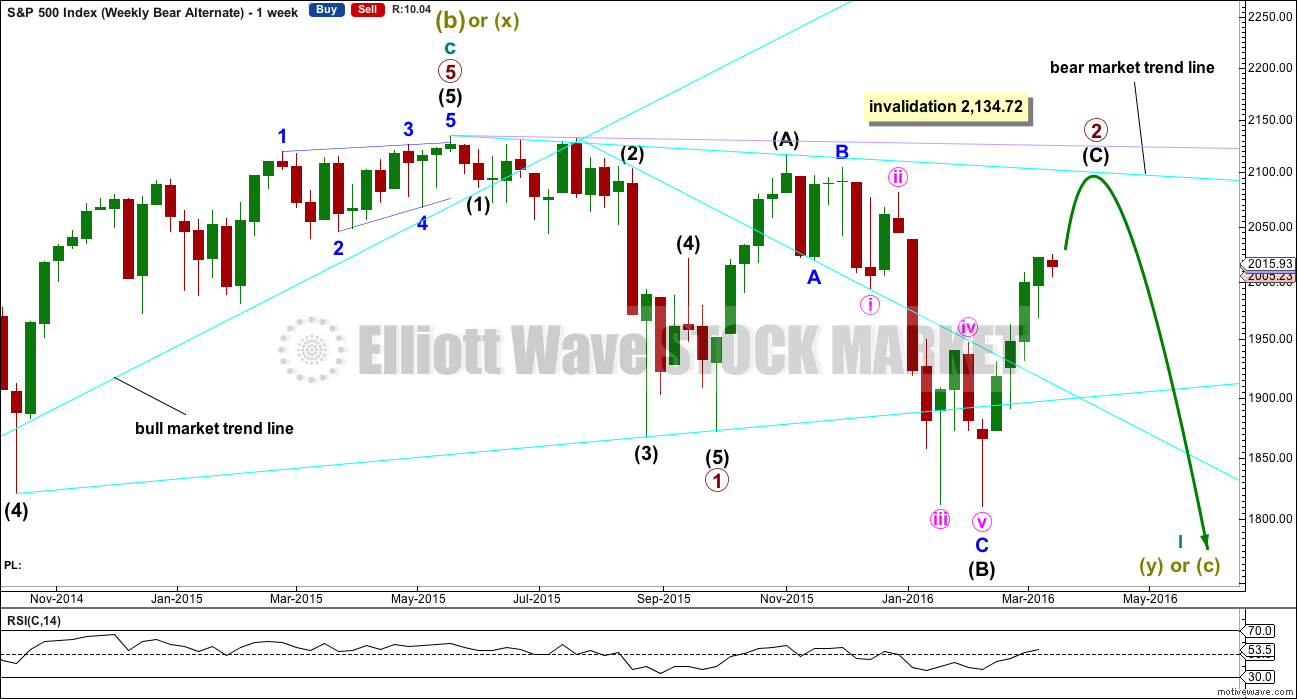
ALTERNATE WEEKLY CHART
Click chart to enlarge.
The impulse downwards for primary wave 1 is seen in the same way as the main bear wave count with the exception of degree. Here, the labelling is moved up one degree. Primary wave 1 may be complete and may have lasted 19 weeks, two short of a Fibonacci 21. So far primary wave 2 is in its 23rd week. It looks unlikely to continue for another 11 weeks to total a Fibonacci 34, so it may end in about two to five weeks time. This would still give reasonable proportion between primary waves 1 and 2. Corrections (particularly more time consuming flat corrections) do have a tendency to be longer lasting than impulses.
Primary wave 2 may be unfolding as an expanded or running flat. Within primary wave 2, intermediate wave (A) was a deep zigzag (which will also subdivide as a double zigzag). Intermediate wave (B) fits perfectly as a zigzag and is a 1.21 length of intermediate wave (A). This is within the normal range for a B wave of a flat of 1 to 1.38.
Intermediate wave (C) is likely to make at least a slight new high above the end of intermediate wave (A) at 2,116.48 to avoid a truncation and a very rare running flat. However, price may find very strong resistance at the final bear market trend line. This line may hold price down and it may not be able to avoid a truncation. A rare running flat may occur before a very strong third wave down.
Primary wave 2 may not move beyond the start of primary wave 1 above 2,134.72.
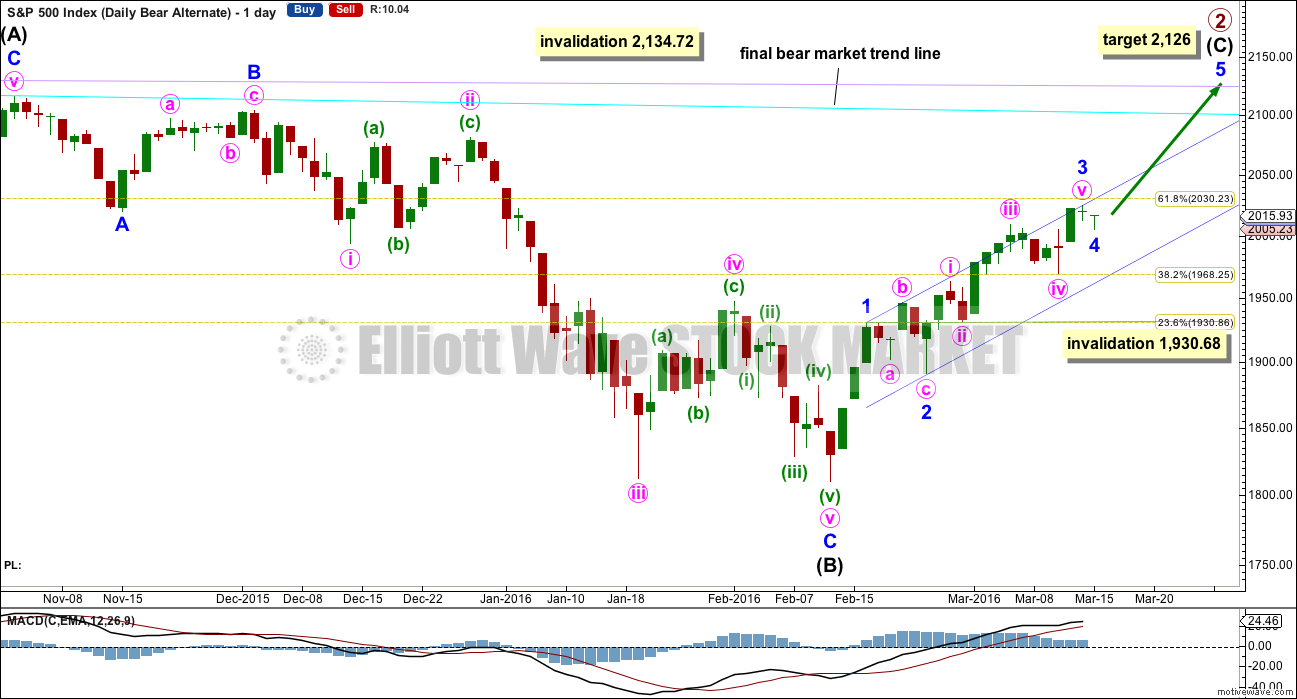
ALTERNATE DAILY CHART
Click chart to enlarge.
Intermediate wave (A) fits nicely as a single or double zigzag.
Intermediate wave (B) fits perfectly as a zigzag. There is no Fibonacci ratio between minor waves A and C.
Intermediate wave (C) must subdivide as a five wave structure. It is not unfolding as an ending diagonal, so it must be unfolding as a more common impulse.
At this stage, it looks like a 5-3-5 up is complete which may be minor waves 1-2-3. Sideways movement for the last two sessions may be minor wave 4 which may not move into minor wave 1 price territory below 1,930.68. Minor wave 3 may have ended earlier than expected, finding some resistance about the 0.618 Fibonacci ratio at 2,030.
If minor wave 4 ends here or very close to this point, then at 2,126 minor wave 5 would reach equality in length with minor wave 1. This target may see price find resistance at the new lilac trend line, and it would also see intermediate wave (C) avoid a truncation.
Intermediate wave (C) does not have to move above the end of intermediate wave (A) at 2,116.48, but it is likely to do so to avoid a truncation. If it is truncated and primary wave 2 is a rare running flat, then the truncation is not likely to be very large. As soon as price is very close to 2,116.48 this wave count looks at the possibility of a trend change.
The next wave down for this wave count would be a strong third wave at primary wave degree.
If price continues any higher, this may be the only bear wave count. If price continues higher, the main bear wave count will further reduce in probability. It may be discarded before it is invalidated by price.
If this alternate bear wave count is correct, then the decline in volume is acceptable and makes sense. Further, a third wave of a C wave is sometimes weaker than the first, with the fifth wave weaker still. This wave count would fit with volume and momentum as long as the third wave of minor wave 3 within intermediate wave (C) is not the weakest.
Redraw the channel about intermediate wave (C) using Elliott’s technique. Draw the first trend line from the ends of minor waves 1 to 3, then place a parallel copy on the end of minor wave 2. Look for minor wave 4 to find support at the lower edge of the channel, if it moves down that far.
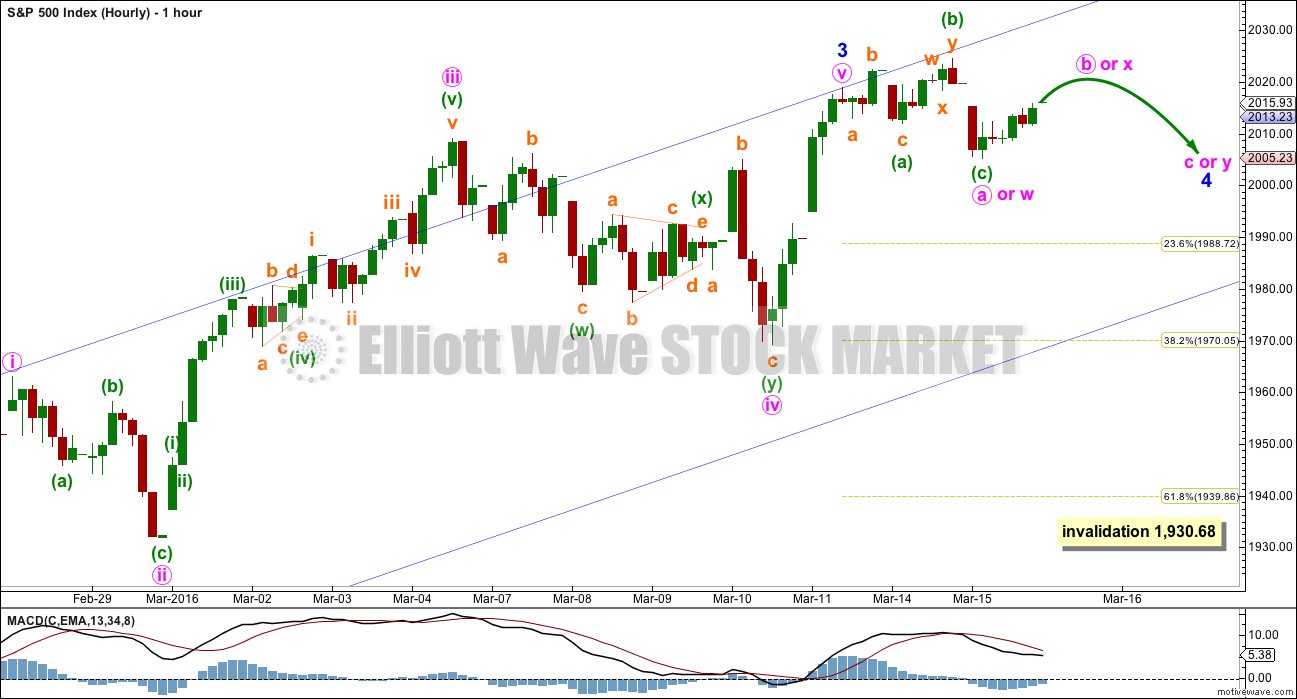
ALTERNATE HOURLY CHART
Click chart to enlarge.
Minor wave 2 was a shallow 0.33 expanded flat correction.
So far minor wave 4 may be unfolding as a combination, double flat or triangle. A triangle would offer best alternation with the expanded flat of minor wave 2.
Minor wave 4 may be very shallow to exhibit some alternation in depth with minor wave 2. Alternatively, it may be very deep to exhibit alternation, but as that would require a huge breach of the channel which is copied over from the daily chart it has a very low probability. It is most likely that minor wave 4 will be very shallow.
It is possible but unlikely that minor wave 4 is over already. It would be too brief in comparison to minor wave 2 and would exhibit too little alternation. It would have a better look if it continues sideways for a few days yet, maybe to find support at the lower edge of the channel.
Minor wave 4 has reached down into the fourth wave of one lesser degree price territory. It may end within this range, below 2,009.13 and above 1,969.25. The 0.236 and 0.382 Fibonacci ratios lie within this range. The 0.236 Fibonacci ratio at 1,989 would be favoured as it would offer some alternation with minor wave 2.
TECHNICAL ANALYSIS
DAILY CHART
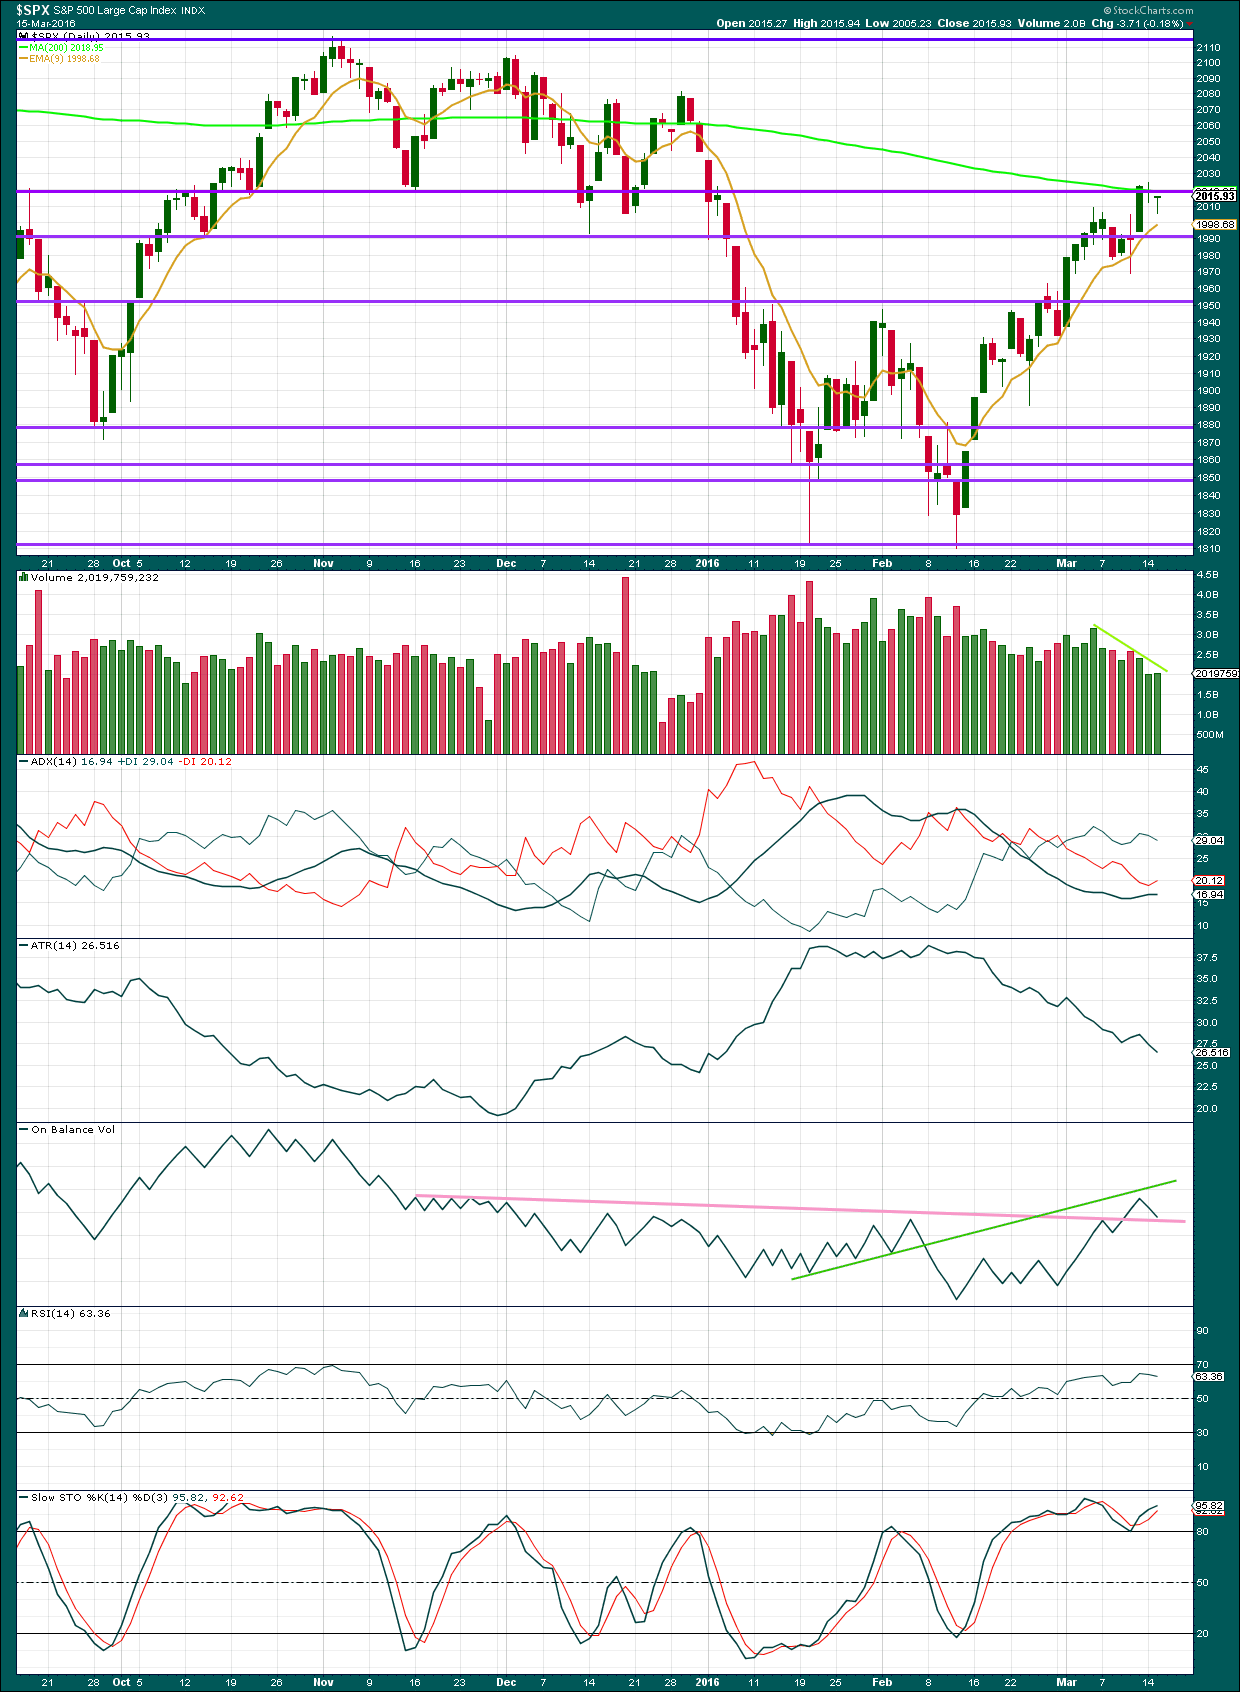
Click chart to enlarge. Chart courtesy of StockCharts.com.
Volume data on StockCharts is different to that given from NYSE, the home of this index. Comments on volume will be based on NYSE volume data when it differs from StockCharts.
A small green dragonfly doji for Tuesday’s session indicates indecision, a balance between bulls and bears with the bulls slightly winning. Coming after a reasonably sustained rise this doji in conjunction with the doji three days ago indicates the market is tired.
NYSE data shows a decline in volume for Tuesday’s session. The overall upwards movement was not supported by volume. This makes sense with the Elliott wave counts which see the last two days as a small fourth wave correction.
Price is finding resistance at the 200 day moving average and the horizontal trend line about 2,020.
ADX is flat to slightly rising overall, indicating the market may be trending.
While ATR continues to decline with price moving higher, this strongly now indicates that the upwards movement in price is not a normal trend. This supports the Elliott wave count which sees this movement as a bear market rally and not a new bull market.
On Balance Volume has come down to find support at the pink trend line. With a test of this line it will be indicative of the next movement for price. If OBV breaks below this line, it would favour the main bear wave count. If OBV bounces up from this line, the alternate bear wave count would be favoured.
Stochastics remains overbought. RSI has not reached overbought.
DOW THEORY
For the bear wave count I am waiting for Dow Theory to confirm a market crash. I am choosing to use the S&P500, Dow Industrials, Dow Transportation, Nasdaq and I’ll add the Russell 2000 index. Major swing lows are noted below. So far the Industrials, Transportation and Russell 2000 have made new major swing lows. None of these indices have made new highs.
I am aware that this approach is extremely conservative. Original Dow Theory has already confirmed a major trend change as both the industrials and transportation indexes have made new major lows.
At this stage, if the S&P500 and Nasdaq also make new major swing lows, then my modified Dow Theory would confirm a major new bear market. At that stage, my only wave count would be the bear wave count.
The lows below are from October 2014. These lows were the last secondary correction within the primary trend which was the bull market from 2009.
These lows must be breached by a daily close below each point. So far the S&P has made a new low below 1,821.61, but it has not closed below 1,821.61.
S&P500: 1,821.61
Nasdaq: 4,117.84
DJT: 7,700.49 – this price point was breached.
DJIA: 15,855.12 – this price point was breached.
Russell 2000: 1,343.51 – this price point was breached.
This analysis is published @ 09:50 p.m. EST.
Thanks for the advice on listening to Ciovacco Capital on Youtube. It did put my concerns as to where market is heading at ease…
And a solid trade following Lara’s gold analysis also put me in a better mood…
Its been very gloomy for the bears in this market the last 4-5 weeks. But we’ll have our day soon… First day of spring is around the corner, maybe things will turn around by then?
Lets see…
Small UVXY hammer at 25.14 on the one minute chart. Market at critical point. Interesting divergence between DJI and SPX on this last move up, with a clear five in the latter, and what appears to be a truncation in the former. Have a great evening all!
Vern,
VIX ended slightly above the lower BB and in the past that has coincided with sell off in stocks. Do you see it the same way or am I reading the chart for VIX wrong?
I think we are close to a return the downtrend so I would agree with that. It can sometimes bounce along the lower BB for a few days.
looks like the volume was below 600 million today…for S&P. Anyone has volume numbers handy? Now showing 617 million Hmmm..
612.366 Million…. it doesn’t matter… The TOP is in…. 2032.02
Why 2032 ?
NYSE show an increase today.
Yesterday 529.5 million, up day
today 617.67 million, up day
Interestingly – NYSE website shows the small doji for yesterday as red. But the close is above the open. So I’m not sure how they think that works… I can’t figure that out.
News just out former FED employee avoids jail gets $2,000 fine for stealing fed secrets for GOLDMAN Sachs…
How much cash did Goldman give him – surely way more than $2000 🙂
Dave,
Exactly and shows you how this administration failed to penalize the wall street while folks lost their life savings.
2032.02 is the Top!
Not the manic EOD run I was expecting!
A bit closer at 25.24…
If we get Minor 5 up then UVXY could goto mid teens – what are you seeing that makes you doubt that? (serious question, not rhetorical).
I’m hanging onto UVXY by a thread as I think this correction has more downside to offer.
The recent action has the look and feel of a bit of a blow-off top after the tired action of the past few days. Of course I could be wrong with five continuing for a few days. The emotion of the FED non-action should be short-lived…
I’ve tried zooming out to see if there is any way it is a complete structure but just can’t see it (well – not without forcing it).
Time will tell – if we start diving lower and take out the lower trendline and confirmation, then that’s good enough for me.
Until that time I’m still in damage limitation mode – will sell into any move lower using EW and trendlines to try turn this stinky old dog into a profit. I expect at least a partial retrace – today’s move up fits the EW count nicely, but was very emotionally driven so might fall back down again tomorrow as Minor 4 continues (and expects).
Thank goodness for PM’s today !!
I took profits on miners a bit too soon yesterday and missed the nice pop today. Can’t win ’em all. Was a bit concerned about the short positions of the commercial guys who are now holding 19,000.00 contracts. This size of short contracts usually presages a multi week correction. Hope to reload before too long…
That move up in Gold was exactly what I was expecting today, a few happy campers over at EWG and myself included with a nice profit.
I will proudly attest to that…
🙂
Sounds like I need to get that service! 🙂
Since when did pro traders start caring so much about the news? We should watch the waves not the TV imho (especially when trading)
It’ll spare you a few more years outside the nut house!
Sure, my spot in the rockin chair is booked – but they ain’t getting me in there quite just yet.. No Sir 🙂 🙂 🙂
Truer words never spoken! These folk are nothing but a sideshow…the charts tell all. Speaking of which, looking like a small fifth up underway…
Looks like UVXY saying 25.4 and no more.
We may have a hard floor on VIX futures. They really should break it with all the excitement showing up in futures. I’ll wait a bit….I want to see a sharp spike down with a big hammer…SPX should fill the gap at 2043.94
Yellen – Economic Growth “Downgraded”
Opened stink bids to be filled contingent on UVXY below 25…I may not get filled unless the paroxysm of passion for the upside continues; here’s hoping it goes just a bit higher… 🙂
Was out to a meeting and got back to see I was filled at 25.4 – nice.
Buy order at 24.5 sitting there. It could go lower in an EOD buying rush.
Maybe should look at some calls…
FWIW here’s my call for the (potential) turn point – 2043
Above that then I’m currently out of ideas. Will take a break of 1960 for me to give credence to the bears… and be able to sleep again.
How did you come up with that target?
I believe he is looking at the gap fill around 2043
2043.94…
2043.94…from December 31…
Gap fill and 76.4 retracement.
The instrument i trade SPX with is know as US500, and so price is usually a fraction away from the cash, but the 2043/2044 level would nail the 76.4 from 2116 to 1808 area… So yeah 2043.94 sounds good Verne 🙂
Assuming we see some downside, then levels it MUST break to be convincing
2005
1995
1972
1963
No doubt that price trajectory would make a lot of folks here very happy, so i’ll throw something out for your consideration well in advance of any potential downside…
Look out for 1947
I see 1947 as a strong potential reversal zone for any downside before a run up to the 2110/2115 area… evil things like that can happen!
Yes, evil indeed.
Bear markets are different to bull markets.
The upwards swings are big, deep, volatile.
If anyone missed this video, the link was posted by a member (sorry, I forget who exactly) then please do watch it. It’s simple, solid, impressive technical analysis. It explains nicely the nature of this bear, and exactly how it fits prior bear markets for S&P.
Yeah – around 1947 (or as close as possible to 1930) would be my sell zone for any shorts I had. I would then throw the kitchen sink at it if the market continued moving down below 1930.
I’ve found that trading technique to be incredibly profitable. I cannot count the amount of times when I’ve felt like I’m wasting my money (assuming due to momentum the market will continue lower so why sell my short?), only for it to stop dead in it’s tracks and shoot back upwards before hitting the confirmation. Wave 4’s sniffin Wave 1 is particularly lucrative at many EW degrees.
I often use the same technique to place a bet in the other direction as it is incredibly low risk (sometimes just sell more of the short than I originally had – so shorting the short).
So I’m hoping we get very close to 1930 indeed!! As soon as Lara revealed the count I was already licking my lips for that very trade 🙂 🙂
Final wave up underway.
You might be right – but I’m allowing Wave B to be up to 2 x Wave A to be sure – W4 still seems a little short in duration to me.
Well that was interesting.
When I got up this morning I saw both S&P and Gold moving sideways in tiny ranges… it looked like watching paint dry. Again.
And now both have moved strongly higher together.
Lately as Gold moved higher, the S&P moved lower. Or as Gold moved sideways the S&P moved higher.
With this move in the last hour these two have decoupled. The relationship persists.. until it doesn’t.
This spike up for the S&P now fits nicely as a B wave within a larger flat correction, it has passed 0.9 of the prior minute wave a meeting the minimum requirement for a B wave within a flat.
So minor 4 may be a flat, with minute a within it also a flat. Or minor 4 could be a double flat with minute y now to begin sideways. Or minor 4 could still be a triangle.
There are still multiple structural possibilities. And it is impossible for me to tell you which one will unfold. All I can say again today is the correction still looks incomplete. Expect more sideways movement for another day to three.
Probability of Bear alternate now greatly increased with the slight new high imo –
W4 perhaps still in progress (B (or X) wave could make a new high).
Olga,
I was thinking the same but will see how market close today and work tomorrow to get a better read on the likely direction for markets. I am paying close attention to volume as well.
I agree. I just can’t see minute ii as over at todays high, the structure of subminuette v within it is going to just not fit and have the right look.
Hi Lara – when measuring a flat (for example to judge length of this possible B wave) – do you measure the widest part of the flat or measure from beginning of A to end of C? (or some other measurement!??)
I just did the calculation and realised I might not be measuring it correctly.
Fed doesn’t believe the data put out by governments… all the data is fictional!!!!
Recession on the horizon!!!!!!
DEFLATION to ACCELERATE!!!!!
This is what the Fed is saying today by their inaction and reducing the dot plots by half into the future… They are Really saying things are bad and getting worse!!!!
There can be NO OTHER CONCLUSION!!!!
I have been watching the Fed since my College Days 1978-1982 and this is what they are really saying!!!!
If you believe the talking heads… you will go broke!!!!
The Fed should have SMACKED the Market Babies… but they gave into the market babies….!!!!!!
Now put that into the perspective of dealing with babies/children…. By doing what they did your kids will become coke/herion addicts!
I wish I had more powder to short here! But I am as short as I have the ability to get!
The World is DOOMED!!!!!!!!!!!!!!!!!!!
Get your cash out NOW!!!!!!!!!!!!!!!!!!!!!
Already did 😉 🙂
Joseph, I’ve moderated a couple of your comments out. It just didn’t add anything to the discussion and appeared to be rather emotional.
It would be much nicer if you could please not use all caps and many exclamation marks so much. It’s the digital equivalent of shouting.
Thank you very much for your understanding.
I know it may be annoying. But my standards are exceptionally high. That’s how we keep this space ultra polite and encourage people to be comfortable sharing trading experience.
That’s fine…. emotional yes… but accurate.
Lets listen to the snake oil salesperson who is now speaking.
Lets count the lies…. and remember the Fed by inaction today is admitting they data is fictional.
I’d take some time out mate – you’re taking it way too personal.
Every dog has it’s day… our time will come buddy 🙂 🙂 🙂
We all know it’s smoke and mirrors….
This is all a three card monte report!
You hear the BS answer to Steve’s appropriate question? All BS! She completely changed from her comments in December.
I don’t listen to any of the talking heads.
The market commentary I read is almost exclusively technical analysis. And I’m pretty fussy about who I read. I found Ciovacco Capital on the YouTubes yesterday and was mightily pleased.
And so I’m sure the rest of the membership here knows what you’re talking about, but I’m clueless. And happily so 🙂
The Fed Chairman…
Yes, Ciovacco Capital is excellent.
Completely evidence based, which is great.
Just posted a link to their most recent video the other day…
They have a very balanced approach and calm delivery, which is what you need most days 🙂
Will second that – I follow Ciovacco on Twitter and always admired his work and approach.
Another guy i rate in terms of his trading & psychology is Assad Tannous from Asenna Wealth. Worth checking out.
Anybody else use Twitter finance?
Admittedly there is a mountain of horsesh*t on it but also some absolute gems and like Chris Ciovacco, Peter Brandt, Steve Burns
Joseph,
Did they promise more money if not the realization will hit the markets fast? I suspect now the cloud of FEDs decision is out, markets will work with what matters the most liquidity…no new money means less liquidity… USD dropping
Obviously the cat is out of the bag…
Everyone is clearly expecting the market to blast higher, based on terrible action in VIX (UVXY). Will everyone be right????
Still sitting on 20% UVXY with a stop at 2025.
http://www.capitalmarketssummit.com/ ….
Today’s 200 DMA’s:
2018.48 for SPX and declining
2011.78 for ES and declining
Today I will be looking for the Y portion of the possible double combination to be completed with a possible zig-zag to the downside, followed by the final impulse up. Impulse could co-incide with FED blather at 2.00 pm when they boldly announce that they will do absolutely nothing. Hopefully we see a corresponding retest of recent lows in UVXY on final move up (you know what to do!). DB takes another dive on its way to zero. To your trading profits!
2.3% year over year core inflation the highest since the 2.5% in 2008
4.90% unemployment rate
The Fed MUST raise the Fed Funds Rate to 0.75% today and stay on the dot plot to normalize rates.
The “Data Dependent Fed” Doing anything other means that the Numbers Put out are fictional and the Fed is admitting that they don’t believe the numbers either.
So as NOT to admit that and lose all remaining credibility the Fed MUST Raise as they said they would through their Dot Plots which they continue to say to all look at and believe…. BUT everyone including the Markets IGNORE!
All the talking heads say everything is fine and bullish. BUT they say the Fed will ONLY Raise the Fed Funds Rate ONCE in 2016!
How does all that TALK match up with the Data and the Feds own Dot Plot of where they expect rates to go… But ONLY causes ONE Fed Funds Rate increase in 2016??????????????
IT DOESN’T MATCH UP!!!!!!
Joseph,
Same way as ECB said that there is no deflation but the inflation will be negative for the coming months…. 🙂
Agree 110% with you on FED’s credibility and irrespective of the decision, their commentary post decision news will be of significant interest.
They will not. It is not as if any thinking person believes the FED has any credibility anyway. Stockman has argued that it is in fact their failure to act today that will finally expose their impotence to the otherwise clueless. Raising rates would result in an immediate market implosion and they are not about to do that. Eventually the market will force them to raise rates as we are already seeing a bond sell-off today. An impulsive drop through the round number pivots today would signal the crowd is waking up to reality and favor the main bear count. Waiting with bated breath…not!!!! 🙂
The Fed has to get it’s manhood back!
Back in the late 1970’s and the early 1980’s the Fed ruled… it’s job was and is to SMACK the Markets! They will SMACK the markets…. The Fed will SMACK the crying babies playing in the markets… Back then the element of SUPRISE was one of their BEST weapons… if NOT now, when???
That is it’s mandate in addition to controlling inflation and maximum employment.
Stockman got it right… there is no easy unwind of this mess. The sheep are about to be driven off a cliff.
I wouldn’t be surprised to see SPX really blast off after the Fed, and why wouldn’t it, the good times are back 🙂
UVXY is tanking… Hope to buy 1/2 position UVXY at 25.5 and 1/2 at 24.5 if it goes lower… maybe one of the safest trades of the year since vix can’t stay that low for long.
52 week low 24.8? How low could it go?
We may see it hit 20 very briefly. I continue to accumulate under 28. Will get a bit more aggressive if and when it moves below 25. Looking like a double bottom around 26.40
Lara,
Which wave count of yours is your preferred count?
It looks like your stand back a lot in past month.
“If I was asked to pick a winner (which I am reluctant to do) I would say the bear wave count has a higher probability. It is better supported by regular technical analysis at the monthly chart level, it fits the Grand Supercycle analysis better, and it has overall the “right look”.”
I would favour the alternate bear, but in the short term price will shortly tell us which of the bear counts is correct.
I thought I’d been pretty clear that I don’t favour the bull count? I have no confidence in it. And that alternate bear has only been published for the last three analysis.
“At this stage, with the small green dragonfly doji of Tuesday’s session, it looks like minor wave 2 may be over already for this wave count. The dragonfly doji sits fully below the channel about this zigzag.”
I do believe you intended to say minute wave 2 may be over…
(I am sure we all got it.) 🙂
Crikey… yes. I meant to say minute ii.
Thanks Verne.
Most welcome! I guess now you know I peruse your every word! 🙂
here. present..