
Downwards movement was expected but did not happen.
A new alternate Elliott wave count is published with this analysis.
Summary: The short / mid term trend remains up while price remains above 1,969.25. The target is 2,086 – 2,088. When the next impulse is over, then how low the following wave down goes will indicate which of three wave counts is correct.
To see how each of the bull and bear wave counts fit within a larger time frame see the Grand Supercycle Analysis.
To see detail of the bull market from 2009 to the all time high on weekly charts, click here.
If I was asked to pick a winner (which I am reluctant to do) I would say the bear wave count has a higher probability. It is better supported by regular technical analysis at the monthly chart level, it fits the Grand Supercycle analysis better, and it has overall the “right look”.
New updates to this analysis are in bold.
BULL ELLIOTT WAVE COUNT
MONTHLY CHART
Click chart to enlarge.
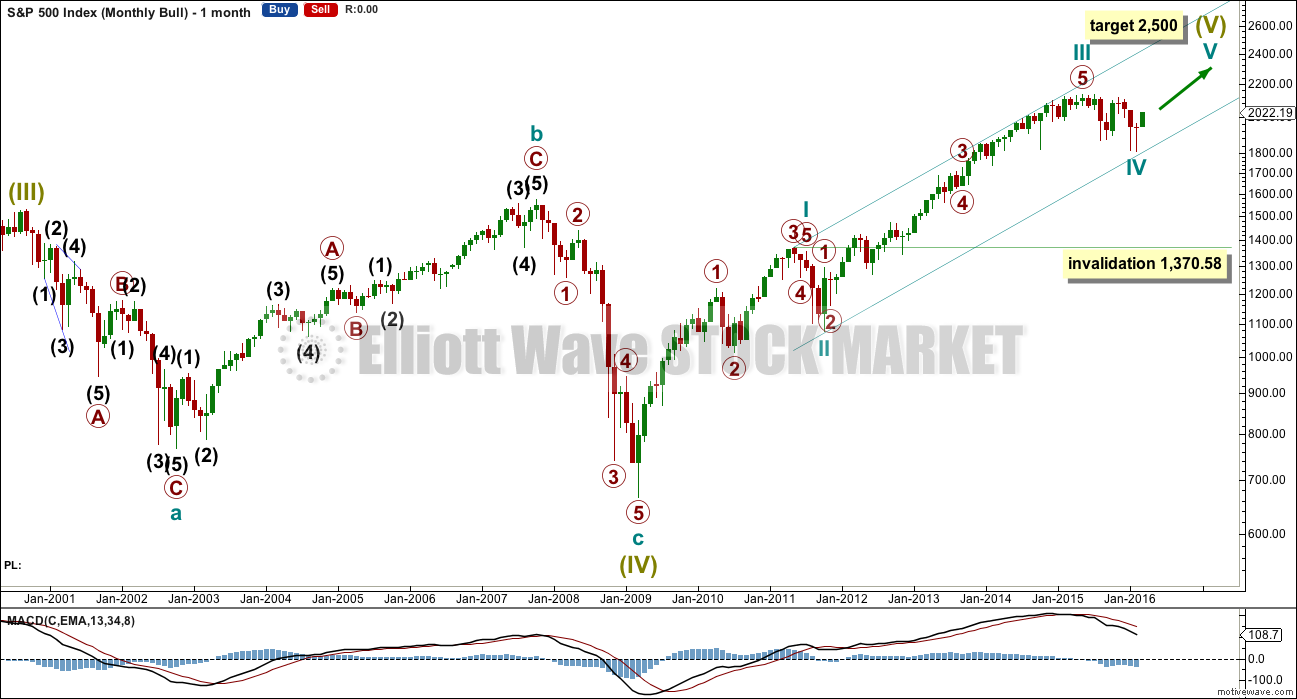
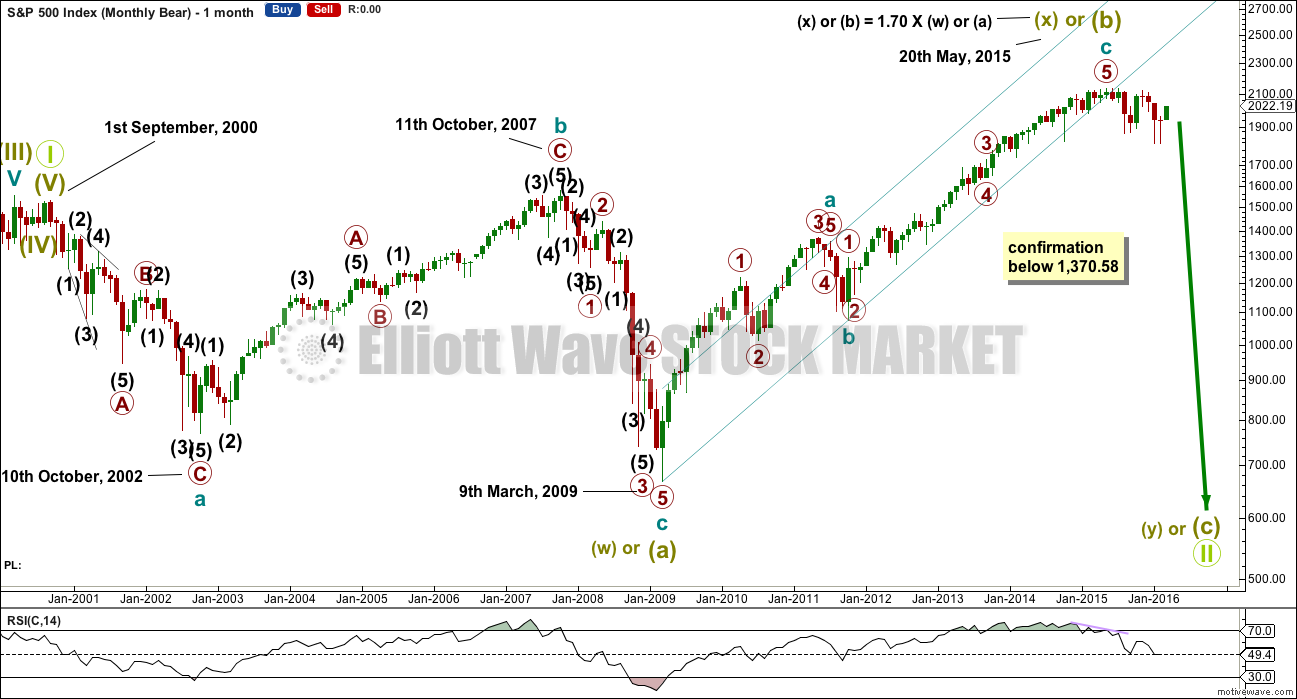
This wave count is bullish at Super Cycle degree.
The two big bear markets of 2000 – 2002 and 2007 – 2009 may have been waves A and C within a large flat correction for a Super Cycle wave IV. The bull market since 2009 may be Super Cycle wave V.
Cycle waves I, II and III are complete within Super Cycle wave V. Cycle wave II was a relatively shallow 0.41 zigzag lasting 12 weeks. Cycle wave III is 55.97 points short of 1.618 the length of cycle wave I. This is a reasonable difference, but as it is less than 10% the length of cycle wave III (it is 5.2%) I consider this an acceptable Fibonacci ratio.
Draw a best fit channel about this bull market as shown. Cycle wave IV may have ended just short of support at the lower edge.
If it continues any further, cycle wave IV may not move into cycle wave I price territory below 1,370.58. If this bull wave count is invalidated by downwards movement, then the bear wave count shall be fully confirmed.
Cycle wave III shows an increase in upwards momentum beyond cycle wave I.
Cycle wave II was a shallow 0.41 zigzag lasting three months. Cycle wave IV may be a complete shallow 0.19 regular flat correction, exhibiting some alternation with cycle wave II.
At 2,500 cycle wave V would reach equality in length with cycle wave I.
WEEKLY CHART
Click chart to enlarge.
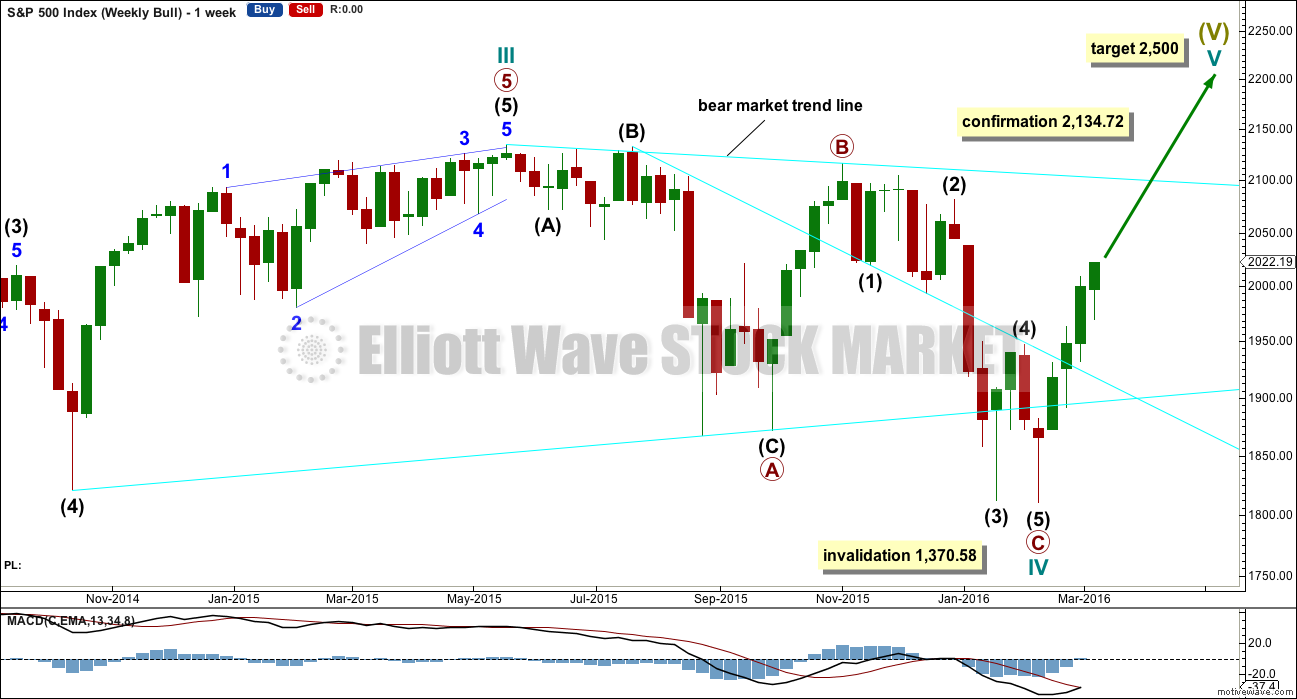
Price remains below the final bear market trend line. This line is drawn from the all time high at 2,134.72 to the swing high labelled primary wave B at 2,116.48 on November 2015. This line is drawn using the approach outlined by Magee in the classic “Technical Analysis of Stock Trends”. To use it correctly we should assume that a bear market remains intact until this line is breached by a close of 3% or more of market value. In practice, that price point would be a new all time high which would invalidate any bear wave count.
This wave count requires price confirmation with a new all time high above 2,134.72.
While price has not made a new high, while it remains below the final bear market trend line and while technical indicators point to weakness in upwards movement, this very bullish wave count comes with a strong caveat. I do not have confidence in it.
DAILY CHART
Click chart to enlarge.
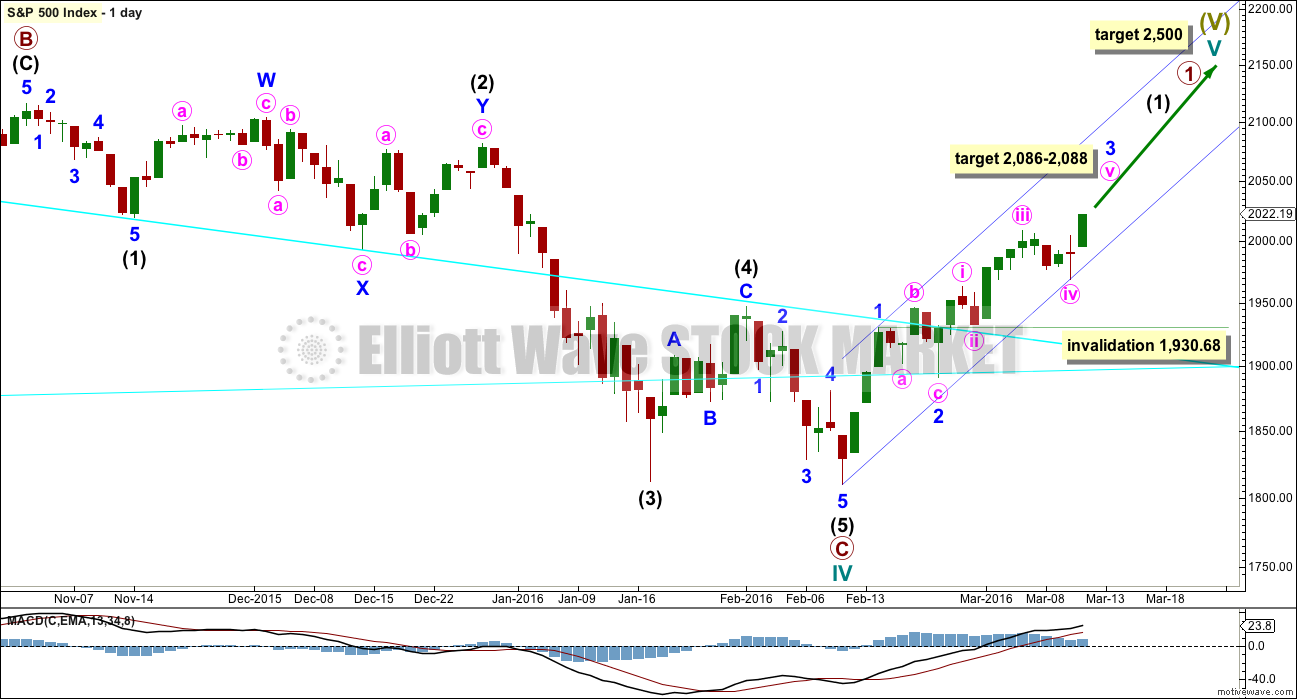
Upwards movement cannot now be a fourth wave correction for intermediate wave (4) as price is now back up in intermediate wave (1) territory above 2,019.39. This has provided some clarity.
For the bullish wave count, it means that primary wave C must be over as a complete five wave impulse.
Intermediate wave (2) is seen as an atypical double zigzag. It is atypical in that it moves sideways. Double zigzags should have a clear slope against the prior trend to have the right look. This double zigzag looks completely wrong. This further reduces the probability of this wave count.
If the bull market has resumed, it must begin with a five wave structure upwards at the daily and weekly chart level. So far that is incomplete.
At 2,088 minor wave 3 would reach 1.618 the length of minor wave 1. Within minor wave 3, at 2,086 minute wave v would reach 1.618 the length of minute wave iii. This gives a two point target zone calculated at two wave degrees which should have a reasonable probability.
HOURLY CHART
Click chart to enlarge.
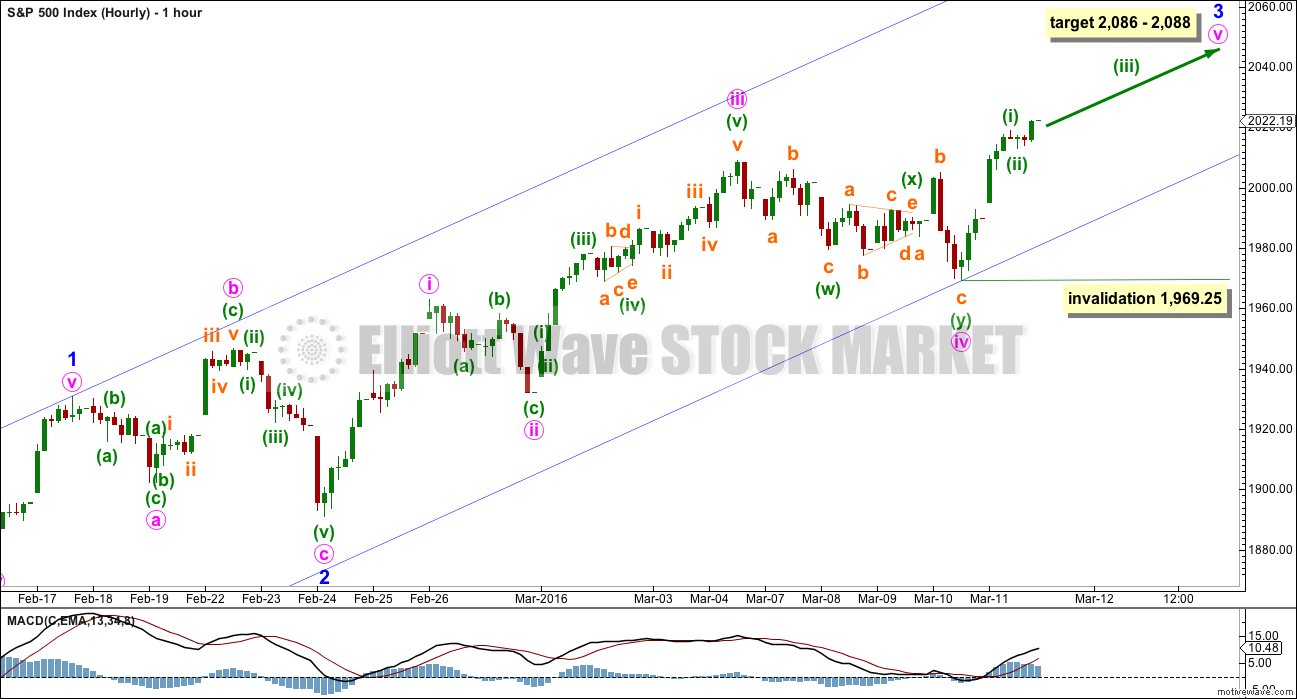
The persistent divergence with price and MACD must disappear for this wave count to remain viable, even short term. If upwards movement is a third wave (and not a C wave), it should be stronger than the first wave; third waves almost always are stronger. Almost is not the same as always though. This may be a third wave, which indicates the fifth wave to come should be weaker still, so that the third wave is not the weakest.
Within minor wave 3, minute wave iii is slightly stronger than minute wave i but is not stronger than minor wave 1. Minute wave iii is 5.36 points longer than equality with minute wave ii. The rule that a third wave may not be the shortest is met.
Minute wave ii is a shallow 0.43 zigzag. Minute wave iv is a deeper 0.52 double combination. There is alternation between these two corrections.
Within minute wave v, no second wave correction may move beyond the start of its first wave below 1,969.25.
It must be assumed that price is likely to still rise while price remains above 1,969.25 and particularly while it remains within the best fit channel.
BEAR ELLIOTT WAVE COUNT
MONTHLY CHART
Click chart to enlarge.
What if the big flat correction labelled super cycle wave (w) or (a) was only the first three in a larger correction?
This bear wave count fits better than the bull with the even larger picture, super cycle analysis found here. It is also well supported by regular technical analysis at the monthly chart level.
There are two ideas presented in this chart: a huge flat correction or a double flat / double combination. The huge flat is more likely. They more commonly have deep B waves than combinations have deep X waves (in my experience).
A huge flat correction would be labelled super cycle (a)-(b)-(c). It now expects a huge super cycle wave (c) to move substantially below the end of (a) at 666.79. C waves can behave like third waves. This idea expects a devastating bear market, and a huge crash to be much bigger than the last two bear markets on this chart.
The second idea is a combination which would be labelled super cycle (w)-(x)-(y). The second structure for super cycle wave (y) would be a huge sideways repeat of super cycle wave (a) for a double flat, or a quicker zigzag for a double combination. It is also possible (least likely) that price could drift sideways in big movements for over 10 years for a huge triangle for super cycle wave (y).
Importantly, there is no lower invalidation point for this wave count. That means there is no lower limit to this bear market.
This bear wave count now has two ways to see downwards / sideways movement from the all time high, so two weekly charts are presented below.
MAIN WEEKLY CHART
Click chart to enlarge.
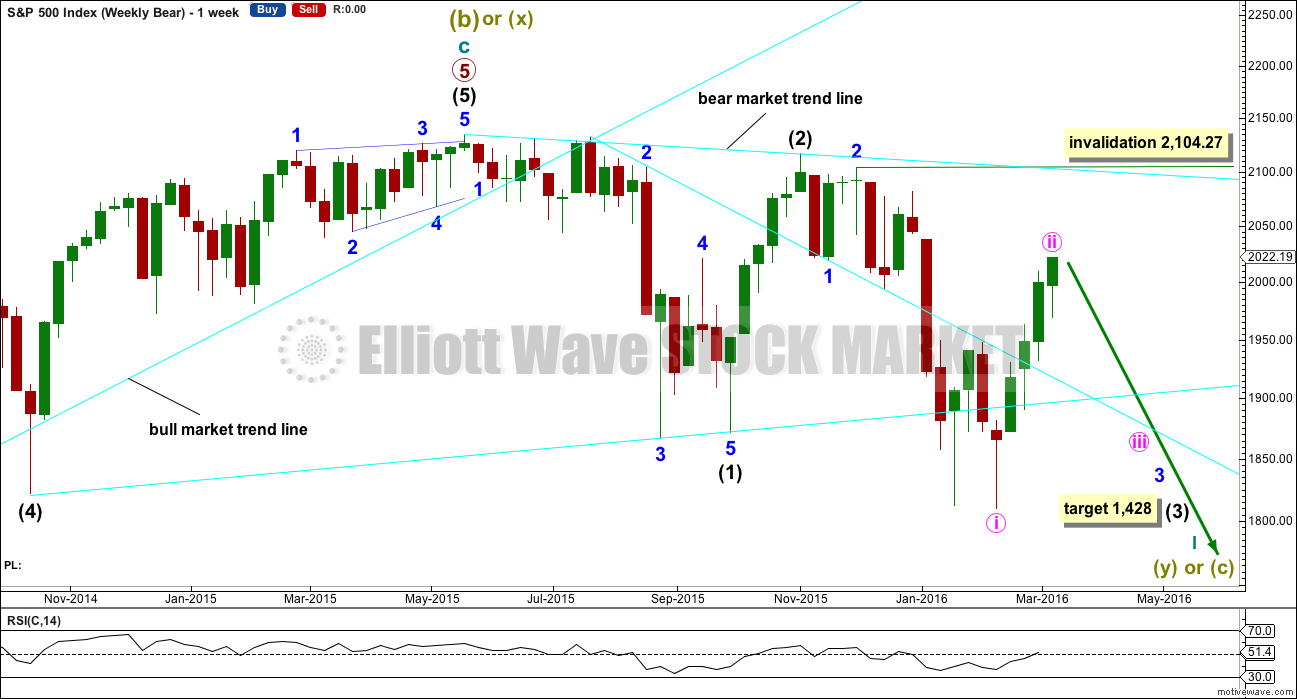
This third wave for intermediate wave (3) still has a long way to go. It has to move far enough below the price territory of intermediate wave (1), which has its extreme at 1,867.01, to allow room for a following fourth wave correction to unfold which must remain below intermediate wave (1) price territory.
Intermediate wave (2) was a very deep 0.93 zigzag. Because intermediate wave (2) was so deep the best Fibonacci ratio to apply for the target of intermediate wave (3) is 2.618 which gives a target at 1,428. If intermediate wave (3) ends below this target, then the degree of labelling within this downwards movement may be moved up one degree; this may be primary wave 3 now unfolding and in its early stages.
Minute wave ii is now longer in duration that minor wave 2 one degree higher. This has now reduced the probability of this wave count this week, which is why the alternate is presented.
DAILY CHART
Click chart to enlarge.
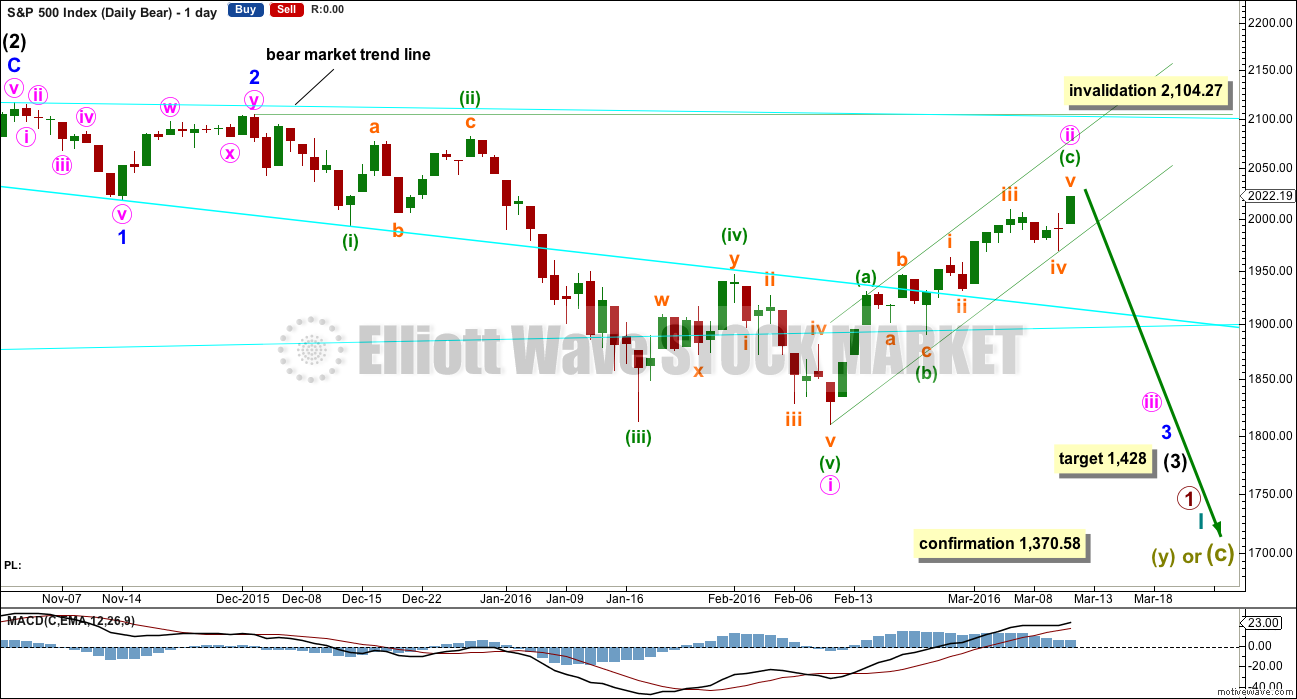
Intermediate wave (2) lasted 25 sessions (not a Fibonacci number) and minor wave 2 lasted 11 sessions (not a Fibonacci number).
Minute wave ii has now lasted 20 sessions, nine longer than minor wave 2. At this stage, the size of minute wave ii no longer gives the wave count the right look, so for this reason the alternate below is published. The S&P does not always exhibit perfect proportions, so this wave count remains entirely valid. However, at the end of this week, the proportions are beginning to look too far from even for this wave count because minute wave ii is almost twice the duration of minor wave 2. The probability is reduced.
A best fit channel is now drawn about minute wave ii. If this channel is breached by a full daily candlestick, it would be earliest indication that minute wave ii may be over.
Minute wave ii may not move beyond the start of minute wave i above 2,104.27.
At 1,428 intermediate wave (3) would reach 2.618 the length of intermediate wave (1).
HOURLY CHART
Click chart to enlarge.
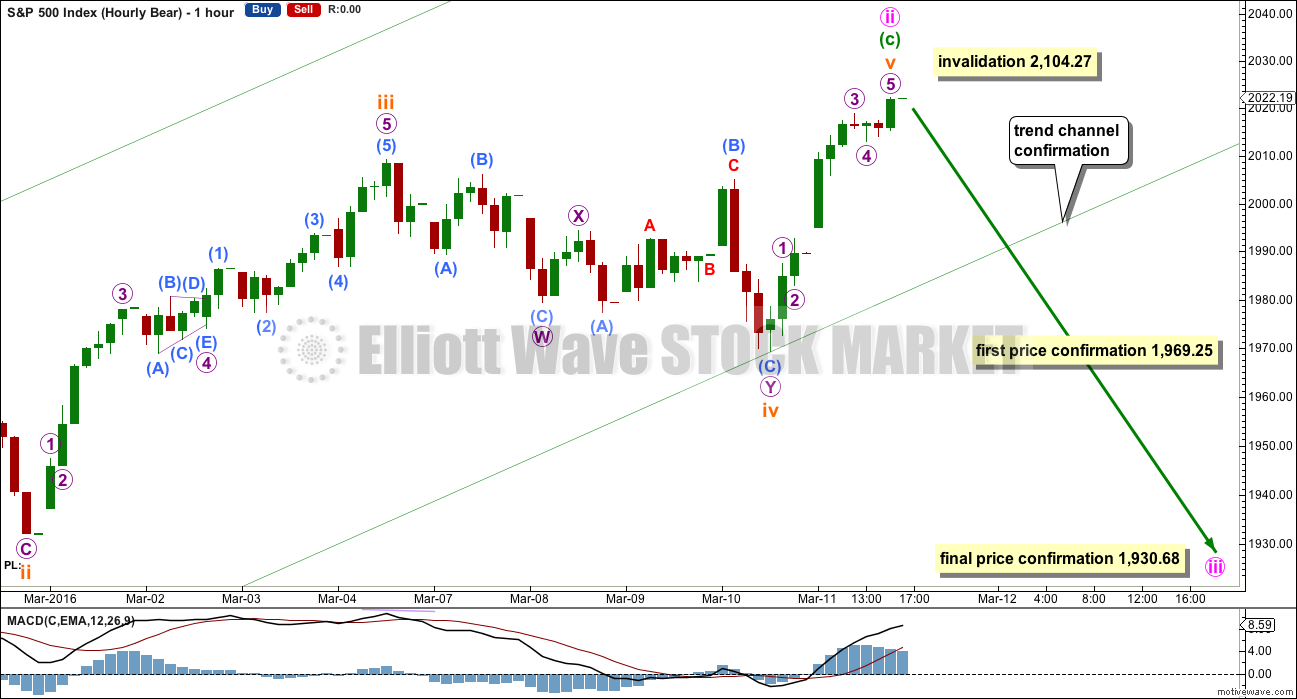
A-B-C of a zigzag and 1-2-3 of an impulse subdivide in exactly the same way: 5-3-5. This upwards movement may be a completed zigzag, or the fifth wave of subminuette wave v may still move higher.
The invalidation point must remain at 2,104.27 while there is no confirmation or indication of a trend change.
Earliest indication of a possible trend change would come with a breach of the best fit channel.
Earliest price confirmation of a trend change would come with a new low below 1,969.25.
Final price confirmation would come with a new low below 1,930.68. At that stage, confidence may be had in a third wave down.
ALTERNATE WEEKLY CHART
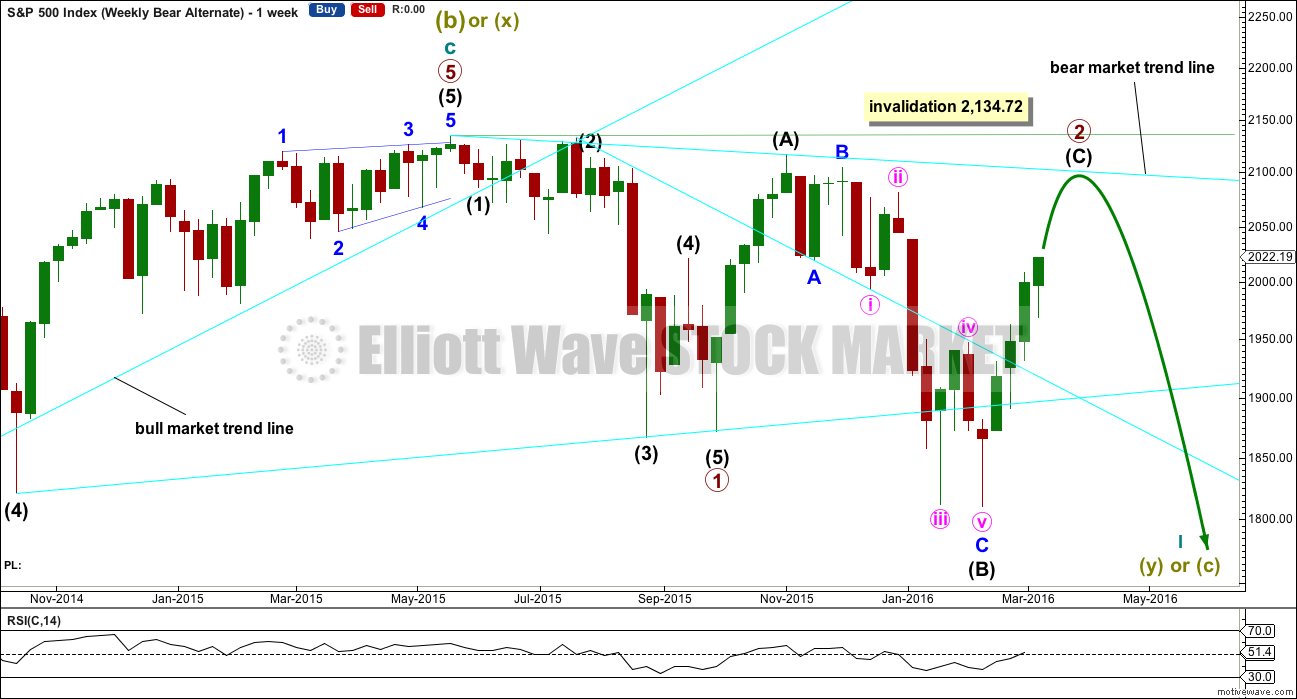
Click chart to enlarge.
This is a new wave count.
The impulse downwards for primary wave 1 is seen in the same way as the main bear wave count with the exception of degree. Here, the labelling is moved up one degree. Primary wave 1 may be complete and may have lasted 19 weeks, two short of a Fibonacci 21. So far primary wave 2 has lasted 22 weeks. It looks unlikely to continue for another 12 weeks to total a Fibonacci 34, so it may end in about two to five weeks time. This would still give reasonable proportion between primary waves 1 and 2. Corrections (particularly more time consuming flat corrections) do have a tendency to be longer lasting than impulses.
Primary wave 2 may be unfolding as an expanded or running flat. Within primary wave 2, intermediate wave (A) was a deep zigzag (which will also subdivide as a double zigzag). Intermediate wave (B) fits perfectly as a zigzag and is a 1.21 length of intermediate wave (A). This is within the normal range for a B wave of a flat of 1 to 1.38.
Intermediate wave (C) is likely to make at least a slight new high above the end of intermediate wave (A) at 2,116.48 to avoid a truncation and a very rare running flat. However, price may find very strong resistance at the final bear market trend line. This line may hold price down and it may not be able to avoid a truncation. A rare running flat may occur before a very strong third wave down.
Primary wave 2 may not move beyond the start of primary wave 1 above 2,134.72.
ALTERNATE DAILY CHART
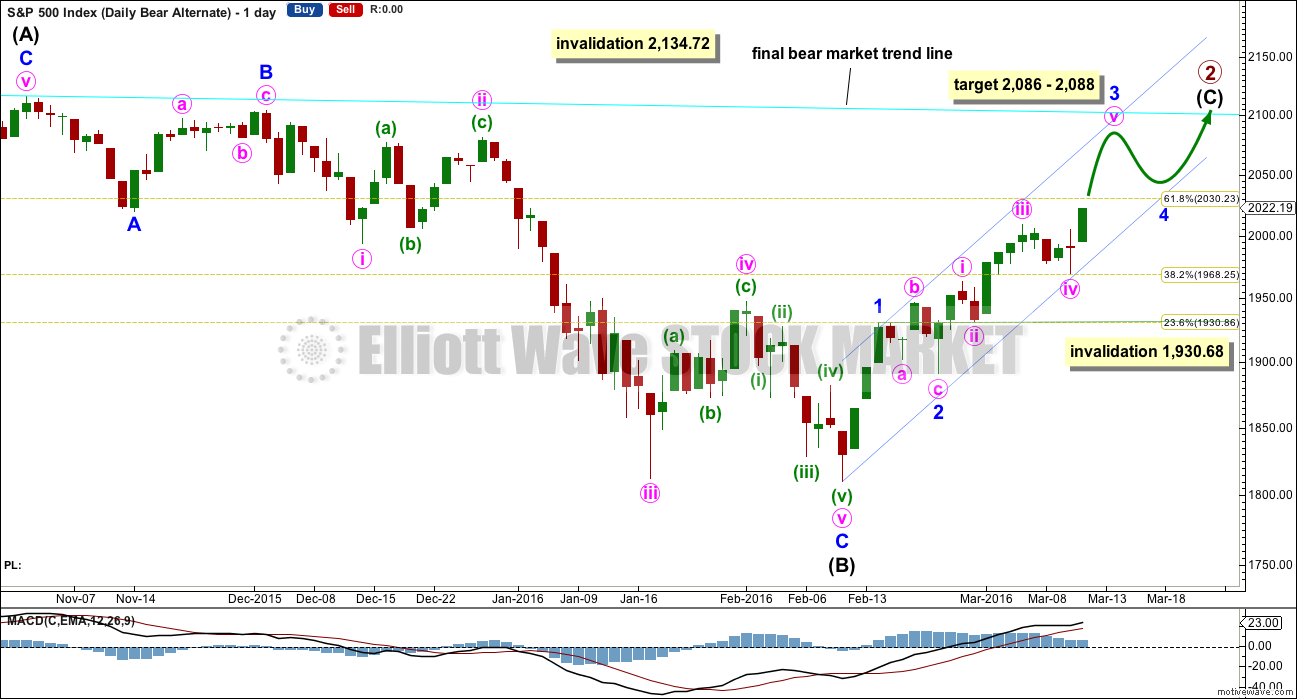
Click chart to enlarge.
This new alternate bear wave count avoids the large problem of a truncation for the last bear alternate. This new wave count has a higher probability for this reason, so the last alternate will not be published at this stage.
Intermediate wave (A) fits nicely as a single or double zigzag.
Intermediate wave (B) fits perfectly as a zigzag. There is no Fibonacci ratio between minor waves A and C.
Intermediate wave (C) must subdivide as a five wave structure. It is not unfolding as an ending diagonal, so it must be unfolding as a more common impulse.
The short / mid term target for minor wave 3 is exactly the same as the short / mid term target for the bull wave count. A-B-C of a zigzag and 1-2-3 of an impulse both subdivide 5-3-5. The labelling within this upwards movement of each subdivision is the same for both wave counts.
Price is approaching the 0.618 Fibonacci ratio at 2,030. It may find some resistance there.
When minor wave 3 is a complete impulse, then minor wave 4 downwards may not move into minor wave 1 price territory below 1,930.68.
Intermediate wave (C) does not have to move above the end of intermediate wave (A) at 2,116.48, but it is likely to do so to avoid a truncation. If it is truncated and primary wave 2 is a rare running flat, then the truncation is not likely to be very large. As soon as price is very close to 2,116.48 this wave count looks at the possibility of a trend change.
The next wave down for this wave count would be a strong third wave at primary wave degree.
An hourly chart is not published for this idea because it would look mostly the same as the hourly chart for the bull wave count.
If price continues any higher, this may be the only bear wave count. If price continues higher, the main bear wave count will further reduce in probability. It may be discarded before it is invalidated by price.
If this alternate bear wave count is correct, then upwards movement for Friday is the start of a fifth wave within a third wave. The decline in volume is acceptable and makes sense. Further, a third wave of a C wave is sometimes weaker than the first, with the fifth wave weaker still. This wave count would fit with volume and momentum as long as the third wave of minor wave 3 within intermediate wave (C) is not the weakest.
TECHNICAL ANALYSIS
MONTHLY CHART
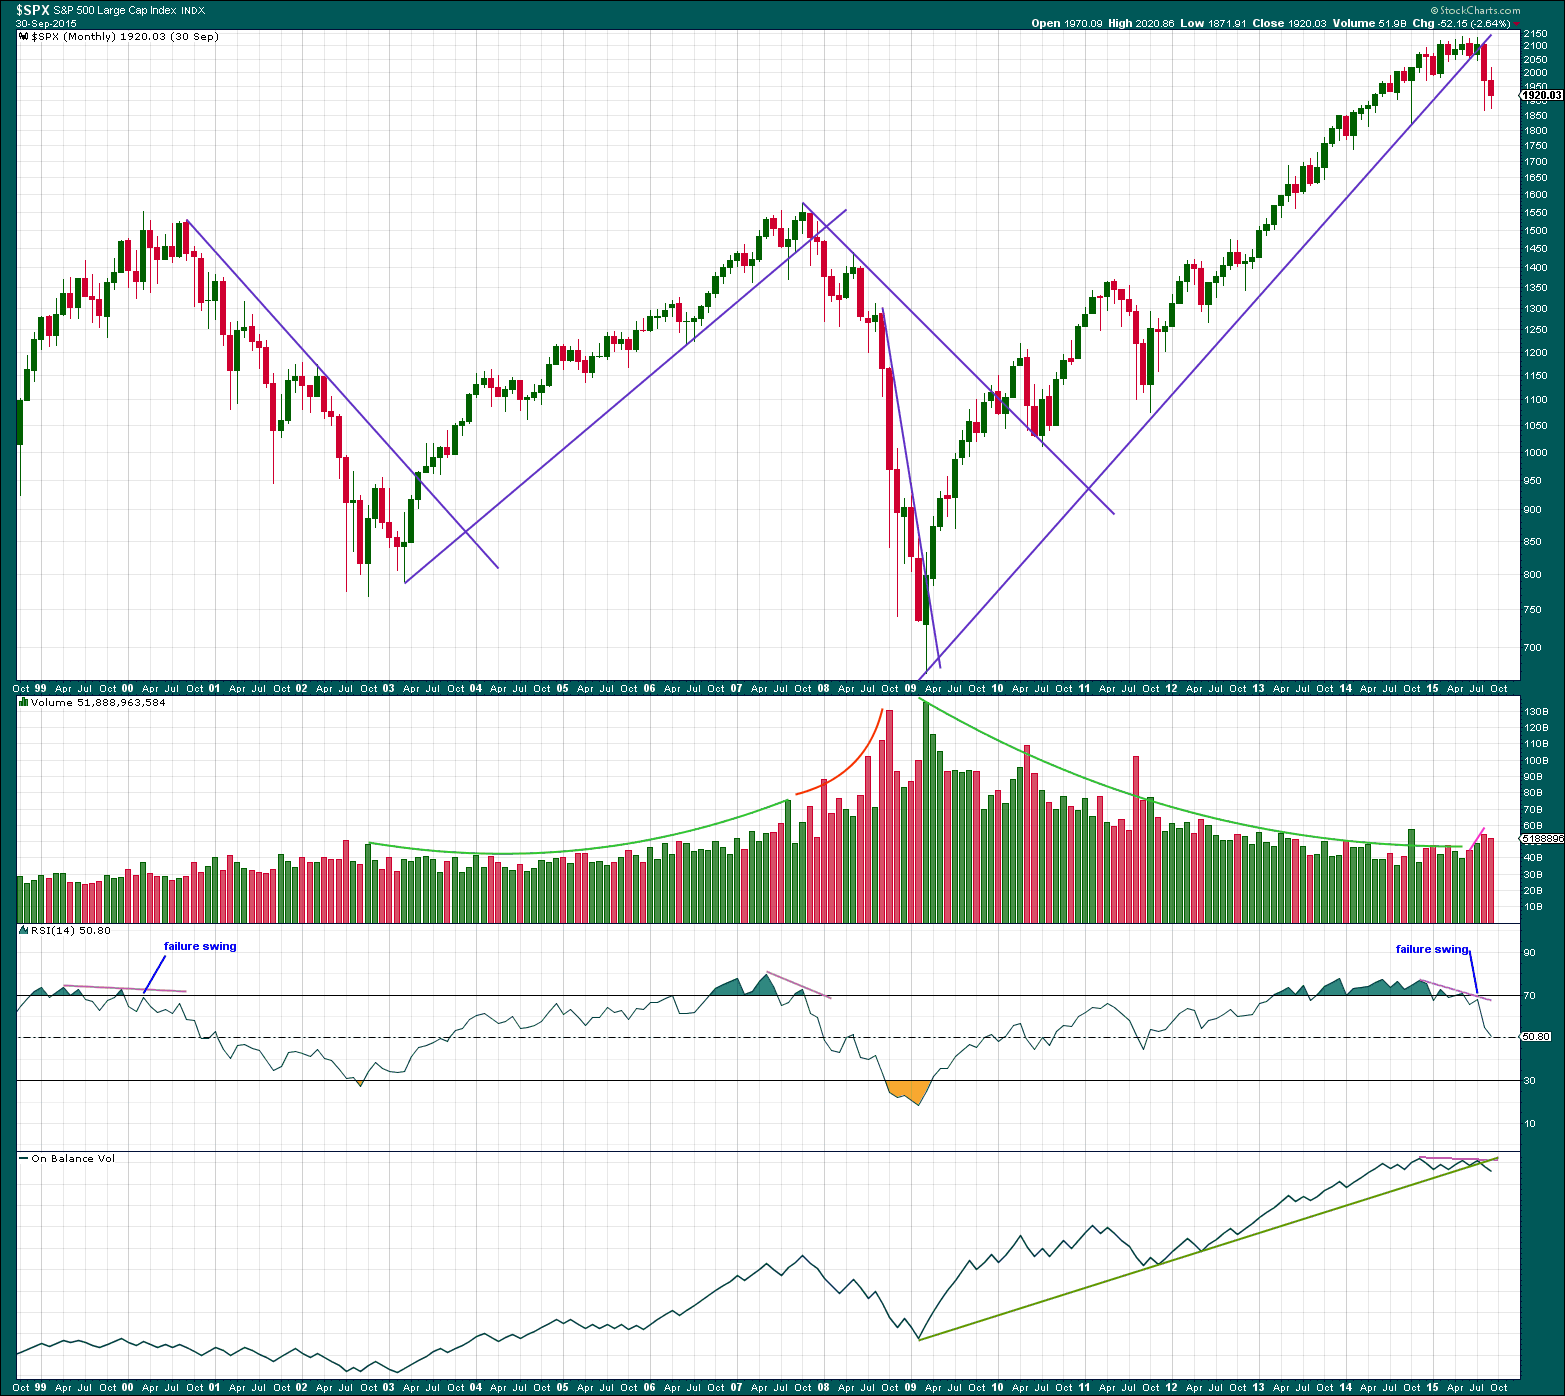
Click chart to enlarge. Chart courtesy of StockCharts.com.
The long trend line on price is drawn from the low of March 2009, at 666.79 to the low in October 2011. This trend line was repeatedly tested, breached, and then provided resistance in August 2015. Price has closed well over 3% of market value below it. Trend lines like this one which are reasonably shallow, long held and repeatedly tested are highly technically significant. The breach tells us the market has switched from bull to bear. This supports the bear wave count over the bull.
Volume has overall declined during the bull market spanning over 6 years. The rise in price was not supported by volume at the monthly chart level. This also supports the bear wave count over the bull.
RSI shows double negative divergence with price as the final highs were made. Finally, a failure swing on RSI completes a pattern which was last seen in September 2000, and October 2007. This pattern indicates a large bear market may begin from here and supports the bear wave count over the bull.
On Balance Volume also shows divergence with price (pink line) as the final highs were made. On Balance Volume has breached a very long held trend line (green). This is further support for the bear wave count over the bull.
Since the all time high in May 2015, downwards movement is coming with an increase in volume at the monthly chart level. This further supports the bear wave count over the bull.
Not only is there nothing bullish about this picture at the monthly chart level, it is very bearish indeed. It indicates that recent downwards movement is more likely to be the start of a large bear market than it is to be another correction within a continuing bull market.
DAILY CHART
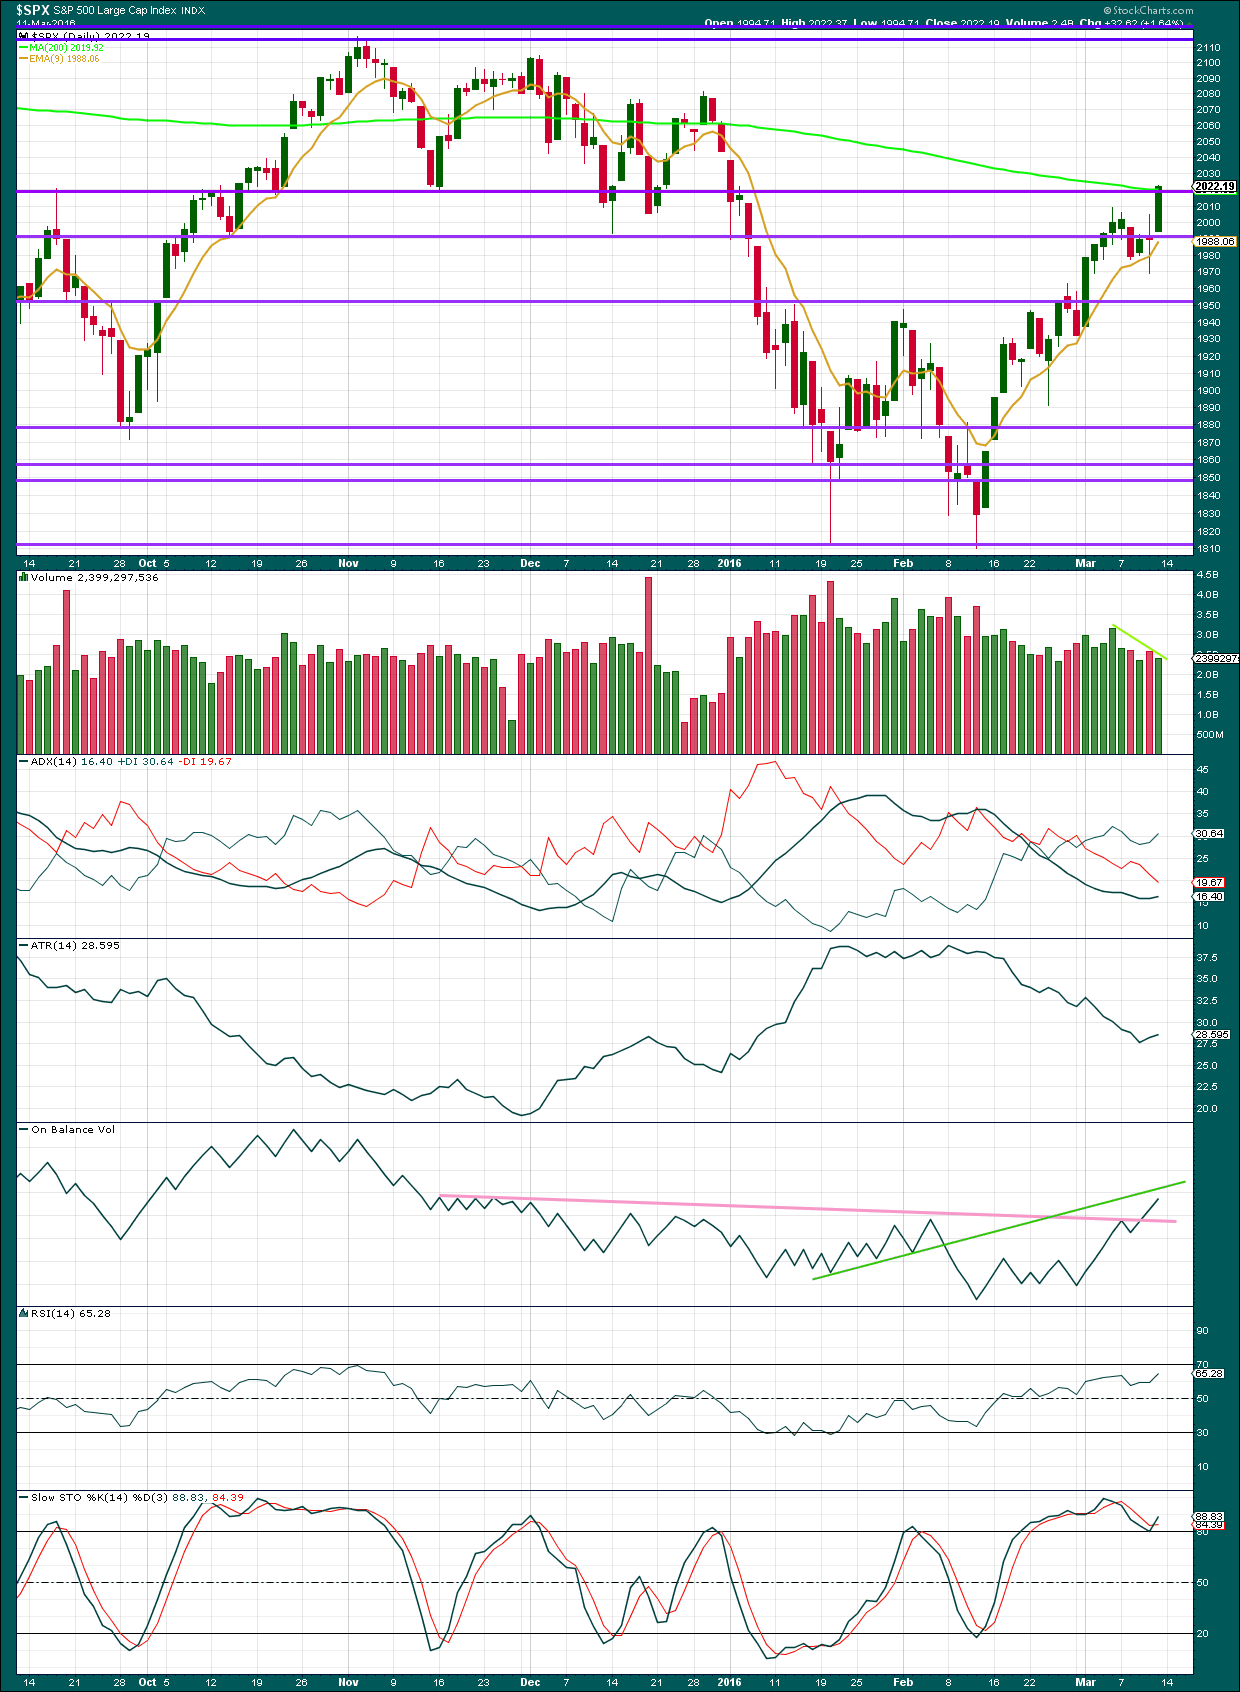
Click chart to enlarge. Chart courtesy of StockCharts.com.
Volume data on StockCharts is different to that given from NYSE, the home of this index. Comments on volume will be based on NYSE volume data when it differs from StockCharts.
The strong green daily candlestick for Friday comes with a decline in volume on both StockCharts and NYSE data. The rise in price again is not supported by volume. This supports a bearish wave count over a bullish. If this rise in price is a third wave, it should show support from volume (third waves should not be this weak).
Overall, as price continues higher, volume is declining. The volume profile continues to be bearish. This looks more like a bear market rally than a new bull market. But the problem with bear market rallies is it is impossible to tell exactly where they will end, which is why price confirmation for this market is so important.
ADX is now turning upwards finally indicating the market is trending. The trend is up. ADX is a lagging indicator as it is based on a 14 day average. ATR finally agrees. With these two indicators now in agreement, it should be assumed that the trend (at least short term) is up until proven otherwise by price confirmation of a trend change.
On Balance Volume has provided a fairly strong bullish signal with a breach of the pink trend line. This line is almost horizontal, repeatedly tested and long held. It is highly technically significant. The next line to provide some possible resistance for OBV is the green line, but this is not very technically significant.
With ADX and ATR now indicating the market is trending, it should be expected that Stochastics may remain extreme for some time.
RSI is not yet overbought. There is further room for the market to rise.
Price may find some resistance here about the 200 day moving average and the horizontal line about 2,020. If price reacts from resistance here, it may offer an opportunity to join the short term trend. However, a warning is given: with the larger technical picture so very bearish any short / mid term trades with the short / mid term upwards trend must be carefully managed. The larger bearish picture sees a strong crash coming, but not yet here. Any long positions must have stops, so that your account is not wiped out if a crash occurs earlier than expected.
Along the way up, expect price to find support about the 9 day moving average.
DOW THEORY
For the bear wave count I am waiting for Dow Theory to confirm a market crash. I am choosing to use the S&P500, Dow Industrials, Dow Transportation, Nasdaq and I’ll add the Russell 2000 index. Major swing lows are noted below. So far the Industrials, Transportation and Russell 2000 have made new major swing lows. None of these indices have made new highs.
I am aware that this approach is extremely conservative. Original Dow Theory has already confirmed a major trend change as both the industrials and transportation indexes have made new major lows.
At this stage, if the S&P500 and Nasdaq also make new major swing lows, then my modified Dow Theory would confirm a major new bear market. At that stage, my only wave count would be the bear wave count.
The lows below are from October 2014. These lows were the last secondary correction within the primary trend which was the bull market from 2009.
These lows must be breached by a daily close below each point. So far the S&P has made a new low below 1,821.61, but it has not closed below 1,821.61.
S&P500: 1,821.61
Nasdaq: 4,117.84
DJT: 7,700.49 – this price point was breached.
DJIA: 15,855.12 – this price point was breached.
Russell 2000: 1,343.51 – this price point was breached.
This analysis is published @ 05:55 p.m. EST on 12th March, 2016.
The current bear market rally looks quite similar to the rally from the end of September 2015 to very early November 2015. That was 245 SPX points up. The moves are similar in cross over of moving averages, MACD, MACD historgram and more.
If this rally continues to move mirroring the rally last October for 245 points, that will make a tagret of 1810 + 245 = 2055.
Today is the Lowest Total Volume of the Year for the SPX!
543.726 Million
Two Down… one to go!
DOJI for the Daily Chart right at the 200 DMA 2019.39 & close 2019.64
Tomorrow 200 DMA is ~ point lower and declining.
Doji on Deck! 🙂
(right at the 200 dma no less…) Farewell Spanish Ladies…!
Nothing to see here then! Move along…..
</sarc
We know that “Skynet” also saw that doji today and know exactly what people are going to be thinking, and probably doing, as a result. I’d give em a few days to whiplash eager beavers…a perfect opportunity to slip a few more UVXY calls under my tunic, a la Abbie Hoffman…
d
not one of your more informative posts
Again, I laugh. Thanks doc4bax. You know, life is too short not to laugh.
I agree; an unintended missive! 🙂
Or maybe just practicing reciting the alphabet!! 😀 😀 😀
efg? Campari and Soda clearly hittin the spot 🙂 🙂
I decided to have a duckfart instead…
That is the 6th and final JB on R of the night!
I am having a vision of a market crash this week immediately after the Fed raises the Fed Funds Rate to 0.75%.
China down, Japan down and Oil down…
Seems tepid for a three up. Could we already have a four and five up??!!
Dropping out of triangle but be careful- they often reverse and continue the previous trend…Oh well..another non-committal day…
Perhaps the move up from todays lows was the B wave of an expanded flat with wave C down now?
Overlapping mess today. Needs Lara’s keen eye to untangle it.
Indeed! Interesting action in VIX. Back to (the) futures! 🙂
Have a greaaaat evening all you tigers!
Presume volume lower again today?? – soon there’ll only be members here showing in the volume figures – we’ll just need to have an internal count of our own trades 🙂 🙂
Have good evening everyone…
Even in lamenting moods, you make me laugh out loud. Thanks Olga. I needed that.
O.K. Time to nibble on UVXY 32 calls expiring next week. Tiny position- no need to get carried away….! 🙂 🙂 🙂
(Trying to steal ’em for 0.75 cents)
In there with ya
See that little leap up in UVXY right since the close? We at least got a little scalp.
Yep! 🙂
For anyone that cares… Volume update: much lighter today than yesterday to this point:
294.828 Million Today at 3:00PM
341.244 Million Friday at 3:00PM
OH… the pain… OH the carnage… I can’t take it any more!!!!!!!
HELP ME…………… HELP…………… HELP ME…………
LOL………….. Time for Johnny Walker Black on the Rocks, at least three!
Have a great night all!
I’d make it at least four lol 🙂 🙂
Campari and Soda please…! 🙂
Take heart mateys! I think we are close to the end. Look for a spurt into the close…
Is this rascal about to do a truncation???!!!!!
Make that a sputter…! 😀 😀 😀
Arnold Palmer for me,, now we are partying !!
And with a slight new high ten minutes ago as I type this message, the S&P is indicating this rally is not over.
The last thrust up from the March 10 low at 1,969.25 subdivides perfectly as a completed five.
It was followed by a very shallow three down.
Now there is a slight new high. And so I will label that last thrust from the March 10 low as a first wave, the three down as a second wave correction. Which means a third wave (at a very low degree) may now be just beginning.
Yep! I agree. Premium quite high on calls. Selling 201.5 puts to scalp move up.
Hi Lara – would you say the overlapping mess from todays lows is a 1st wave diagonal followed by 1,2s?
The B of my triangle idea is a really nice 5 so I knew it was a bit dodgy.
Caught out (yet again) by it… 🙁
Possibly… a leading contracting diagonal up to todays high.
Diagonals have corrective properties, hence they subdivide as a series of zigzags. That may explain the hesitant nature of todays movement.
It meets all the rules for a leading diagonal. And an ending contracting diagonal too actually. But it looks slightly odd in that the first wave is really long…
Closing half of spread by buying back SPY 200 puts. Will hold 198 puts expiring this week courtesy of the house.
I remain very skeptical absent a demolition of the round number pivots. We just had one cash dump. I expect another if that does not stir the animal spirits.
Wish I understood any of that!! 🙂 🙂
(PS – don’t waste yer time trying to explain to me – will go in one ear and out the other lol 🙂 )
I’m relieved Olga to hear I’m not the only one who does not understand properly what Verne is doing.
Hedging is the one topic when I did my CMT III with which I just could not fully and deeply understand. I don’t know why. We used Kaufman “Trading Systems and Methods” and I found it difficult to follow his language. I thought that was why I couldn’t understand hedging.
The concept seems simple enough. But the details of the practice elude me.
I keep reading and thinking about your comments Verne. One day it will click 🙂
Actually credit spreads are very easy and would perfectly suit your personality!
For a bullish put spread, you sell a put and limit risk by buying one, ususally, but not necessarily of the same expiry date at a LOWER strike price, and pocket the premium. Risk determined by how wide the spread is- each point difference means 100 dollar risk per contract if price moves below the lower strike and spread held to expiration. Now what could be simpler than that for an aeronautical engineer? 🙂
Mmmm- seems a bit like robbing Peter to pay Paul to me, but if it makes money then nuff said!
Is probably my deep rooted distrust of options (and all other financial ‘instruments’) that makes me switch off when reading anything about them.
It is really one of the lowest risk directional trades you can make – bullish put spreads in an uptrend, bearish call spreads in a downtrend. Most folk let the spread expire worthless (if they are right) and pocket the premium. I like to use them to get positioned rent-free ahead of an anticipated trend change. Some wiseguy once told my you make more safe money in the markets by selling, rather than buying. The longer I trade, the more I think he was right on the money (so to speak!) Done right you should walk away with the money 75% of the time without having to manage the position. 🙂
Updated triangle idea?? Some of the sub-divisions might be a bit dodgy….
Triangles have certainly been the wave form of choice lately. A thrust out of it should confirm…
SPX has closed gap from Friday…
Looks that way atm – 2018.35 would be wave e – I’ll be watching that level.
We might get a throwback to the BD trendline.
If correct then means this current move will be terminal / triangle fully retraced – just the small matter of what level that will be at. Not much higher according to triangle thrust calcs (2028 maybe?).
UVXY going lower…last move up corrective. It should take out 26, at which time I start nibbling…
Well this is interesting- SPX failure to close gap at 2022.19 from last Friday highlights market lack of momentum. We can expect another cash dump into the close in an attempt to mask underlying weakness. I plan on using cash dump at the close to buy back SPY 200 puts as I think we could see a strong move overnight…UVXY seems to be basing…hoping for a move under 26
Volume Friday – 641 million
Volume so far today 250 million…(anemic day)
More like pathetic! 🙂
Nice falling wedge in UVXY. Lots of talking heads asserting DJI about to break to upside out of mini cup and handle for third wave up…VIX hanging tough…we will see…. 🙂
Some interesting statistics about bear markets… this series of videos is back to basics evidence based analysis. Bear markets have had 46% up days, huge rallies, all while losing 56%.
https://www.youtube.com/watch?v=9kdwq-LmW6I
We often forget some of the most violent rallies are seen during bear markets. The multitude of 1% or more up and down days we have been seeing of late are not generally seen during bull markets.
Looks like we have yet another triangle of one sort or another consolidating ahead of a push higher…
Fantastic link David, thank you very much for posting it.
Solid technical analysis there which we can rely on.
Also, a solid understanding of probability.
I’ll be following this analyst.
Thanks David! Looks like this service is taking an objective approach to the market similar to Lara’s work here. I’m impressed and will look into this further.
Interesting divergence of volatility with price. Looks like a few folk getting positioned early. I think a much better entry point is coming and quite soon. There should be a final spike down to shake out the early birds and signal at least an interim top. If it happens intra-day with a strong bounce off the bottom that would be awesome!
Repelled at the declining SPX 200DMA (Daily Chart) of 2019.39 once so far today after 1st breaking down below it.
Oil Today:
WTI Down -1.62 or 4.21%
Brent Down -1.16 or 2.87%
I cannot understand why the US equities are not following. Thanks Joseph for the information.
Because the impulse up is not complete. The current wave is clearly corrective so we need at least one more wave up. A red doji at the 200 dma could signal that we are done but I think we get one more blast higher.
As long as we above those round number pivots shorting this market is a fool’s errand. Been there done that… 🙂
Have been and continue to be short for long-term.
The dumb SPX option trade I put on a few weeks ago will expire worthless… Dump, Stupid, moronic… I broke all my rules. That’s why I can’t read most of what is posted here. It lead to the dumb, stupid, moronic trade I put on. I will read what I paid for and inter-day update posts and comments from a couple of others here and thats it.
My long planed long-term strategy which I will not deviate from:
Will look to trade completely out of my Leap SPX Jan 2017 options (put on May 2015) and my SDOW shares on the next major move lower. I will continue to hold SPX Jan 2018 options I just put on unless it goes lower than bear targets above on next major move down (I will evaluate then, if it occurs). From there I will trade the counter trend corrective waves up and main waves down the rest of the way in this Bear Market which will last for years.
If this is the effect on you of having a few options expire worthless they are definitely NOT a trading instrument for you Joseph, and you are quite right to stay as far away from them as you can…. 🙂
No it’s the effect on me of breaking my rules… not the $1,300
O.K. I get it. Even when you execute your trades exactly according the rules of your trading plan, they still will not all be profitable. Let your hair down a bit every now and then…life’s too short!
‘Nuff said! 🙂
Not saying you are wrong Verne, but I can count a complete 5 down 3 up from the high – new highs will of course put that theory to bed (gap down could be a zig zag).
I can also count a complete 5 wave impulse from 1969 – this might be a wave 2 though (or the other wave still not finished). We need a low under 2005.88 to tell us that this wave is finished, then a low under 1969 to tell us that this is not a 2nd wave.
Looks to me like we need at least one more lower low to complete the c wave if this move down today is corrective (unless we are currently tracing out a triangle).
4th wave triangle idea (if we shoot higher) – albeit this possible ‘thrust’ is looking tired which reduces odds of this playing out.
Seems to me just as likely that we have either topped or have one more lower low to go to finish an abc correction from 2022.
Move up from this mornings lows look corective imo – so is either a b wave or a wave 2 (or a d wave if the triangle in chart is playing out)
We *could” still be in D of the triangle – maybe I was rushing the triangle count???
Think this will morph into something else as W2 to W4 proportions starting to look silly – but sometimes that happens on lower timeframes.
Increased my UVXY position with stop (on newly bought portion) at todays highs.
Sorry – stop just above 2022 I meant. UVXY position now at 25%. Will bail if this next move down look corrective.
You could be right. I am probably seeing and extended three up. RUT has certainly been weak and in the past a leader. We should get some confirmation shortly…2022.37 line in the sand…
UVXY tends to make a strong move down just ahead of the blast off…if a top is in we should see it today…
Stink bid on March 24 UVXY 25 strike calls for 0.75. Currently bid at 3.6
We need one more wave up after this fourth wave. I am looking for a new 52 week low in UVXY to confirm a second wave of at least intermediate degree or higher. Nice fill on pullback of SPY 200/198 bullish credit spreads at 0.72. Open buy to close of 200 puts contingent on SPY below 200. I do not expect SPX to get much past 2050.00
Another twist for ECB
German right wing tells Mario Draghi: This may be the last time
http://www.marketwatch.com/story/german-right-wing-tells-mario-draghi-this-may-be-the-last-time-2016-03-14?link=MW_latest_news
Wow… someone had nothing better to do this weekend. Sorry, can’t read all this stuff posted.
Still waiting and confident…
Interesting news bite about auto loans
To understand how far the U.S. auto business has been reaching for new customers, consider the early performance of a bond issue called Skopos Auto Receivables Trust 2015-2.
The bonds were built out of subprime auto loans and sold in November. Through February, about 12% of the underlying loans were at least 30 days past due, a third of which were more than 60 days delinquent. In another 2.6% of loans, borrowers had filed for bankruptcy or the vehicles had been repossessed.
I have closed my short position (1/3 of a full position) and remain SOH.
Good luck.
Interesting that oil is down almost 3% this morning, but the S&P futures are down just little. I guess that correlation only matters when it matters 🙂
no wonder stocks are going up – I’ve just read that share buybacks this quarter are set to top $165 billion!
DORIAN-CATALIN
I won’t attempt to comment on your wave counts but I appreciate your hard work.
Very smart to compare several different indexes (SPX, NDX, DJI). Also smart to recognize how / why “skynet” may impact markets as I believe skynet may actually use market psychology to influence wave patterns, so they may see ahead and profit. Possibly the reason we seem to be getting so many less probable EW waves.
As your work is complicated would you consider posting a short summary (only 1 or 2 sentence each) describing what you expect SP500 will do (1) this week (2) this month?
Thanks
Thank you very much:) I also would like to say i just studied the oil, the gold and more the german DAX. They all now correlate with my view which is something I find amazing. But ofc that if 1 of those markets goes completely out of view and predicted move, I will need to adjust or completely rethink or even discard all my work…. To answer, I expect sp500 to start a small decline today-tomorrow of 38,2-76,8% of the swing from the low that started thursday up to the high that will be around 2030 tomorrow expecting, altho on DJI looks like top possible was in friday. Then I would expect another final up move towards 2040-2060 to end major A(or major 2). After that and I think all this will happen this week very fast, i expect a major down swing towards the EPA of the wolfe pattern that could bottom as soon as next week (the line connecting wf1 and wf4). But… to be honest, I give small chances of price touching the EPA line on sp500, maybe it will do so on the NDX100 :))) WHy? Same reasons…. skynet 🙂 And that is why i still think another up move after all has high chance to happen later next months (sell in may in go away?) and maybe this will shift/transform into a major 2 flat. This would frustrate both bear and bulls into a 1800-2100 trading range, perhaps even more till summer why not? :))) P.S. I talk too much as a habit and also in real life I have been told, so I am sorry, but am bad with summarizing lol 🙂
1more thing and very important: PLS DO NOT POST MY CHARTS ANYWHERE ELSE ON ANY PUBLIC OR EVEN PRIVATE FORUMS! It only represents my belief and view and that is all, I may be wrong or I may be incredibly right! I do not want “Skynet” to change the future lol :)))) Ty for understanding!!!!!!!
OH… forgot post the NDX 4hour chart as proof for bull case invalidated… Can’t count a primary III with 1-2-3-4-5 there, yea? Or maybe somehow there is a way and my goggles don’t see it… Oh btw Lara, what do you think of the simetry and look and duration even of my interm. wave II with the major 2 I invision? Well ofc they dont be yet interm. or majors or primaries, that only time will prove. Same as per sp500 ofc…. Right, talk to you guys later tomorrow…. 🙂
We are coming onto some VERY significant levels of resistance.
In fact, in Sept 2014 the market dropped 200 points from Friday’s closing print. It also dropped 150 points from that very same level in Sept 2015.
So the way i see it, basically, if you subscribe to the bear thesis now is not the time to abandon that outlook, as we are in the range where any potential reversal would most likely happen. If its wrong, then 2020 to 2080 range will prove that to me.
IF, the market is going to present us with a move to the downside then the resistance levels I’ll be watching are 2022, 2027 2038 2048.
Support wise if 2000 breaks then consider that a cooling of the bullish momentum and I’ll be looking for 1994 next, then 1978 and 1965.
Below 1965 and we may really have something going…
I hear ya Stuart. What makes this wave two up, whatever the degree, so dangerous is that it is taking place in the absence of any kind of even short term capitulation. We have not really had anything even close since last August. It could be short lived for that reason alone…
Thanks Stuart. I hear what you are saying. That is why I continue to be torn. It certainly could turn down from these levels. Just as likely, it could go sideways for a few days then break down. But the upside risk is 2104 for the bear counts. And if it goes that high, we are on the way past 2200 and more. In October 2015, the SPX blasted right through the 2020 resistance level and did not stop until 2116.
Hi! :)There is no upside risk if it goes to 2100 ever in the following 2 months , put a stop at 2120 and go for it lol! But I hardly imagine Mr Market or Skynet will ever give us a 2100 oportunity! Coz downside potential from there is legendary, so risk/reward is comical! At best i see 2080-90 short lived for like 1-2minutes and I expect that in about 1month to happen only if it really does…. But, maybe this market has made me crazy in the head indeed, only time will tell, who knows :)) Just trading waves, no ideea, who am I? :))))
Hello guys! Pls stay tuned as I will post something very interesting! Upon alot of brainstorming during the weekend specially saturday coz i took sunday off for myself, I almost now finished doing my counts on sp500 and ndx100. I believe there is a high correlation between NDX100 (ustech100, nhq100) and sp500 or DJI as it should be in fact and it should be normal. They all should have almost exact same elliot wave count with only slight variation. What I have discovered I think is indeed a revelation. I have checked all elliot wave rules and do not think I invalidated any of the rules. I have 3 charts to post: 1hour sp500, 1hour ndx100 and daily ndx100! Lara, I think you will like what you will see and pls take your time to consider my ideeas and charts. They speak for themselves and I have put extreme work into them. More then that, I have come up with a possible outcome and prediction for the confusion of a market and why things didnt go 100% according to plan lately but they will soon enough, we need patience for this bulishness and market participants (human behaviour psichology) to go more extreme even! Here is the 1st chart on 1hour sp500
Ok, let me explain this: after looking more closely on all sp500, ndx100 and DJI myself I have come up with 1 big conclusion: THERE CANNOT BE NO BULL COUNT!!!:) I know I sound arrogant but here is why: I cannot see any zigzags 5-3-5s while anaylising the not just the spot action but more importantly the FUTURE ACTION. I think one should account for future action aswell. WHy? OK guys look I live in Romania, I make money or loose it on the sp500 or ndx100 while trading this indexes or cfds or futures during hours you will not trade it normally. Sure, they do not have so much volume as during normal US trading hours but it represents PRICE ACTION NEVERTHELESS. Ok, moving forward: I count a huge expanding diagonal in the process right now to finish wave C of major A of MAJOR 2 or even the MAJOR 2 very soon, most likely next week. The evidence for this is the fact that futures action invalidated a bull count in my view with the simple fact that minute wave 4 of C overlapped minute wave 1 by a mere 2 points!!! BUT there is more STRONG EVIDENCE : the chart of NDX100 spot that you watch, no matter how u chart it, u cannot make a bull case for it, simply coz minute 4 overlaps minute 1 by alot there. On futures the overlap is big and the case for an extended diagonal has the best look. Do not forget the sp500 and DJI with being the most traded are manipulated markets by “Skynet” and other factions! Manipulation is designed to confuse both bears and bulls, trying to make everyone loose money just as in a casino game where the house always wins. I also have lost alot of money and made it back after and so on. Survival is important in this important, if confused and not sure 1 should take a break and come back later. But if we are patient, I believe indeed amazing market oportunites are ahead of us. HERE IS NDX100 4HOUR CHART: aswell as on sp500 , the wf1-wf5 represent WOLF WAVES. To study this more, simply google it. 🙂 Now here goes nothing: i think the huge top of markets including sp500, DJI, NDX100 ended in november 2015! Why? coz thats when NDX100 topped and all the rest indices simply made a truncated top there! Pls think of this possibility, ideea more and take into consideration, I am not only person btw considering it, although I am the only 1 who came up so far with this ABC- with the C ending diagonal expanding ideea! As for the future outcome, maybe my Major A will be Major 2, but i would give it a 30% chance. WHy? SImply coz Skynet is ruling the markets! If I were Skynet, I would plunge the market soon but not to new lows just abit near them, making this decline look like a 5 which will be a 3 – this will encourage bears thinking the up move will be just a (ii) and then go up again to new highs in a major C of major 2 which will be a 5 going close to all time highs but not touching them! Actually on the NDX100 it would be alot lower then the highs as the resistence line uniting the 02.12 and 29.12 highs has nice downward slope. This NDX100 market has a better overaall bear look because it is not manipulated, thats why i trade it! Now the sp500 has a not so downward slope uniting highs of 04.11 and 02.12> If this future outcome may proove correct, then the fall starting MAJOR 3 or interm. or 2 we shall see but I think will all this crazyness it should be amazingly strong so 70% chance for it will be a primary or major starting there) will be of EPIC PROPORTIONS, perhaps going as much as 4,23 or more fibonacci ratios of the whole major 1 that i count as I said from the 04.11.2015 high down to the 11.02.2016 low!!! 🙂 P.S. I highly believe in my analysis this time, Lara, pls take your time to analyse it accordingly, thank you!
1. Please use paragraph breaks in your text. Reading a wall of text like that is very difficult to digest and understand.
2. Please do not use all caps. It is the digital equivalent of shouting at people. I know you intend to use it as an emphasis, but please don’t do that.
3. There is no “major” in Elliott wave degrees.
4. Futures markets are not the same market as the cash market. Just because a wave count is invalidated with action in futures does not mean it is invalidated in the cash market. Each of these markets will have separate Elliott wave counts. They will be similar, but they may not be the same.
Comment on the chart posted:
5. I have asked you before to put all labels of all degrees you are considering. Please do this. It makes your charts much easier to understand.
6. Your second wave correction at the beginning labelled orange II suffers from the same problem I outlined in the video. It technically is a double zigzag. But a double zigzag should have a slope against the prior trend. Not only does this not slope, it moves in the same direction as the prior trend, downwards. This substantially reduces the probability of this wave count.
7. The correction appears to be counted a A-B-C (incomplete, in blue). If this is the case it can only be an incomplete flat because you have A as a three, a zigzag. This means B must be 90% of A or more to meet the minimum requirement of a flat correction.
About the wolf waves: I posted a possible wolf5 fail as the market activity went beyond the connceting wolf 2-4 white line it is now back above, but as I said with sp500 being manipulated, there is evidence that the NDX100 did not do this and it never came even close to violating yet the wolf2-4 line. When that breaks on the NDX100 i expect the major B or primary 3 even to start its roots!
CHART NR.3: my long-term view on NDX100 !
Clearly, we can observe here that the advance from 2009 lows to 2015 highs is a big fat 5 wave advance up to nov. 2015 with the august lows marking primary IV! It is my belief that the sp500 has the same advance with only a slightly truncated high! SO the real bear market began in nov2015 in my view! If you can come up with arguments to change my overall long term view or medium-short term, pls do so, but this is what I see with my goggles and I trade what I see! I will post 1more chart with sp500 long term view ! It all makes sense to me now why also on the sp500 the 2009-2015 is a 5 wave advance with truncation just to make very few people think about it and accept this view as possibility! WHY?? SImple guys: EXACTLY BECAUSE IT IS IMPROBABLE, HAS LOW CHANCES, DOES NOT HAVE THE PERFECT LOOK! but does it violate any elliot waves rules??? No, it does not, on the contrary! Has a truncation of this proportions occured anytime in history on the sp500 or DJI??? Oh yea baby it did!!! 😛 only 1 time in history during the 1970-1980 or was it 1950-1960 bull market, cant remember Tony Caldaro posted that once! Nor does it make importance coz people forgot it or those people died and new generations didnt take notice. THe same thing can be said about MY ENDING EXPANDING DIAGONAL on the short term chart- that is a rare improbable almost imposible thing to happen that also only happened just once in history on american indexes as some author from some site proclaims = I have done research about this pattern! Yet it did!!! May conspiracy live on, yes? :))))
So…based on your theory of a fifth wave truncation in November you see us currently in intermediate two up, is that correct?
I think one of Lara’s partners at the Elliott Wave Lives On has a similar count if I am not mistaken…
Yep… but this interm. 2 can be done soon here or become a flat( expanding or running I would presume then) … Time will tell… 🙂
Lol as I speak, futures embarking already 4 of 5 of 5 in another diagonal!!!!!!!! More proof 😛 Maybe we top tomorow about 2030 after all and start decline towards 1990-2005 then the last wave up to 2045-2085 and we are done, at least for a while! Let’s see 🙂
Dorian-Catalin:
In response to this chart copied below:
Within an ending diagonal all subwaves must be zigzags.
The fourth wave in your wave count is a flat correction because B moves beyond the start of A.
Within a zigzag B may not move beyond the start of A.
Within wave 1 of your diagonal you have labelled wave C as an a-b-c. Wave 1 must be a zigzag . Within a zigzag the C wave must subdivide as a five.
Also, this diagonal is expanding? The third wave looks shorter than the first. That doesn’t meet the rules (if my calculation on where I see that is correct, please check that it is)
So that wave count does not meet all Elliott wave rules.
Please read the rules in Frost and Prechter, 10th edition.
Ok, Lara, sorry about the caps and wall of text. 🙂 I have copied the text into my chart from http://elliottwavepredictions.com/wave-notes/ Yes, wave 4 is an expanded flat but it can also be a zigzag as A can be counted as a 5wave minidiagonal? Even if it is a flat, maybe the rules of Prechter must be rewritten< although I do not see any mention of this extremely rare pattern ( the expanding ending diagonal) that the corrective waves within it must be zigzags and cannot be flats, at least here in Sid’s work, so maybe 4 is, no ideea really. And no, wave 1 is 82 points while wave 3 is 87 points , wave 3 exceeds wave 1 in all indexes, even including the german DAX with this theory.
Also regarding the ideea that the whole ABC up from 1802 ( on sp futures) till the coming high predicted will be just the end of minor A for a big fat flat that would occur over the next months or the end of major 2 (or primary 2 , or intermediate 2) – I have no ideea, it is just a proposition, something to keep in the back of my mind and a possibility. This possibility has more logic when connecting this market to the possible outcome of gold, oil and the German DAX which has not retraced yet 62% of its prior downtrend. And the DAX usually retraces at a minimum 62% in any wave 2 up – in which it also is caught now.
Frost and Prechter, 10th edition, pages 86 to 91 has a comprehensive list of rules and guidelines.
“maybe the rules of Prechter must be rewritten”.
If you want to find the right Elliott wave count then you absolutely must start from a point of following all the rules. All the time.
If you think that you can rewrite the rules to suit what you want to see, then your time will be wasted. And if you publish those wave counts here and present them as valid, with confidence, I will remove them.
It is my job to teach members Elliott wave, I cannot let members rely on work which violates Elliott wave rules.
Sid Norris did not write the book on Elliott wave. And (I know him, he used to be a member of my first Elliott wave website years ago) I’m pretty sure Sid uses the rules as laid out in Frost and Prechter.
Rules for diagonals are pages 88 and 89.
“waves 1, 2, 3, 4, and 5 of an ending diagonal, and waves 2 and 4 of a leading diagonal, always subdivide as zigzags”.
Do you have a copy of Frost and Prechter “Elliott Wave Principle” 10th edition?
If you do not then I strongly recommend you get one. It is the only Elliott wave text you should refer to. Much has been written about Elliott wave by others, and much of that includes different “rewritten” rules. It will not only be unhelpful it will waste your time.
The only text anyone should ever be reading about Elliott wave is Frost and Prechter.
And all wave counts all the time must meet all the rules.
Very curious to see what futures will portend. I am thinking that the ultimate irony would be for Mr. Market to deliver a vicious truncated fifth and head South like a bat out of you-know-where. There is hardly a single bear who has not been screaming BULL! 🙂
Sneaky, Sneaky…Sneaky!!!
Yes. That is why I am waiting to see the open even though I have a strategy to exit my shorts now.
The hourly on Lara’s Daily Bear (first bear count) show that we might be through with the current wave ii. If the market goes down hard, I certainly will not exit. I am going to give it enough rope to hang itself.
I have decided that trading this market on the long side in the context of a bear market rally does not offer an acceptable risk/reward ratio. Here is the way I am going to play it.
I will be using credit spreads to get Mr. Market to pay me to get positioned short term for the next leg down. I consider the SPX 2000 pivot to be key to future price action so on Monday I will sell to open the March 18 SPY 200/198 bullish put credit spread for a limit price of 0.50 cents per contract. The downside risk with a gap down past 198 is 200 per contract, and you keep the premium if SPY stays above 200 the rest of the week. If the market reverses suddenly, the 200 puts can be bought back while retaining the 198 puts which will absolutely explode if a third down commences. I will enter a buy to close on the 200 puts contingent on an SPX close under 2000. What about youse guys? 🙂
Sounds like a plan. I need to bail on this UVXY position – will watch the market on Monday to see if there is a chance of a correction to sell into – if not then I’ll just take the hit. No point waiting for a correction if it happens alot higher than here.
The new count is tricky but might also present the risk reward trade of the century. If we go very close to all time highs and the technicals are still weak, I’ll throw the kitchen sink at it with a stop at ATH. There are still a few other counts on the table before that though so I’ll remain flexible.
The new count is also very interesting in structure – if P2 is sideways it means that P4 will likely be very swift and sharp – possible even coming up to ‘sniff’ P1 before diving back lower – that again could present another incredibly low risk high reward scenario.
So in some ways the new count could be very lucrative despite being mega frustrating. I like it in that nobody else seems to be seeing it. It has bugged me for quite some time that alot of other EW people are seeing the main bear count.
One step at a time though – as soon as I’ve finished my current ‘damage limitation’ I’ll be on the sidelines waiting to pounce. Lara has provided some fantastic road maps to guide us.
I was really looking forward to riding P2 up and once again, like that sneaky truncation back in August, Mr Market seems to be always just one step ahead. It is like he sees what we are thinking and says- “Not so fast…!” I’m almost tempted to just wait for UVXY to signal another near term top with a new 52 week low and then as you say, throw the kitchen sink (and the dishwasher) at Mr Market. I fully expect the next trend reversal to be as sneaky as the previous ones. It’s enough to make your head spin! Considering the downside targets, we may indeed be facing a historic shorting opportunity! 🙂
Verne, Olga and all,,
My reflections, strategies and comments follow. If it is too lengthy or boring, go ahead and skip it. But I appreciate your transparency in trading strategies and figure I will do my part too.
In reviewing the market I am persuaded the current / intermediate trend is up. There are several areas of resistance over head and potential topping targets. But the current trend on the daily level is up. The bulls are in control and have been for the last 20 trading days. That is what a one day reversal warns.
I do not have a good sense for where it will turn around. When I do not have a good and reasonable expectation of the market, it is time to exit. This trade will most likely end up a loss. The mistake on this trade was I entered a bit too early. However, I did wait until the channel breach and the 1st price confirmation. But it did not reach the second price confirmation and the trade went against me. So I am okay in the sense that I was not making uninformed or reasonable decisions. It just did not work and that is a reality of trading.
My trade before the most recent one worked out to be an excellent entry point. It became quite profitable the very next day. However, that was the big reversal day when the market was down hard but reversed and ended up strong. I did not get out with a profit because I had to be away from my desk for most of the day. I closed the position with a relatively small loss. So I must take this inability to be connected all day every day into account as I develop my strategies. I need to have strategies that fit the reality of my life.
I plan on being on-line all day Monday. On Monday morning I will look at the futures before the open, if they are flat or down, I will look to unload my short positions early. If it gaps 10 or 15 points down, I’ll begin a trailing stop loss. If the market opens up only a few SPX points, I will sell my short positions closing out the trade. If the market gaps up 10, 12 or more points, I will probably wait for a correction. We are only 17 points from t he gap on the daily chart from January 4th (2038-2043) which is a reasonable place to expect a correction and perhaps a larger correction. The danger is that it may not correct for a while. So this is my least desirable strategy.
Once I close the current position, I will be looking to enter short again because I am convinced we are in a bear market and the long term trend is down. I will devise a strategy for my needs and wait for confirmations including channel breaks, price confirmations, sentiment and momentum indicators etc to persuade me the bears have taken back control of the market and it is headed down. If I miss a potentially profitable position, so be it. The next trading day is only 24 hours away. But I am not going to keep throwing money at the market hoping it will go my way. I hate to loose. I hate to loose money too.
Finally, I am printing out this strategy and every time I am tempted (especially by greed) I will read this post reminding myself to stick to the plan. Make the market show its hand not only for the long term but for the intermediate term as well.
My short term account is not as profitable as earlier. I am now up 20% for the year.
Good luck to all.
Thanks Rodney. I am starting to think we can almost come up with a standard bullish trade on SPX by waiting of it to break an uptrend channel and go long! 😀
20% for 3 months is still awesome…
Yes. But I broke some rules that I do not suggest or always do myself. I had large positions. More than the recommended 4-5%. I also used highly leveraged instruments. When I take such large positions, I have a very close by stop loss. That is the way to reduce risk. This last trade is a smaller position.
Hi Lara,
what if on your main bear wave count your minute wave 1 was actually minor wave 1? That would save the minute wave 2 vs subminuette wave 2 proportion problems.
Then you have to see an impulse over from the end of intermediate (2) to the last low on 11th February,
Which means such a wave count then has to have that problem of the double zigzag which does not look at all like a double zigzag, in fact looks completely wrong, for the second wave.
It just doesn’t make sense.
The impulse would have to be what I have for the main bull wave count. And TBH I think thats a horrible wave count. It’s so forced that impulse. I have no confidence in it in Elliott wave terms let alone other technical terms. I’ve published it mostly to be ultra conservative.
I plan on taking Lara’s warning quite seriously. While I intend to trade the upside move, I will do so with very small position sizes and ONLY intra-day. There is something really ominous about the way this market is behaving and I think we are in for a few more surprises such as we saw last August with that UVXY spike in the middle of a corrective fourth (as opposed to the end of a third and fifth) wave along with the fifth wave truncation. There is no way I am keeping long positions overnight in this market, I don’t care how many fat green candles it prints. I would not be surprised to see something like a massive volatility spike happening in the middle of a huge up day as smart money go all-in in preparation for P3 to the downside, or some other such anomaly which will have folk scratching their heads and wondering what is going on…be careful out there…
Hi! 🙂
Today I can say, “Dammit. You beat me.” Verne, you get the weekend warrior award!
As always, Lara, excellent. As usual it will take me a few reads (and listening to video) to digest it all and form my strategy.
Always confused why Lara is never first. Inside info and all 🙂
because I am really lara, and lately I have been letting others win to not be obvious,, hee hee
I have an unfair advantage. And I like to be fair.
And really, I have the alter ego of dox4bax 🙂
Verne, are you still hanging on to your UVXY position? I’ve still got mine (very small), but it doesn’t look to me like its going anywhere but sideways in the short term.
Still have leaps and will add to those at a new 52 week low. lightened up on shares. Gave a fuller response under the video thread.
Thank you. As a long time follower, I’m having a bit of difficulty ….have you discarded much of what you charted a week ago…and is there one preferred, expected count?
Thanks.
For UVXY I think there is an excellent chance we will see new 52 week lows so option traders may need to roll unless they have leaps. I think holding the shares will be fine but one should anticipate a possible reverse split depending on how low they go. I will continue to hold mine and sell covered calls. I freed up a bit of trading capital to scalp the upside with either puts on UVXY or calls on SPY, depending on price action Monday. Bottom line is I think the bear market is farther along than we realized and P2 up may now be underway. This calls for a tactical shift in the short term. if we hold the 200 dma I will execute those trades on Monday.
Hey Verne, would you mind elaborating a bit more on your approach with selling covered calls? I am holding some UVXY shares and would like to hedge/scalp using that approach. When selling covered calls how long do you give to expiration? Are you selling calls that expire 1, 2, 3, 4 weeks out? I’m assuming anything longer than 4 weeks doesn’t make sense at all, as the market could turn and scream lower at the blink of an eye before then.
Thanks I appreciate your thoughts and insight as always.
To sell covered calls against your position you will need to own 100 shares for each option contract you sell. I like to sell contracts at least one month out ( you will be selling call options), buy them back after the calls have declined in value by at least 50%, the re-sell call options at a lower strike price and do the same thing as long as the price continues to decline. This is an excellent way to cushion the draw-down on a long position that you do not want to exit. Most folk do not have the stomach for the kind of draw-down that can occur in an etf like UVXY so it is definitely not for everyone. I have traded the animal for a long time so I have seen just about everything it throws at you that would send most novices, as Olga so colorfully stated, “running away screaming as if their hair was on fire!”
If this is a P2 wave up as I believe it is, UVXY is going to make a new 52 week low so you have to be ready to hang tough. If it makes a new 52 week low, it will be the best buying opportunity for UVXY in the last 7 years. The only reason I would consider exiting my long position the shares is to use the capital to buy more call options at a new 52 week low.
Hope that helps a bit! 🙂
Thanks, this is VERY helpful. I appreciate the warnings regarding UVXY, I have been watching it and seen that it can be quite the wild beast. I just opened a small long position recently so at the moment i’m only down a small amount on the shares. I also have some SPY puts expiring in December, have taken a beating on those in the last month. I sold half of my put position at the recent bottom, in retrospect wish I had sold it all, was certainly not expecting to be contemplating new all time highs less than a month later. But as many have said, this is the purpose of a wave 2, to make everyone believe the worst might be over. I have until December on my put position, expecting that SPX will find its way lower between now and then…
Hold onto those December puts for dear life. In fact, I would be definitely adding to them as the market inches higher. I took another look at the UVXY chart and entered a “stink bid” to buy April 1 calls if it trades below 25. I realize it will probably go a bit lower but my risk tolerance is a bit higher than most. I imagine there is an outside chance of it breaking 20 but I seriously doubt it. If it does, it would probably be intra-day on its way to printing a very big fat green reversal candle, so will continue to accumulate small amounts of calls if I can get filled at ridiculous bids…
I have a buy order in at 25.5 — maybe that isn’t low enough! I thought I would buy there and add if it goes lower. Isn’t 24.8 the 52 week low? 20 seems incredible but if it gets there I am a buyer. 🙂